


- Semiconductor Materials & Components
- Data Center Switch Market
Data Center Switch Market Size, Share, and Growth Forecast 2026 – 2033
Data Center Switch Market by Switch Type (Core Switches, Distribution Switches, Access Switches), by Port Speed (≤10G, 10G to 40G, 40G to 100G, 100G plus), by Technology (Architecture Layer, Network Technology), End-user (Cloud Service Providers, Telecommunications Providers, Enterprises, Government & Defense, BFSI, Manufacturing, Media & Entertainment), and Regional Analysis, 2026 - 2033
Data Center Switch Market Size and Trend Analysis
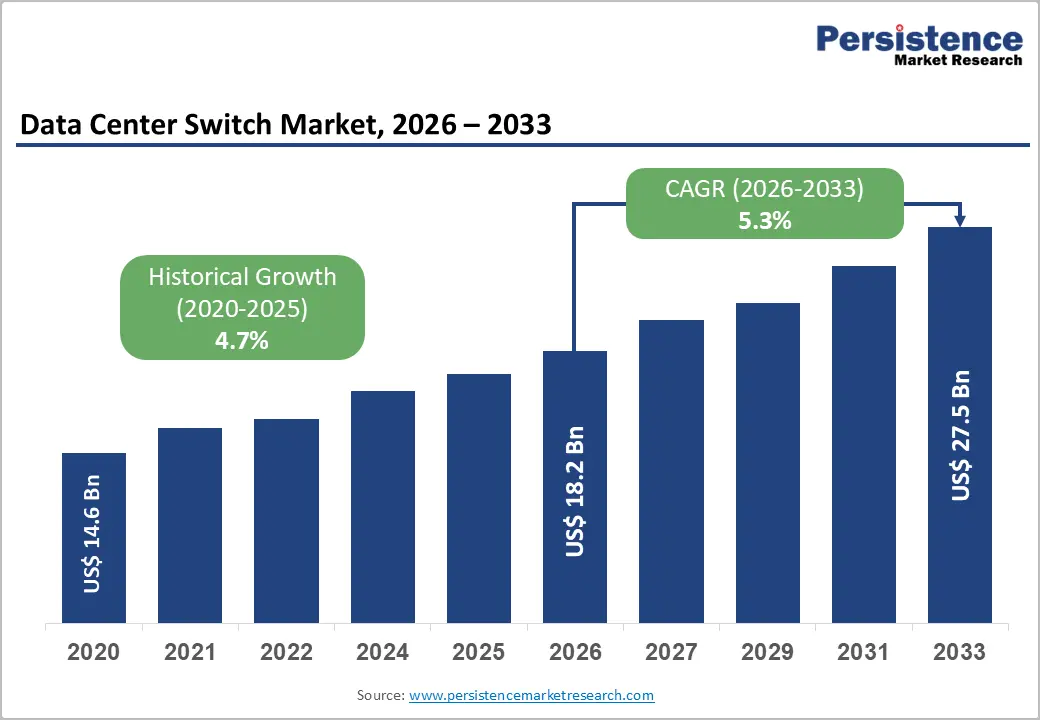
The global Data Center Switch market size is expected to be valued at US$ 19.2 billion in 2026 and projected to reach US$ 27.6 billion by 2033, growing at a CAGR of 5.3% between 2026 and 2033.
The Data Center Switch market is on a structurally reinforced growth trajectory, driven by the convergence of AI workload infrastructure demand, hyperscaler capacity expansion, and the global migration of enterprise IT to cloud and hybrid architectures, collectively requiring higher-bandwidth, lower-latency, and software-defined switching fabric at unprecedented scale.
According to ITU estimates, global internet users reached approximately 6 billion, or 74% of the world's population, in 2025, up from 60% in 2020, generating data traffic volumes that necessitate continuous investment in data center networking infrastructure. The transition to 400G and 800G port-speed architectures to support AI cluster interconnects, combined with the proliferation of edge data centers to minimize latency for real-time applications, is simultaneously driving switch ASP (average selling price) growth and deployment volume expansion across every end-user vertical.
Key Industry Highlights:
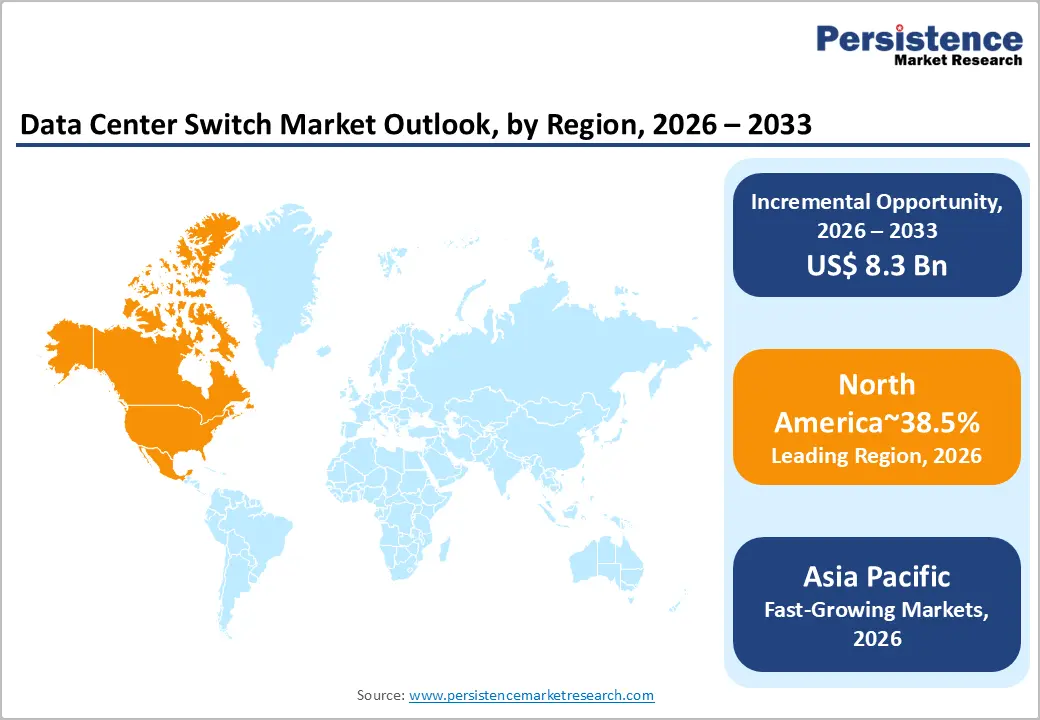
- Leading Region: North America leads the global Data Center Switch market with approximately 38.5% revenue share in 2025, anchored by the U.S. market valued at US$6.2 billion, driven by hyperscaler AI infrastructure investments exceeding US$ 200 billion collectively in 2025 and the concentration of Amazon, Microsoft, Google, and Meta's largest global data center campuses.
- Fast-growing Market: Asia Pacific is the fastest-growing region through 2033, propelled by China's East Data West Computing national program, India's US$ 4.5 billion committed data center investment pipeline, and Southeast Asia's emergence as a hyperscaler co-location hub, collectively generating the region's 29.5% global revenue share in 2025.
- Leading Switch Type: Core switches dominate the switch type segment with approximately 45% market share in 2025, reflecting their per-unit ASP premium from deployment as non-blocking AI cluster spine fabric, with Arista Networks' 7800R3, Cisco Nexus 9000, and Juniper QFX10000 platforms commanding six-figure procurement values per chassis at hyperscale.
- Fast-Growing Switch Type: Access Switches represent the fastest-growing type segment at a projected CAGR of 5.3% through 2033, driven by edge data center proliferation for IoT and 5G latency-sensitive applications, with Eurostat confirming 70% EU IoT device adoption in 2024 and India's BharatNet and 5G programs driving distributed switching demand at population scale.
- Opportunity: The market opportunity lies in 800G Ethernet switch platforms for AI cluster infrastructure, where Arista Networks, Cisco, and Juniper are launching production-ready platforms targeting hyperscaler AI buildouts with per-switch revenue 3–5x higher than 100G predecessors, representing a margin-accretive upgrade cycle through 2033.
DRO Analysis
Drivers - AI Infrastructure Buildout Demanding Ultra-High-Bandwidth Switching Fabric at Hyperscale
The global AI infrastructure investment cycle has become the most consequential demand catalyst for data center switches, as large language model training and inference workloads require switching fabrics capable of sustaining non-blocking, ultra-low-latency, high-bandwidth east-west traffic between thousands of GPU nodes. Microsoft, Google (Alphabet), Amazon AWS, and Meta Platforms have each disclosed capital expenditure programs exceeding US$50 billion annually for 2025, predominantly directed toward AI-optimized data center buildouts, with switching fabric a critical cost item in GPU cluster networking.
NVIDIA's DGX SuperPOD configurations, each requiring high-radix 400G and 800G Ethernet or InfiniBand top-of-rack and spine switches to interconnect GPU nodes, exemplify the per-rack switch demand intensity that AI infrastructure is generating at hyperscaler scale. Every major hyperscaler AI cluster expansion translates directly into multi-million-dollar switch procurement programs.
Enterprise Digital Transformation and Cloud Migration: Compelling Data Center Network Modernization
The structural migration of enterprise IT workloads from legacy on-premise data centers to hybrid cloud, multi-cloud, and colocation environments is compelling systematic network infrastructure modernization, including the replacement of aging 1G and 10G switching estates with 25G, 100G, and 400G architectures that support software-defined networking (SDN) and intent-based networking capabilities.
The EU's information and communication services sector, comprising approximately 1.4 million enterprises, employing 7.2 million people, and generating €667 billion in value added in 2022, is actively digitizing and migrating its IT infrastructure to the cloud, driving enterprise data center switch procurement. India's telecom sector gross revenue growth from US$ 39.22 billion in FY24 to US$ 43.42 billion in FY25, combined with the rollout of 5G infrastructure, is simultaneously driving carrier-grade data center switch refreshes among telecom operators across the Asia Pacific region.
Restraints - Supply Chain Complexity and Semiconductor Shortage Exposure Constraining Switch Availability
Data center switches incorporate high-performance application-specific integrated circuits (ASICs), including Broadcom Tomahawk, Tofino, and Trident chipsets manufactured in advanced semiconductor nodes with limited global fabrication capacity. The 2020–2023 global semiconductor shortage demonstrated the acute vulnerability of data center switch supply chains to ASIC availability disruptions, with lead times extending to 52 plus weeks for high-bandwidth switch platforms.
While supply has largely normalized, the concentration of advanced ASIC production in TSMC's facilities in Taiwan creates a persistent geopolitical supply risk that enterprise and government buyers cannot fully mitigate, creating procurement uncertainty and budget planning challenges that moderate demand conversion rates.
High Total Cost of Ownership for 400G and 800G Infrastructure Limiting SME Adoption
The transition to 400G and 800G port-speed switching infrastructure, while technically essential for AI workloads and future-proof for enterprise scale, involves capital costs that remain prohibitive for small and medium enterprise data center operators.
A 48-port 400G Ethernet switch from Cisco, Arista Networks, or Juniper Networks typically carries list prices exceeding US$ 100,000, with fully loaded deployment costs including optics, cabling, and management software multiplying the total cost of ownership by a factor of 2–3x. For enterprises in price-sensitive markets, including Southeast Asia, Latin America, and Sub-Saharan Africa, this cost reality constrains migration timelines and maintains 10G and 25G architectures as the predominant deployment tier, moderating high-speed switch segment revenue growth below demand potential.
Opportunities - 800G Ethernet and AI-Optimized Switching Platforms as the Next Technology Refresh Cycle
The industry transition to 800G Ethernet and 1.6T switching for AI cluster interconnects represents one of the most significant technology refresh-cycle opportunities in data center networking history, with hyperscalers and AI infrastructure operators committed to upgrading from 100G and 400G architectures on accelerated deployment timelines.
The Ethernet Technology Consortium's publication of the 800G Ethernet specification and Broadcom's launch of the Tomahawk 5 ASIC supporting 51.2 Tbps of switching capacity are operationalizing this technology transition for commercial deployment. Arista Networks and Cisco have each announced production-ready 800G switch platforms, with Microsoft Azure and Google Cloud confirmed as early deployment customers. This cycle is expected to drive a 3–5x increase in per-switch revenue relative to the 10G–100G generation, creating a structurally margin-accretive opportunity for switch manufacturers through the 2026–2033 forecast period.
IoT and Edge Data Center Expansion Driving Access Switch Deployment as the Fastest-Growing Segment
The proliferation of IoT devices, with Eurostat data confirming approximately 70% of EU citizens using at least one internet-connected device in 2024, and India's nascent IoT ecosystem supported by approximately 94 domestic IoT companies developing connected solutions across industrial and consumer segments, is compelling the buildout of distributed edge data centers that require access switch infrastructure closer to end devices and users. Each edge data center deployment requires dedicated access switching, aggregation, and core switching fabric with the access layer representing the highest unit volume and fastest CAGR segment at 5.3% through 2033.
The U.S.-China Economic and Security Review Commission has highlighted IoT's strategic importance across military and civilian domains, with government-funded edge infrastructure programs in both regions generating institutional access switch procurement. India's BharatNet rural broadband expansion and 5G edge node deployment programs are similarly driving demand for access switches at scale.
Category-wise Insights
Switch Type Analysis
The Core Switches segment leads the Data Center Switch market, commanding approximately 45% of total market share in 2025. Core switches occupy the highest-bandwidth, highest-value position in data center network architectures, serving as the central fabric interconnecting aggregation layers, storage networks, and external connectivity, with per-unit ASPs that dwarf those of access and distribution switches by an order of magnitude.
Arista Networks' 7800R3 series, Cisco's Nexus 9000 platform, and Juniper Networks' QFX10000 represent the dominant core switch platforms deployed in hyperscale and enterprise data centers, each commanding six-figure procurement values per chassis. The AI infrastructure buildout is specifically elevating demand for core switches, as GPU cluster spine networks require non-blocking 400G and 800G core fabrics capable of sustaining 100% line-rate traffic across all ports simultaneously. The Access Switches segment is the fastest-growing type at a projected CAGR of 5.3% through 2033.
Port Speed Analysis
The 100G plus port speed segment leads the Data Center Switch market by port speed, accounting for approximately 38% of total market revenue in 2025, reflecting the premium ASP of high-bandwidth switching platforms that disproportionately contribute to revenue despite lower unit volumes compared to the installed base of 10G and 25G switches. The transition to 100G as the de facto standard for hyperscale spine and leaf fabric, driven by hyperscaler capex programs from Amazon AWS, Microsoft Azure, and Google Cloud, has cemented this segment's revenue leadership.
The 100G-plus segment is simultaneously the fastest-growing port-speed category, as the industry's progression toward 400G and 800G continues to concentrate revenue in the highest-bandwidth tier. The ≤10G segment retains meaningful volume share in legacy enterprise environments and access deployments but contributes a declining share of total revenue as migration timelines accelerate.
End-user Insights
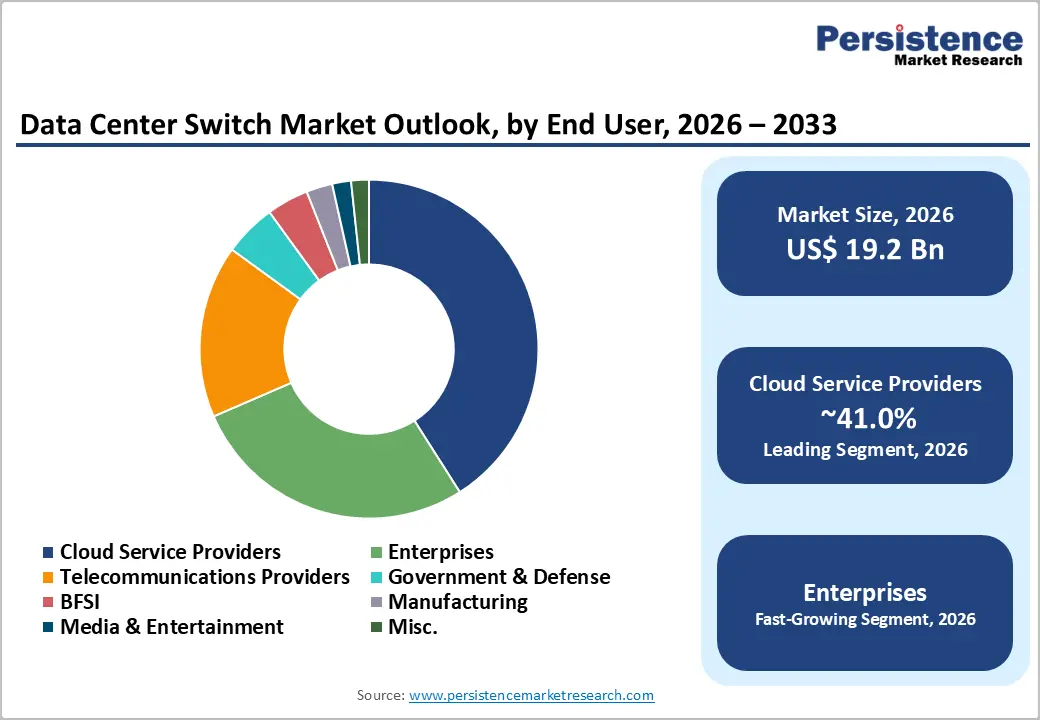
Cloud Service Providers (CSPs) constitute the dominant end-user segment for data center switches, representing approximately 42% of global market share in 2025. The structural consolidation of global internet traffic within hyperscale cloud platforms with AWS, Microsoft Azure, Google Cloud, Alibaba Cloud, and Tencent Cloud collectively processing an estimated 70% plus of global enterprise workloads, makes CSP procurement the single most influential demand driver in the market.
The BFSI sector represents the second-largest end-user vertical, with Europe's banking sector holding €43.6 trillion in total assets in 2023 and China's banking sector managing RMB 467.3 trillion in assets as of Q2 2025, both generating financial-grade data center switching demand with the highest reliability, latency, and security specifications. India's BFSI sector reaching US$ 1 trillion in market capitalization by 2025 further reinforces the vertical's global procurement scale.
Regional Insights
North America Data Center Switch Market Trends and Insights
North America holds approximately 38.5% of the global data center switch market revenue in 2025, underpinned by the concentration of the world's largest hyperscaler data center campuses Amazon, Microsoft, Google, Meta, and Apple in the United States, which collectively execute the world's largest annual data center switching procurement programs.
The region's AI infrastructure investment supercycle, with disclosed hyperscaler capex commitments exceeding US$ 200 billion collectively for 2025, is creating an unprecedented demand environment for 400G and 800G core and spine switch deployments that is reshaping the market's growth curve above the baseline trajectory.
U.S. Data Center Switch Market Size
The U.S. Data Center Switch market is valued at approximately US$ 6.2 Billion in 2025, driven by the co-location of the world's largest hyperscaler campus infrastructure Amazon's Northern Virginia cloud region, Microsoft's Phoenix and Chicago campuses, and Google's Iowa and Dallas facilities alongside the U.S. government's aggressive AI infrastructure investment program under the CHIPS and Science Act and the AI Executive Order compelling federal agency data center modernization at scale.
Europe Data Center Switch Market Trends and Insights
Europe accounts for approximately 23.5% of global Data Center Switch market revenue in 2025, shaped by the region's combination of hyperscaler European expansion with Microsoft, Google, and AWS each announcing multi-billion-euro European data center investment programs and the EU Data Act, GDPR, and NIS2 Directive compliance requirements compelling enterprise data center modernization to meet data sovereignty and cybersecurity obligations.
The EU's ICT sector employing 7.2 million people and contributing €667 billion in value added in 2022 provides the institutional foundation for enterprise data center switch demand across the region.
Germany Data Center Switch Market Size
Germany's data center switch market is valued at approximately US$ 1,176.2 Million in 2025, reflecting the country's position as Europe's largest digital economy by ICT value added contributing over 22% of EU-wide ICT value added and Frankfurt's status as Europe's primary internet exchange hub. The DE-CIX Frankfurt internet exchange the world's largest by peak traffic, exceeding 21 Tbps anchors Frankfurt as a tier-1 data center co-location market driving sustained high-bandwidth switch procurement.
U.K. Data Center Switch Market Size
The U.K. data center switch market is valued at approximately US$ 1,090.2 Million in 2025, sustained by London's position as Europe's leading financial technology and cloud services hub, the UK Government's National Data Strategy committing to data center infrastructure investment, and the country's FCA-regulated financial institutions' non-negotiable data center resilience and switching redundancy requirements that sustain premium infrastructure procurement.
Asia Pacific Data Center Switch Market Trends and Insights
Asia Pacific holds approximately 29.5% of global Data Center Switch market revenue in 2025 and is the fastest-growing region, projected to expand at the highest regional CAGR by 2033. China dominates the regional landscape as both the largest data center market by infrastructure investment and the home of hyperscale domestic cloud providers Alibaba Cloud, Tencent Cloud, Huawei Cloud, and Baidu AI Cloud, each executing multi-billion-dollar annual data center capacity expansions that drive sustained core and aggregation switch procurement at industrial scale. India is the fastest-growing country market within Asia Pacific, propelled by its 979 million internet users, 5G network deployment, and the government's India Data Center Policy attracting US$ 4.5 billion in committed data center investments.
China Data Center Switch Market Size
China's Data Center Switch market is valued at approximately US$ 2,040.2 Million in 2025, driven by the country's 14th Five-Year Plan targeting digital economy expansion and the East Data West Computing national infrastructure program relocating data processing to western provinces creating hundreds of new data center campuses requiring complete switching infrastructure. China's banking sector managing RMB 467.3 trillion in assets (Q2 2025) further reinforces BFSI-driven financial data center switch procurement.
India Data Center Switch Market Size
India's Data Center Switch market is valued at approximately US$ 1,208.0 Million in 2025, underpinned by the country's transformation into a major data center hub with committed investments exceeding US$ 4.5 billion from Amazon AWS, Microsoft, Google, and domestic players including Adani Enterprises and Hiranandani Group.
India's 1.21 billion telecom subscribers, 5G data usage surge, and BFSI sector reaching US$ 1 trillion in market capitalization collectively drive the data center switching demand that positions India as Asia Pacific's fastest-growing country market.
Competitive Landscape
The global data center switch market is highly consolidated at the premium tier, with Cisco Systems, Arista Networks, and Juniper Networks commanding dominant combined share in the enterprise and hyperscaler segments through proprietary ASIC platforms, deeply integrated SDN software ecosystems, and multi-decade OEM qualification relationships. Huawei maintains a significant position in China and emerging markets.
The competitive landscape is being disrupted by white-box switching open hardware running disaggregated NOS software from SONiC, Cumulus, or OpenConfig which hyperscalers are deploying at scale to reduce vendor lock-in and procurement costs. Key differentiators are ASIC performance per watt, SDN controller ecosystem maturity, and AI-optimized traffic engineering capabilities. The as-a-service consumption model for switching infrastructure is an emerging business model gaining traction among enterprise buyers seeking opex-based procurement.
Key Developments:
- In Feb 2025, Cisco announced the introduction of its N9300 Series Smart Switches, integrating AMD Pensando Data Processing Units (DPUs) and Cisco Silicon One E100 to redefine data center switch architecture. These next-generation switches embed networking and security services directly into the switch fabric, enabling high-performance, scalable, and adaptive infrastructure for AI-driven data center environments.
- In Oct, 2025, Arista Networks announced the launch of its next-generation R4 Series platforms, introducing 800GbE-enabled data center switching and routing solutions designed for AI and hyperscale environments. The new portfolio delivers ultra-high bandwidth capacity, low latency, and scalable architectures, supporting modern leaf-spine data center designs and large-scale AI workloads.
Global Data Center Switch Market – Key Insights &Details
| Key Insights | Details |
|---|---|
|
Historical Market Value (2020) |
US$ 14.6 Billion |
|
Current Market Value (2026) |
US$ 19.2 Billion |
|
Projected Market Value (2033) |
US$ 27.6 Billion |
|
CAGR (2026–2033) |
5.3% |
|
Leading Region |
North America, ~38.5% market share (2025) |
|
Dominant Category-1 (Switch Type) |
Core Switches, ~45% market share (2025) |
|
Top-ranking Category-2 (Port Speed) |
100G plus, ~38% market share (2025) |
|
Incremental Opportunity (2026–2033) |
~US$ 8.4 Billion |
Companies Covered in Data Center Switch Market
- Cisco Systems Inc.
- Arista Networks Inc.
- Juniper Networks (HPE)
- Huawei Technologies
- Dell Technologies
- NVIDIA Corporation
- Broadcom Inc.
- Extreme Networks Inc.
- Hewlett Packard Enterprise
- Ruijie Networks
- H3C Technologies
- ZTE Corporation
- Brocade Communications (Broadcom)
Frequently Asked Questions
The global Data Center Switch market is valued at US$ 19.2 Billion in 2026, driven by AI infrastructure expansion, hyperscaler data center buildout, and the technology refresh cycle from 100G to 400G and 800G switching platforms.
The two primary drivers are the global AI infrastructure investment supercycle with Microsoft, Google, Amazon, and Meta each committing US$ 50 billion plus annual capex to AI-optimized data centers requiring 400G and 800G switching fabric and enterprise digital transformation compelling cloud migration that drives systematic switching infrastructure modernization from 10G legacy architectures to 25G, 100G, and 400G SDN-capable platforms as documented by ITU's growth to 6 billion global internet users in 2025.
North America leads with approximately 38.5% revenue share in 2025, anchored by the U.S. market valued at US$ 6.2 Billion. This leadership reflects the concentration of Amazon AWS, Microsoft Azure, Google Cloud, Meta, and Apple's largest global data center campuses in the United States, combined with the U.S. government's CHIPS Act and AI Executive Order compelling federal data center modernization creating the world's most intense per-geography switching infrastructure procurement environment.
The transition to 800G Ethernet switching for AI GPU cluster interconnects represents the market's most margin-accretive near-term opportunity. With Arista Networks' 7060X6, Cisco's Nexus 9900 with Silicon One ASIC, and Juniper's QFX5700 all launching 800G platforms targeting hyperscaler AI buildouts and per-switch revenue 3–5x higher than 100G predecessors this technology refresh cycle creates a structurally compounding revenue opportunity for leading switch manufacturers through 2033.
The market is led by Cisco Systems , Arista Networks and Juniper Networks / HPE . Huawei holds significant market share in China and emerging markets, while NVIDIA's Spectrum-X Ethernet platform is emerging as a specialist AI cluster networking competitor to traditional Ethernet switch vendors.


