


- Energy Storage Solutions
- Smart Energy Market
Smart Energy Market Size, Share, and Growth Forecast, 2026 - 2033
Smart Energy Market by Component Type (Hardware, Software, Services), Solution Type (Smart Metering (AMI), Smart Grid & Distribution Automation, Energy Management Systems (EMS), Renewable & DER Management, Energy Storage Systems, EV Charging Infrastructure, Demand Response & Flexibility), Deployment Mode (On-Premise, Cloud, Hybrid), End User (Utilities, Residential, Commercial, Industrial), and Regional Analysis for 2026 - 2033
Smart Energy Market Size and Trends Analysis
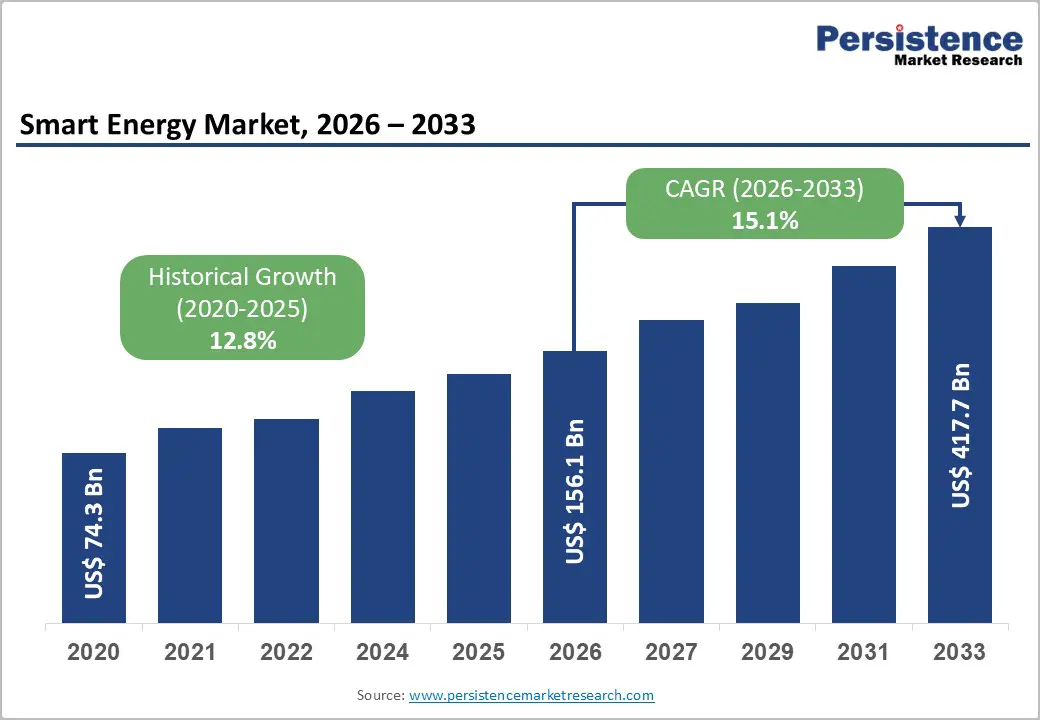
The global smart energy market size is likely to be valued at US$ 156.1 billion and is projected to reach US$ 417.7 billion by the forecast period, growing at a CAGR of 15.8%. This robust expansion is driven by accelerating electricity demand growth, which surged 4.3% globally according to the International Energy Agency, alongside unprecedented grid modernisation investments exceeding US$ 470 billion annually.
The convergence of renewable energy integration requirements, rising data centre electricity consumption projected to reach 130 gigawatts, and massive infrastructure digitalisation programs totalling 584 billion euros across Europe are fundamentally reshaping energy distribution networks.
Government mandates for smart meter deployments, with over 1.06 billion units already installed worldwide, combined with aggressive electrification of transport and heating systems, are creating structural tailwinds that position smart energy solutions as essential infrastructure rather than discretionary technology upgrades.
Key Industry Highlights:
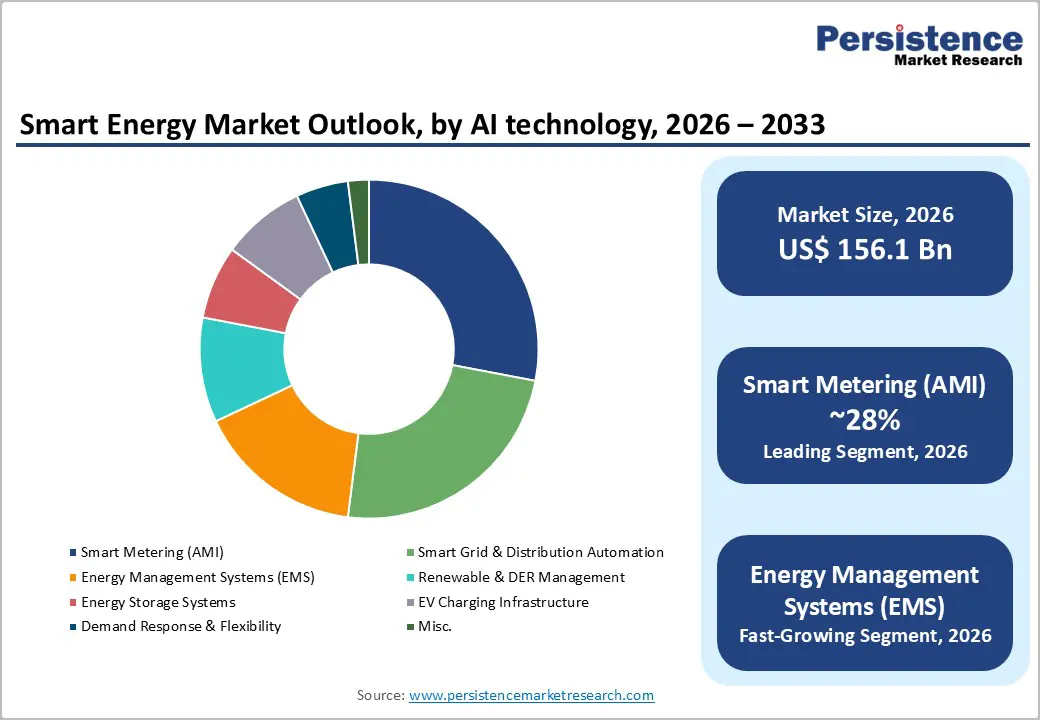
- Smart Metering Dominance: Advanced Metering Infrastructure (AMI) continues to lead the Smart Energy Market with 28% share in 2025, driven by mandatory nationwide deployments and replacement cycles, particularly in the Asia Pacific.
- Energy Management Systems: EMS solutions are the fastest-growing segment, fueled by increasing enterprise sustainability mandates, regulatory compliance, and integration with EV charging, solar, and battery systems.
- Leading Component Hardware dominates the component landscape with 48% share, covering smart meters, sensors, control devices, and EV chargers, while services are emerging as the fastest-growing component category.
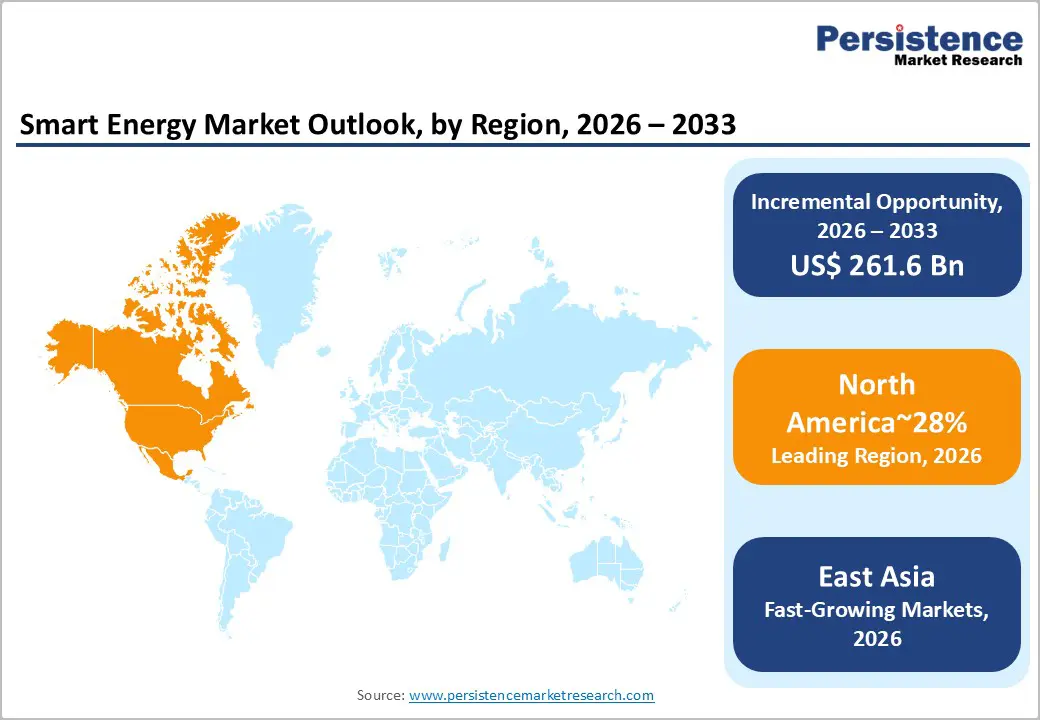
- North America Leadership: North America holds 28% market share, supported by major grid modernisation programs, dynamic line rating adoption, and the fastest EV charging infrastructure expansion in the U.S.
- East Asia & China Market Scenario: East Asia captures 22% share, with China, Japan, and South Korea investing heavily in smart grids, renewable integration, energy storage, and microgrids, driving regional leadership.
- Europe’s Regulatory Push: Europe accounts for 24% share, underpinned by coordinated policies, the EU Digitalisation of the Energy System plan (584 billion euros), and over 400 smart grid innovation projects fostering cross-border grid interoperabilit
- EV Charging and DER Integration as Key Opportunities: Rapid EV adoption and distributed energy resource (DER) integration present multi-decade growth potential, with smart energy solutions optimising charging, demand response, and grid flexibility globally.
| Key Insights | Details |
|---|---|
|
Smart Energy Market Size (2026E) |
US$ 156.1 Bn |
|
Market Value Forecast (2033F) |
US$ 417.7 Bn |
|
Projected Growth (CAGR 2026 to 2033) |
15.1% |
|
Historical Market Growth (CAGR 2020 to 2025) |
12.8% |
Market Dynamics
Drivers - Unprecedented Electricity Demand Growth Across Global Markets
The world is experiencing an increase in electricity consumption in recent decades, fundamentally replacing power system requirements and accelerating Smart Energy Market infrastructure investments. According to the International Energy Agency, global electricity consumption increased 4.3% and is expected to maintain close to 4% annual growth, adding an extraordinary 3,500 terawatt hours of incremental demand over three years, equivalent to adding Japan's entire annual electricity consumption every single year. This acceleration stems from expanding industrial output, widespread air conditioning adoption, transport and heating electrification, and particularly the rapid buildout of energy-intensive data centres, with data centres alone using 4.4% of the United States power and potentially rising to 12% around 130 gigawatts.
Emerging and developing economies account for approximately 85% of new demand, with China contributing over half of the global increase at six to seven% annually, while India and Southeast Asian nations experience strong gains from economic expansion and rising appliance ownership, particularly cooling equipment. This electricity demand pressure creates compelling business cases for smart grid technologies that optimise existing infrastructure capacity, enable dynamic load management, and defer costly traditional grid expansion projects, directly driving Smart Energy Market growth across generation, transmission, distribution, and consumption management segments.
Massive Government Infrastructure Modernisation Programs
Governments worldwide have launched unprecedented grid modernisation and digitalisation investment programs that serve as primary catalysts for the Smart Energy Market expansion. The European Commission's Digitalisation of the Energy System action plan estimates 584 billion euros in electricity grid investments through the target period, including 170 billion euros specifically allocated for digitalisation, covering smart meters, automated grid control, advanced monitoring, and field-level digital tools to enhance network flexibility and efficiency.
China demonstrates even more aggressive scale, planning approximately 442 billion dollars between the initial and target periods to modernise and expand transmission and distribution grids supporting renewables and rising demand, with State Grid committing an additional 574 billion dollars for upgrades, representing a forty% increase in fixed asset investments compared to the prior five-year period.
The United States Department of Energy introduced the Grid Resilience and Innovation Partnerships Program with 10.5 billion dollars to harden and upgrade grids against outages and climate risks, while Japan announced a 155 billion dollar smart grid funding program to strengthen reliability and integrate clean energy, and India launched a reform scheme worth approximately 38 billion dollars to modernise distribution company infrastructure and reduce losses. These coordinated, multi-hundred-billion-dollar government commitments create predictable, long-term demand pipelines for Smart Energy Market participants across hardware, software, and services segments, with distribution side investments taking approximately 75% of spending focused on smart meters, substation automation, and sensor deployments that provide real-time operational visibility previously unavailable to network operators.
Restraint - High Initial Capital Investment Requirements
The deployment of comprehensive smart energy infrastructure demands substantial upfront capital expenditures that create adoption barriers, particularly for smaller utilities and developing market operators with constrained budgets. Smart metering systems require hardware procurement, communication network establishment, backend IT infrastructure, and installation labour costs that accumulate significantly across large service territories, while advanced grid automation demands expensive sensors, intelligent electronic devices, substation upgrades, and control system integration.
Rising equipment costs, compounded by persistent high inflation, are affecting overall spending effectiveness, meaning increased financial outlays do not fully eliminate ongoing grid infrastructure bottlenecks, with supply chain constraints and specialised labour shortages causing project delays that prevent utilities from meeting business plan goals. Many distribution companies face regulatory frameworks where operating expenses pass through to consumer bills without additional profit margins, creating disincentives for investing in grid-enhancing technologies that unlock capacity, with regulatory reform to address this misalignment remaining slow across markets.
The capital intensity combined with uncertain return timelines and regulatory recovery risks causes utilities to prioritize traditional infrastructure investments over innovative smart solutions, slowing smart energy market penetration despite clear long term efficiency benefits.
Opportunities - Integration of Electric Vehicle Charging Infrastructure
The explosive growth of electric vehicle adoption is creating substantial opportunities for smart energy solutions that manage charging loads, optimize grid utilization, and enable vehicle to grid services. Global public charging infrastructure expanded more than seventy five% year on year, with the United States adding over 18,000 new direct current fast charging ports, representing approximately thirty% growth, marking the largest expansion in national history, and projections indicating over 100,000 total fast charging ports available with double the previous count within the near term.
The electric vehicle charging infrastructure market is growing rapidly, driven by continued global carbon emission reduction initiatives. India currently has approximately 200 electric vehicles per public charging point, highlighting the urgent need for rapid infrastructure expansion to support growing adoption. Smart energy systems enable utilities to manage charging loads strategically, scheduling vehicle charging during off-peak periods, coordinating with renewable generation availability, and utilising dynamic pricing to incentivize grid friendly charging behaviours that avoid local network congestion and transformer overloading.
ABB launched ReliaHome Smart Panel energy management solution, enabling residential optimisation, real-time circuit control, and integration with distributed energy resources, including batteries, solar inverters, electric vehicle chargers, and generators. Through user-friendly applications, developed collaboratively to accelerate smart home electrification and energy efficiency. The convergence of transportation electrification and power systems creates a multi-decade growth trajectory for the Smart Energy Market, as charging infrastructure becomes a fundamental grid planning consideration requiring sophisticated management platforms, communications networks, and consumer engagement tools that smart energy providers are uniquely positioned to deliver.
Advanced Grid Enhancing Technologies Deployment
The urgent need to increase transmission capacity without year-long construction timelines is driving the adoption of digital grid-enhancing technologies that optimise existing infrastructure performance.
According to the United States Department of Energy, modernizing aging transmission systems has become critical as electricity demand surges from data centers, artificial intelligence, manufacturing, and electrification, with data centers alone potentially using twelve% around 130 gigawatts, yet instead of waiting years for costly new transmission lines, the Department is advancing grid enhancing technologies like Dynamic Line Rating which uses real time weather and operational data to safely increase existing line capacity and reduce congestion.
Real-world deployments show tangible benefits, with Pennsylvania Power Light Electric avoiding US$ 12 million in upgrades and cutting US$ 64 million in congestion costs, Oncor Electric Company increasing capacity by six to 14%, and Duquesne Light Company achieving twenty-five per cent gains in pilots. Policy momentum is reinforced by the Federal Energy Regulatory Commission Order requiring utilities to consider such technologies, with continued funding aiming to scale these cost-effective digital tools nationwide, unlocking more power flow, accelerating renewable and new interconnections, and delivering more reliable, affordable, and future-ready grids without massive new infrastructure buildouts.
Category-wise Analysis
Solution Type Insights
Smart metering is likely to account for approximately 28% share in 2026 maintaining its position as the largest solution category driven by global deployment mandates and replacement cycles. By year-end, utility service providers worldwide installed over US$ 1.06 billion smart meters for electricity, gas, and water, with the installed base expected to exceed US$ 1.75 billion, growing at 6%, making smart meters a critically important market segment. Smart electricity meter adoption far exceeds smart gas and water meters currently, though expectations indicate smart gas and water meter adoption will grow at ten% and sixteen% compound annual growth rates, respectively, suggesting evolving dynamics.
The Asia Pacific region accounts for almost 60% of the global smart meter installed base and more than 50% of annual shipments, achieving 49% penetration rate, largely driven by successful nationwide rollouts in China and Japan.
Energy management systems represent the fastest expanding solution category, propelled by increasing enterprise focus on operational cost reduction, sustainability commitments, and regulatory compliance requirements. ABB launched Smart Energy Management Systems, intelligent home energy management solutions that automate and optimise residential electricity consumption through real-time load balancing, solar and electric vehicle charging coordination, and cost-efficient energy scheduling, with seamless integration and compatibility with over 300 third-party devices to enable flexible future-ready smart home energy control.
Component Insights
Hardware components commanded approximately 48% market share, reflecting the fundamental requirement for physical infrastructure, including smart meters, sensors, communication devices, control equipment, and energy storage systems. Hardware retains relevance for grid sensing and protection roles, with transmission and distribution companies deploying intelligent electronic devices, automated switches, voltage regulators, and transformer monitors that provide operational visibility and remote-control capabilities previously unavailable.
The hardware segment benefits from ongoing first-generation equipment replacement cycles, expanding sensor deployments across distribution networks, grid-scale battery installations that surged more than 75% year on year, reaching approximately 28 gigawatts globally, and electric vehicle charging equipment proliferation.
Services represent the fastest expanding component category, driven by the increasing complexity of smart energy systems, the need for specialised expertise, and the shift toward performance-based business models. Profit pools are steadily migrating to software as a service licenses and performance-based operations and maintenance agreements, with integrated solutions anticipated to compound briskly as stakeholders outsource complexity to domain specialists.
Regional Insights and Trends
North America Smart Energy Market Trends
North America holds approximately 28% of the global smart energy market, representing the highest regional share driven by substantial grid modernisation investments, supportive regulatory frameworks, and aggressive renewable integration targets. The United States demonstrates the highest grid investment levels globally, with 115 billion dollars representing a quarter of the worldwide total, with spending set to rise sixteen% following fifteen% growth the prior year, showcasing how increased expenditure is becoming an established feature of the energy transition.
The United States Department of Energy Grid Resilience and Innovation Partnerships Program allocated 10.5 billion dollars to harden and upgrade grids against outages and climate risks, while advancing grid-enhancing technologies that boost existing line transfer capability 10 to 40 % through dynamic rating systems, with real world utility deployments avoiding twelve million dollars in upgrade costs while cutting US$ 64 million in congestion expenses.
The electric vehicle charging infrastructure expansion accelerated dramatically, with over 326,000 publicly accessible ports installed and 18,000 new direct current fast charging ports added, representing 30% year on year growth, marking the largest expansion in national history, with projections indicating over 19,500 additional fast charging ports in the near term, pushing national totals toward 90,000 ports.
California, Texas, and Florida led new fast charging port additions, with operators increasingly building larger multi-port stations delivering 250 kilowatt plus high power charging, supporting faster vehicle charging and reduced congestion, while private investment contributed 97% of additions, demonstrating strong commercial momentum beyond government-funded programs.
East Asia Market Trend
East Asia commands approximately 22% of the Global Smart Energy Market, with China, Japan, and South Korea driving regional leadership through aggressive government investment programs and ambitious renewable integration targets.
China demonstrates exceptional scale, planning approximately 442 billion dollars to modernise and expand transmission and distribution grids, with State Grid committing an additional 574 billion dollars, representing a forty% increase in fixed asset investments to enhance the power grid, including thirty% growth in cross-provincial power transmission capacity compared to prior period levels.
According to the National Development and Reform Commission approval, the plan for new energy industry development represents commitments exceeding 360 billion dollars between the initial and target periods, with the government aiming to increase non fossil fuel energy share to 35% necessitating continued development of smart grid technologies and energy efficiency programs, with massive investment of US$ 84.7 billion in grid transmission expansion and modernization projects representing fifteen% year on year growth key for grid stability.
South Korea pursues the Smart Grid Roadmap targeting nationwide smart grid completion with five implementation focus areas projected to reduce approximately 230 million tonnes of greenhouse gas emissions, achieving national smart meter installation targets of 22 million units, while deploying over 1,250 microgrids and energy storage systems with total storage capacity of 4.3 gigawatt hours following successful test projects.
Japan announced a 155-billion-dollar smart grid funding program to strengthen reliability and integrate clean energy, with all three East Asian economies prioritising grid digitalisation as essential infrastructure for economic growth, energy security, and climate commitments.
Europe Smart Energy Market Trends
Europe represents approximately 24% share in 2026, distinguished by comprehensive regulatory frameworks, aggressive climate targets, and coordinated regional cooperation on energy infrastructure modernisation.
The European Commission's Digitalisation of the Energy System action plan estimates 584 billion euros in electricity grid investments, including 170 billion euros specifically for digitalisation covering smart meters, automated grid control, advanced monitoring, and digital tools to enhance network flexibility and efficiency. Annual grid spending is projected to exceed seventy billion dollars, representing double the amount from a decade prior, yet grid investments still lag behind renewable deployment, with global comparisons showing 400 billion dollars invested in grids yearly versus approximately one trillion dollars in electricity generation, indicating that grid spending needs to accelerate substantially to ensure electricity supply meets rising demand.
Smart grid research and innovation increased significantly with 407 projects supported, including research and development projects and demonstration projects, with a total investment of US$ 3.08 billion and European Union contribution of 2.32 billion dollars, serving as a significant driver, involving 5,986 participants at 3,130 organisations at 1,243 implementation sites in 45 countries.
According to European Commission strategy, smart grids paired with smart meters automatically track supply and demand, give households and utilities live visibility into energy use, and adjust flows to balance renewables with rising loads from electric vehicles and heat pumps, with programs promoting cross border smart grid projects labeled as Projects of Common Interest while research is backed through coordinated efforts, and regulations ensure interoperability, consumer access to data, cybersecurity, and privacy protection.
Competitive Landscape
The global smart energy market shows a moderately consolidated oligopolistic structure, where a handful of large multinational technology and power-automation companies command a significant share of utility-scale deployments, while smaller regional firms compete in niche digital and software segments. Industry leaders such as Siemens, Schneider Electric, Landis+Gyr, Honeywell International Inc., Itron, Inc., and ABB Ltd. dominate through comprehensive portfolios spanning smart meters, grid automation, energy analytics, and IoT-enabled platforms. These companies benefit from strong utility partnerships, global supply chains, and recurring service revenues, creating high entry barriers for new entrants.
At the same time, startups and regional vendors add competitive pressure through specialised solutions in DER integration, cloud-based monitoring, and energy management software. The market’s growth is driven by smart grid modernisation programs, decarbonization targets, and digital transformation investments worldwide. Strategic collaborations, acquisitions, and long-term contracts further strengthen incumbent positions.
Key Industry Developments
- In August 2025, Honeywell International Inc. expanded its smart energy portfolio by acquiring grid intelligence data platforms and software technologies from SparkMeter Inc., integrating Praxis, GridScan, and GridFin into its Honeywell Forge Performance plus for Utilities suite to enhance utility analytics, grid visibility, and financial optimisation, strengthening scalable, data-driven solutions for modernising and digitalising power distribution networks.
- In December 2025, Siemens Partnered with IBC Energie Wasser Chur to deploy its Electrification X IoT suite, smart Sentron fuses, and Sicam grid sensors across 200 transformer stations and 290 distribution cabinets in Chur, enabling 24/7 low-voltage grid transparency, faster fault detection, up to 30% higher usable grid capacity, and improved reliability through real-time monitoring and automated alerts.
- In April, 2025, Landis+Gyr Signed a new three-year agreement with Centrica Smart Meter Assets to supply smart electricity and gas meters across the United Kingdom, extending a decade-long partnership and supporting large-scale grid digitalisation, with over 21 million meters already deployed by Landis+Gyr to enhance real-time energy management, efficiency, and the nation’s net-zero transition.
Companies Covered in Smart Energy Market
- ABB
- General Electric Company
- Holley Technology Ltd.
- Honeywell International Inc.
- Iskraemeco Group
- Itron Inc.
- Landis+Gyr.
- Schneider Electric
- Sensus
- Siemens
Frequently Asked Questions
The global Smart Energy Market is projected to be valued at US$ 156.1 Bn in 2026.
The Smart Metering (AMI) segment is expected to account for approximately 28% of the Global Smart Energy Market by Design type in 2026.
The market is expected to witness a CAGR of 15.1% from 2026 to 2033.
The Smart Energy Market growth is driven by rising global electricity demand, rapid electrification of transport and heating, expansion of data centers, and massive government-led grid modernization and digitalization programs worldwide.
Key market opportunities in the Smart Energy Market lie in expanding electric vehicle charging infrastructure and deploying advanced grid-enhancing technologies that optimize existing transmission capacity, improve reliability, and enable efficient integration of renewables.
Key players in the Smart Energy Market include Siemens, Schneider Electric, Landis+Gyr, Honeywell International Inc., Itron, Inc., and ABB Ltd.


