


- Non-food Packaging
- Plastic Card Market
Plastic Card Market Trends, Size, Share, Growth, Forecasts, 2025 - 2032
Plastic Card Market By Card Type (Payment Cards, Access Control Cards, Others), End-use (Banking, Financial Services, Insurance (BFSI), Retail, Government & Public Sector, Others), and Regional Analysis for 2025 - 2032
Plastic Card Market Share and Trends Analysis
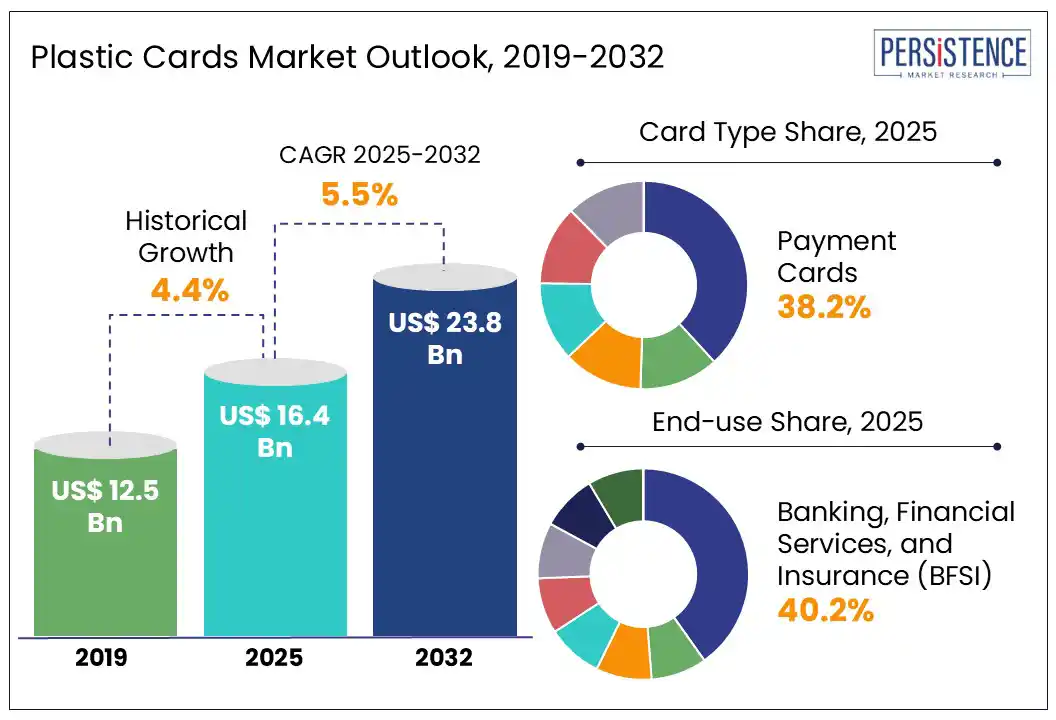
The global plastic card market size is likely to be valued at US$ 16.4 Bn in 2025 and is estimated to reach US$ 23.8 Bn in 2032, growing at a CAGR of 5.5% during the forecast period 2025 - 2032. Growing need for secure, contactless, and digitized transactions across banking, telecom, retail, and identity systems encourages the need for plastic cards. Over three billion plastic payment cards are shipped annually, and the broader smart card ecosystem covering payment, telecom, access control, identification, and loyalty cards crossed 10 billion units in 2022. This growing volume reflects rising adoption across major economies, including the U.S., China, India, and Germany, where smart infrastructure and digital access continue to scale rapidly.
Asia Pacific is projected to lead growth, led by government ID programs in India and China, mobile connectivity in Japan, and a strong banking penetration. North America, particularly the U.S., is seeing high adoption of contactless payment cards and eco-friendly materials, while Europe is pushing regulatory shifts that accelerate the move toward PVC-free, sustainable card formats. Despite rising digital payments, plastic cards retain strong relevance, especially in hybrid ecosystems. In Latin America, credit and debit cards still account for over 40% of e-commerce transactions. Plastic cards play a vital role in the digital economy, offering convenience, authentication, and access in an increasingly connected world.
Key Industry Highlights:
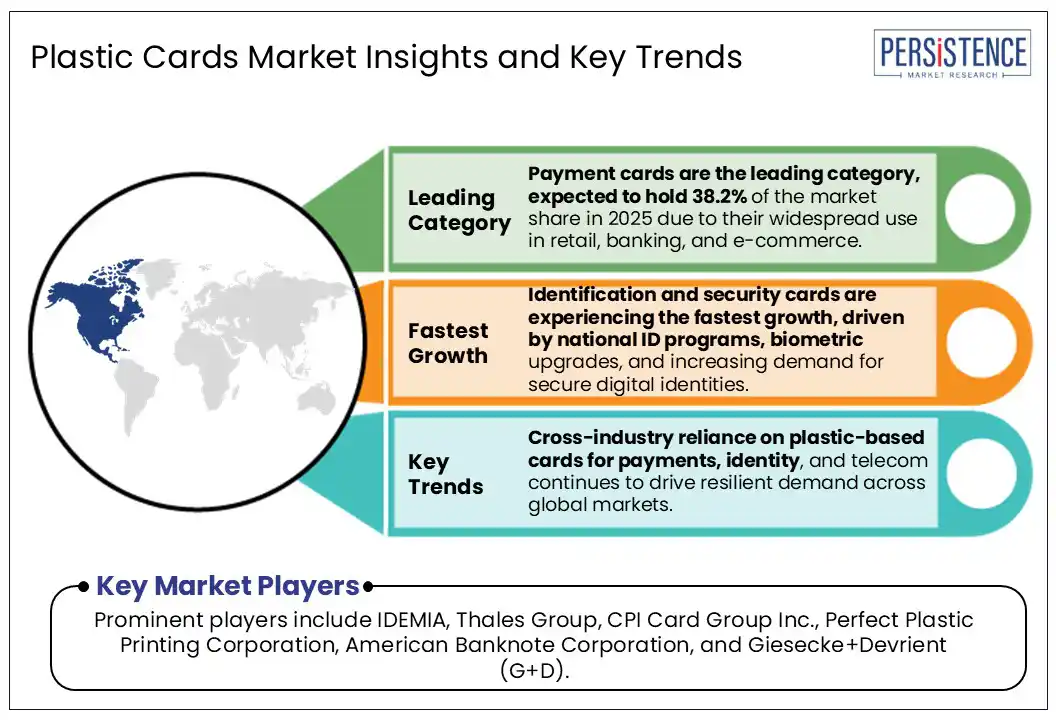
- Payment cards are set to account for 38.2% of the plastic card market in 2025, supported by growing demand for secure, seamless, and contactless transactions.
- The BFSI sector is projected to remain the dominant end-use segment in 2025 with a 40.2% share, driven by increasing digital banking and card-based financial activity.
- Asia Pacific leads global growth, propelled by national ID rollouts in India and China, and expanding digital infrastructure across Japan and Southeast Asia.
- North America continues to see high card circulation, with over US$9.3 Tn in plastic card purchases recorded in 2024 across Visa and Mastercard.
- Over 350 million cards now use eco-conscious materials, as major players such as IDEMIA, Thales, and G+D push sustainable design under regulatory pressure.
- Environmental concerns are triggering a shift away from traditional cards in certain segments, with initiatives replacing plastic gift cards with paper-based alternatives.
- The market is moderately consolidated, with competition centered on material innovation, personalization, and embedded security technologies.
|
Global Market Attribute |
Details |
|
Estimated Market Size (2025E) |
US$ 16.4 Bn |
|
Projected Market Value (2032F) |
US$ 32.8 Bn |
|
Value CAGR (2025 to 2032) |
5.5% |
|
Historical Market Growth (CAGR 2019 to 2024) |
4.4% |
Market Dynamics
Driver - Surge in Cross-Industry Demand is Driving a Resilient Plastic Card Ecosystem
The global demand for physical card solutions continues to grow across banking, telecom, and government sectors, establishing a strong foundation for market expansion. Whether it is for payments, identity, or connectivity, plastic-based cards remain indispensable in everyday transactions.
The introduction of ID2Issuance by IDEMIA for motor vehicle agencies across North America is not just a digital platform; it also highlights the ongoing reliance of governments on secure, plastic-based identity credentials to meet regulatory and biometric standards. This institutional reliance adds long-term stability to demand.
Financial and telecom players reinforce this need by embedding cards deeper into their service models. Bharti Airtel’s shift to recycled PVC SIM cards exemplifies how telecom operators are not moving away from physical cards but rather improving them to align with sustainability goals. When leading banks such as Deutsche Bank commit to making 99% of their newly issued cards from recycled plastic, it underlines the strength and necessity of the format itself. These cross-industry efforts show that plastic cards continue to be a high-utility product, embedded in essential systems, and resilient even as industries evolve.
Restraint - Environmental Pushback and Regulatory Pressures to Hinder Market Expansion
Despite the widespread adoption, the plastic card market is now confronting mounting resistance from environmental mandates and waste management issues.
The global momentum toward minimizing plastic pollution has forced many companies and governments to rethink plastic use even in essential applications such as cards. In markets including South Africa, where 90% of total waste still ends up in landfills, plastic-based products, including cards, are under intense scrutiny due to their contribution to non-biodegradable waste streams.
This pushback is affecting segments such as gift and loyalty cards the most. Ricoh’s initiative to replace plastic gift cards with paper-based alternatives in the U.K. is not just about innovation; it is a response to growing concerns over how gift cards pile up in landfills.
Many card components such as chips and antennas remain non-recyclable despite advances in recycling, limiting full-scale adoption of eco-friendly designs. These limitations are hindering the growth of traditional plastic cards.
Opportunity - Sustainability-Linked Innovation is Creating New Revenue Pathways
The transition toward environmentally responsible products is not just about meeting regulations. Manufacturers that offer low-impact materials such as recycled PVC, ocean plastic, or bio-based alternatives are now seeing wider adoption across banks and service providers. IDEMIA’s partnerships under the GREENPAY initiative, including projects with Bancolombia and Nationwide Building Society, show how companies are using sustainable plastic materials to meet both internal ESG targets and changing customer expectations.
CPI Card Group, for instance, has already distributed over 90 million environmentally focused cards. Their work on upcycled plastic and ocean-bound materials shows how design improvements can align with environmental objectives while preserving the security and durability that institutions require. By aligning product design with larger environmental goals, the industry is creating space for both compliance and commercial expansion.
Trend - Consumer-Centric Innovation is Shaping the Future of Card Design and Usage
Modern users want more than just a functional card; they want security, convenience, and sustainability, all embedded into one smart format. This demand is shaping a powerful trend around design innovation.
IDEMIA’s global survey revealed an increasing preference for numberless cards, hybrid formats, and sleek designs that combine physical utility with digital flexibility. Manufacturers are also stripping away non-essential features such as magnetic stripes to improve recyclability without compromising functionality, as seen in Thales’ recent design upgrades.
At the same time, security-enhancing features are becoming must-haves, not bonuses. Perfect Plastic Printing has added Ellipse’s dynamic CVV technology to regular plastic cards, making them safer for online shopping and helping protect against fraud.
Consumers now expect their cards to be fraud-resistant, future-proof, and aligned with their values. This has elevated the card from a simple plastic product to a digitally empowered identity and payment device. As innovation continues to center around user needs, the plastic card’s role in the digital ecosystem will keep evolving, making user-driven design one of the most powerful long-term market trends.
Category-wise Analysis
Card Type Insights
Payment cards are expected to hold a market share of around 38.2% in 2025, driven by high-frequency usage across retail, banking, and e-commerce transactions globally. Consumers in the U.S., Europe, and parts of Asia continue to rely heavily on credit, debit, and prepaid card systems, with global transaction volumes exceeding trillions of dollars annually.
The demand for seamless, contactless payments has pushed issuers to upgrade card technology, integrate smarter chip systems, and cater to consumer expectations for convenience, security, and speed. Payment cards remain central to financial infrastructure in both developed and developing markets.
Sustainability is emerging as a key driver shaping the next wave of growth in this category. Companies such as CPI Card Group and Thales are transforming traditional card manufacturing with eco-responsible solutions. Thales alone shipped over 25 million recycled or bio-sourced cards in one year. Giesecke+Devrient is eliminating virgin plastic from all card products by 2030, setting new ESG benchmarks across the sector.
Strategic partnerships, such as that between Perfect Plastic Printing and exceet Card Group, are expanding RFID-enabled, biodegradable offerings across North America and Europe. These innovations are reshaping the future of the plastic card as a secure, sustainable, and versatile payment tool.
End-use Insights
The Banking, Financial Services, and Insurance (BFSI) sector is anticipated to dominate, accounting for around 40.2% market share in 2025, driven by rising global demand for secure, convenient, and sustainable payment solutions.
Rapid digitalization in retail banking, surge in credit card adoption, and the growing preference for contactless transactions continue to accelerate card issuance across North America, Europe, and Asia. In the U.S. alone, credit card circulation surpassed 1.25 billion by 2023, reflecting the deep reliance of consumers on payment cards for everyday financial activity. This demand is fueling the adoption of advanced technologies, including biometric and dual-interface smart cards.
The BFSI sector is also driving a major shift toward eco-conscious innovation. Banks across Singapore, Malta, and the U.S. are replacing traditional PVC cards with eco-friendly alternatives. Trust Bank launched Ocean Plastic® cards, while APS Bank introduced PLA-based cards that cut PVC use by over 80%. IDEMIA’s smartphone-based fingerprint enrollment system is redefining user security for biometric cards without compromising ease of use.
These initiatives highlight how financial institutions are not only advancing plastic card functionality but also pushing for greener manufacturing, making plastic cards essential to both financial inclusion and sustainability goals.
Regional Insights
North America Plastic Card Market Trends
North America is anticipated to hold a market share of around 32% in 2025, driven by deep-rooted consumer dependence on plastic-based payment systems and growing integration of smart, digital-first card technologies.
In the U.S., over 60% of monthly consumer payments in 2023 were made using credit and debit cards, far outpacing cash at 16%. This shift reflects rising demand for convenience, faster checkout, and embedded rewards, particularly among younger consumers, who used cash for just 12% of their transactions. These preferences are accelerating the use of payment cards, retail & loyalty cards, and smart cards with contactless and digital capabilities.
With US$ 9.37 Tn in plastic card purchases recorded in 2024 across Visa and Mastercard products, the U.S. continues to lead in volume and infrastructure. The country had over 631 million active credit card accounts and over 1.25 billion cards in circulation, underlining the scale of usage.
Alongside payment functions, plastic cards in North America now support identification, security, access control, and telecom applications, creating a multi-utility platform. As banks, retailers, and service providers invest in contactless tech and embedded chip functionality, the region is building new momentum for durable, eco-friendly, and digitally intelligent card formats.
Europe Plastic Card Market Trends
Europe is projected to capture a market share of around 18%, driven by strong adoption of card-based digital payments and expanding contactless infrastructure across key markets such as Germany, France, Italy, and Spain. In the first half of 2024, card payments accounted for 56% of all non-cash transactions in the Euro area, supported by the widespread rollout of NFC-enabled cards and growing retail acceptance.
The rising consumer demand for frictionless, secure payments continues to reinforce the dominance of plastic payment cards in both online and offline commerce. The region is also seeing growing traction in retail & loyalty cards, powered by personalized rewards, digital receipts, and integrated loyalty programs. With nearly 79% of all in-person card payments being contactless, Europe is leading the shift toward faster, touch-free checkout experiences.
Emerging regulations around plastic sustainability are pushing manufacturers to innovate with eco-friendly materials, opening new opportunities in the production of smart cards and secure ID solutions. The rising number of card issuances, growing POS penetration, and the public’s increasing trust in digital financial tools continue to expand the plastic card ecosystem across the region.
Competitive Landscape
The global plastic card market is moderately consolidated, with a few major players dominating core segments, including payment, identity, and telecom cards. Companies such as IDEMIA, Thales Group, and Giesecke+Devrient (G+D) hold strong global positions through their large-scale partnerships, innovation in eco-friendly materials, and leadership in security technologies.
CPI Card Group Inc., Perfect Plastic Printing Corporation, and American Banknote Corporation are also active in niche and regional markets, offering customized and sustainable card solutions. Intense competition centers around personalization, material innovation, and security integration, making technological advancement a key differentiator among top players.
Key Industry Developments
- In May 2025, CPI Card Group acquired Arroweye Solutions for US$ 45.5 Mn to enhance its portfolio of on-demand plastic payment card solutions in the U.S. market. The acquisition strengthened CPI’s capabilities in hyper-personalization, just-in-time card production, and rapid delivery, aligning with increasing demand for flexible and efficient card issuance models.
- In June 2024, DBS Taiwan, in collaboration with Thales, reissued over two million payment cards, following its merger with Citibank. Over one million of these cards are sustainable and made from bio-based Polylactic Acid (PLA), making DBS Taiwan the largest issuer of PLA cards in Asia. This shift strengthened the bank’s sustainability strategy and reinforced Thales’ leadership in eco-friendly card solutions.
Companies Covered in Plastic Card Market
- IDEMIA
- Giesecke+Devrient (G+D)
- Thales Group
- CPI Card Group Inc.
- Perfect Plastic Printing Corporation
- KL-Hi-Tech
- Card Tec (India) Pvt. Ltd.
- American Banknote Corporation
- TAG Systems SA
- Teraco Inc.
- Toppan Printing Co., Ltd.
- Marketing Card Technology, LLC
Frequently Asked Questions
The global market is projected to be valued at US$16.4 Bn in 2025.
The market is poised to witness a CAGR of 5.5% from 2025 to 2032.
Rising cross-industry demand across banking, telecom, and government sectors continues to fuel plastic card adoption for secure payments, identity, and connectivity.
Sustainability-focused innovation in recycled and bio-based card materials is opening new growth avenues for manufacturers aligned with ESG goals.
Prominent players include IDEMIA, Thales Group, CPI Card Group Inc., Perfect Plastic Printing Corporation, American Banknote Corporation, and Giesecke+Devrient (G+D).


