


- Semiconductor Materials & Components
- Optical Communication and Networking Equipment Market
Optical Communication and Networking Equipment Market Size, Share, and Growth Forecast, 2026 - 2033
Optical Communication and Networking Equipment market by Component Type (Optical Transceivers, DWDM & Multiplexing Equipment, Optical Fiber, Passive Optical Components, Optical Amplifiers, Optical Switches, Optical Test & Measurement Equipment, Optical Sensors, Misc.), Technology (Wavelength Division Multiplexing (WDM), Coherent Optical Transmission, Intensity Modulation / Direct Detection (IM/DD), Passive Optical Network (PON), Fiber Channel, SONET / SDH), Data Rate (Up to 40 Gbps, 40–100 Gbps, 100–400 Gbps, 400–800 Gbps, Above 800 Gbps) Industry and Regional Analysis for 2026 - 2033
Optical Communication and Networking Equipment Market Size and Trends Analysis
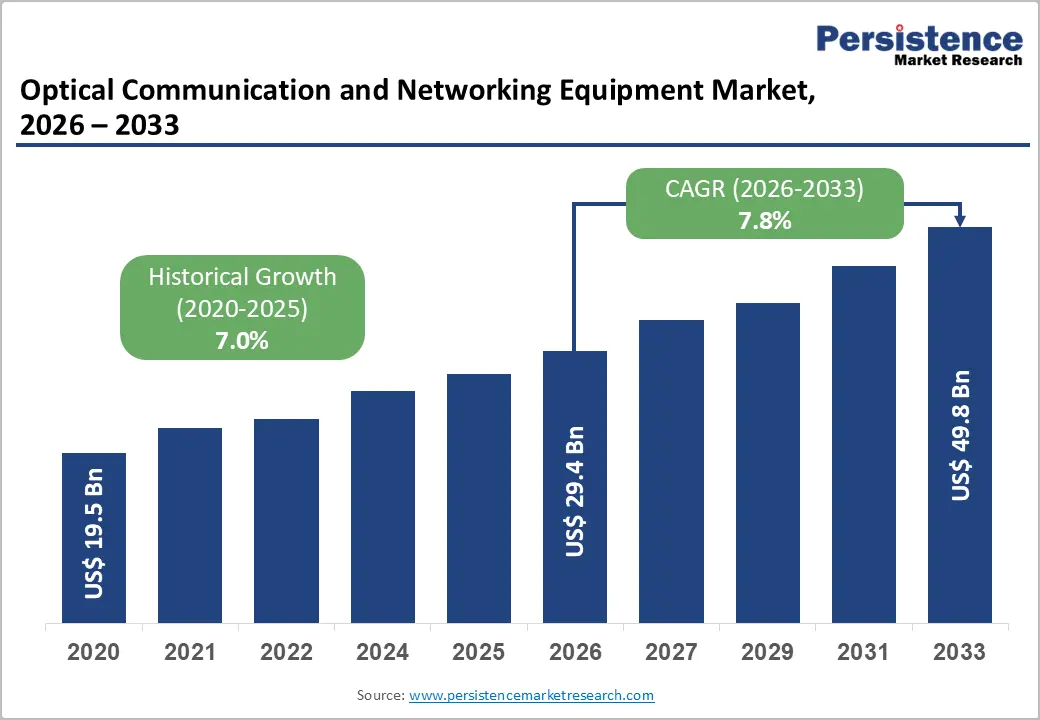
The global optical communication and networking equipment market size is likely to be valued at US$29.4 billion in 2026 and is projected to reach US$49.8 billion by 2033, growing at a CAGR of 7.8% between 2026 and 2033.
This expansion reflects the fundamental role optical infrastructure plays in enabling digital transformation across telecommunications, enterprise networks, and hyperscale data centres. The market's sustained growth is anchored by the convergence of multiple macroeconomic and technological forces reshaping global connectivity demands, including exponential growth in data traffic, 5G infrastructure deployment, and the emergence of artificial intelligence-driven workloads requiring massive bandwidth and low-latency optical interconnects.
Key Industry Highlights:
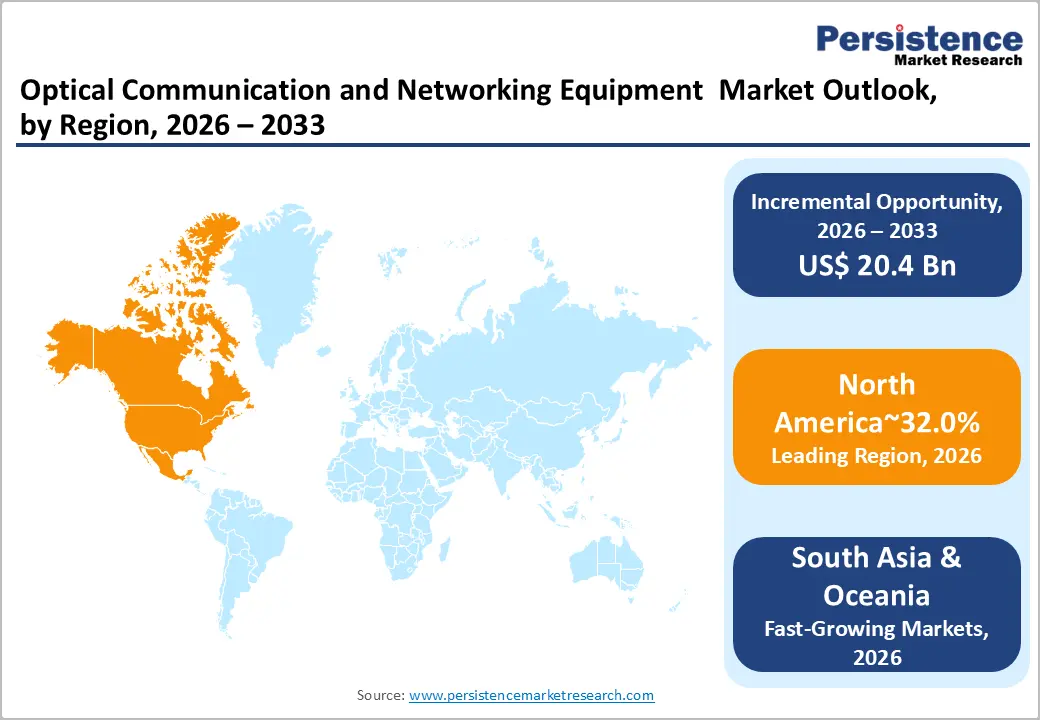
- Regional Leadership: North America dominates the global optical communication and networking equipment market with 32% share in 2025, supported by robust fiber deployments, hyperscale data centers, and advanced 5G network infrastructure.
- Fastest-Growing Region: East Asia captures 21% share in 2025 and stands as the fastest-growing region, driven by China’s government digital infrastructure initiatives, Japan’s all-optical core network deployment, and South Korea’s advanced 5G ecosystem.
- Leading Component: Optical transceivers lead with 35.0% share in 2025, driven by their universal applicability across telecom networks, cloud data centers, and enterprise connectivity applications.
- Leading Industry: Telecom operators & ISPs remain the largest end-user category with 39% share in 2025, anchored by metro, long-haul, and 5G transport network expansions.
- Technology & Innovation Opportunity: Adoption of advanced all-optical networks, fgOTN-based solutions, and AI-enabled optical equipment presents significant growth potential, enabling low-latency, high-bandwidth, and energy-efficient infrastructure for data centers, campuses, and industrial networks.
- Strategic Collaborations & Market Expansion: Partnerships, M&A, and R&D investments, such as Nokia-Infinera and Archangel Lightworks–Omantel collaborations, accelerate market consolidation and innovation in next-generation terrestrial and satellite optical networks.
| Key Insights | Details |
|---|---|
|
Optical Communication and Networking Equipment Market Size (2026E) |
US$ 29.4 Bn |
|
Market Value Forecast (2033F) |
US$ 49.8 Bn |
|
Projected Growth (CAGR 2026 to 2033) |
7.8% |
|
Historical Market Growth (CAGR 2020 to 2025) |
7.0% |
Market Dynamics
Drivers - Growth in Data Traffic and High-Speed Connectivity Demands
Data consumption globally has accelerated dramatically, driven by the proliferation of streaming services, cloud-based applications, and data-intensive digital platforms. The global optical communication and networking equipment market has become essential infrastructure responding to this structural demand shift. According to the International Telecommunication Union (ITU), global internet usage reached approximately 5.5 billion people in 2024, representing 68% of the global population, up from 65% in the previous year. The pace of adoption accelerated significantly, with year-on-year growth increasing from 2.7% to 3.4%, indicating sustained infrastructure investments.
In China, the China Internet Network Information Centre (CNNIC) reported that by December 2024, the nation had 1.108 billion internet users, with mobile internet access accounting for 99.7% of all netizens. Rural internet users reached 313 million, representing 28.2% of total users, supported by the ongoing deployment of 5G and gigabit fibre broadband.
The diversification of access devices, including desktops, laptops, tablets, smart televisions, wearables, smart home devices, and connected vehicles, signals rising demand for resilience, high-bandwidth optical backhaul and metro networks. Within this context, data-intensive services including online shopping (974 million users), e-government (1.004 billion users), online payment (1.029 billion users), and emerging applications such as generative artificial intelligence (249 million users) are significantly increasing traffic volumes, latency sensitivity, and reliability requirements across national networks, thereby driving substantial demand for optical communication and networking equipment market components and systems.
5G and Next-Generation Network Deployments
The worldwide rollout and expansion of 5G infrastructure represents a structural growth catalyst for the Global Optical Communication and Networking Equipment Market, requiring robust optical transport and backhaul solutions to handle massive data transmission.
Asia-Pacific's dominance in 5G commercialisation, particularly in Japan and South Korea, has accelerated optical network modernisation. As of March 2024, India achieved 95.15% village access to 3G or 4G mobile connectivity, reflecting significant progress in extending telecommunications services to tier-2, tier-3, rural, and remote regions. The progression from 4G to 5G networks fundamentally changes the transport architecture, necessitating high-capacity DWDM systems and coherent optical transmission technologies. 5G fronthaul, midhaul, and backhaul networks require 25G, 50G, and 100G optical transceivers, while 5G core network densification drives deployment of advanced multiplexing equipment.
According to market intelligence sources, over 1,500 new hyperscale data centres are planned globally by 2025 to support 5G services, cloud computing, and emerging AI applications, collectively intensifying demand for optical communication and networking components across all geographic regions. The integration of 5G infrastructure with optical backbone networks creates a multi-year investment cycle that propels consistent growth across transceivers, DWDM systems, and optical amplification equipment.
Restraint - High Capital Investment Requirements and Equipment Costs
The deployment of advanced optical communication infrastructure demands substantial capital expenditure from telecommunications carriers, data centre operators, and enterprises. Coherent optical systems, DWDM equipment, and optical amplifiers represent significant cost components, particularly for emerging market operators with constrained budgets.
Geopolitical trade restrictions, including the mandatory removal of certain Chinese vendor equipment from European and North American networks by 2029, have forced operators to undertake costly transition programs spanning 24 months or more. These substitution initiatives incur redesign expenses and alternative silicon qualification costs, eroding economies of scale for smaller vendors and reducing near-term profitability margins. Supply chain fragmentation elevates procurement costs and extends deployment timelines, thereby moderating market growth rates.
Opportunity - Adoption of Advanced Optical Technologies for Enterprise and Data Centre Networks
The transition from copper-based interconnects to fibre-optic solutions within enterprise campuses and data centre environments presents substantial growth potential for the global optical communication and networking equipment market. Enterprise organisations are increasingly deploying fibre-to-the-building and fibre-to-the-desktop architectures to support bandwidth-intensive applications, augmented reality environments, and secure cloud connectivity. Nokia's launch of Aurelis Optical LAN in May 2025 exemplifies this trend, offering next-generation fibre-based in-building networking solutions that reduce cables by up to 70% and power consumption by 40% compared to copper networks while supporting scalable speeds up to 100Gb/s
Data centres face mounting pressure to optimise power efficiency and capacity density simultaneously. AI training workloads increasingly require terabit-class interconnects within and between facilities, compelling adoption of 800G and 1.6Tbps coherent optical modules.
Hyperscale cloud operators are deploying optical circuit switches (OCS) to replace spine switches, yielding improved power consumption, cost structures, and operational flexibility. Coherent's demonstration of a 300x300-port optical circuit switch at OFC 2024 illustrated the architectural shift toward all-optical data centre fabrics that eliminate costly optical-to-electrical-to-optical conversions, thereby reducing capital and operational expenditure. This technology convergence creates an accelerating demand for advanced optical transceivers, coherent pluggable modules, and optical switching systems across the global data centre infrastructure.
Strategic Collaborations, M&A, and R&D Investments in Optical Ecosystems
The global optical networking sector is experiencing significant consolidation and strategic partnerships aimed at accelerating innovation and market penetration. Nokia's completion of its US$2.3 billion acquisition of Infinera in February 2025 created an innovative powerhouse combining two industry pioneers and scaling Nokia's Optical Networks division by 75%. The transaction is expected to yield EUR 200 million in net comparable operating profit synergies by 2027, driven by cost-of-sales efficiencies and portfolio optimisation, while supporting Nokia's strategic objective of achieving double-digit operating margins in its Optical Networks business. This consolidation strengthens Nokia's capabilities in silicon photonics, photonic integrated circuits, and digital signal processor development, positioning the combined entity to capture market share in the rapidly expanding webscale and AI data centre segments.
Beyond Nokia-Infinera, partnerships like the Archangel Lightworks and Omantel collaboration announced in December 2025 demonstrate emerging opportunities in satellite-terrestrial optical networking, deploying laser-based optical communication technologies within terrestrial telecom infrastructure while supporting next-generation hybrid RF-optical links and high-throughput optical systems. These strategic initiatives signal investor confidence in optical technology's critical role in future network architectures and attract sustained R&D investment, thereby accelerating technology maturation cycles and broadening addressable market opportunities.
Category-wise Analysis
Component Insights
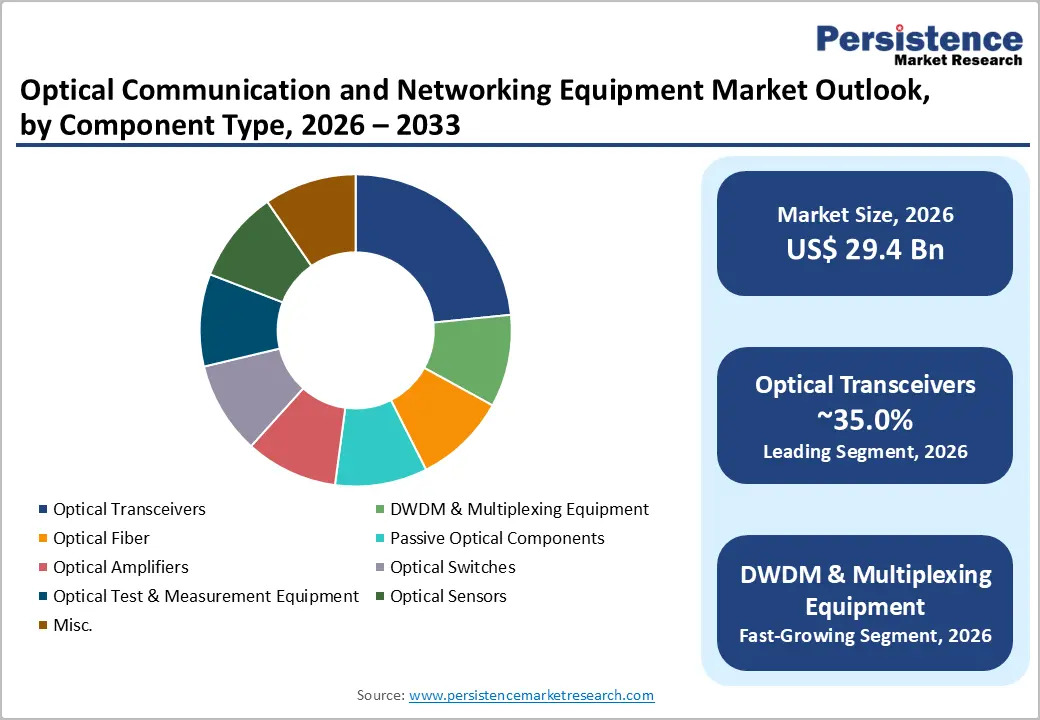
Optical transceivers represent the dominant component segment, commanding approximately 35.0% market share within the Global Optical Communication and Networking Equipment Market. These devices serve as critical interface modules enabling signal conversion between electrical and optical domains across all network applications—from 5G fronthaul connections utilising 25G transceivers to data centre interconnects deploying 400G and emerging 800G coherent modules.
The transceiver segment's dominance reflects the universal applicability of these components across telecommunications infrastructure, cloud computing environments, and enterprise networks. As coherent optical technology penetrates data centre applications, transceiver demand continues to accelerate, particularly for advanced coherent-lite modules optimised for power efficiency and reduced cost structures suitable for hyperscale operator deployments.
Dense Wavelength Division Multiplexing (DWDM) and optical multiplexing equipment represent the fastest-growing component segment within the market. This technology advancement reflects the industry's structural shift toward maximum capacity extraction from existing fibre infrastructure without physical cable proliferation. DWDM systems multiply capacity by transmitting multiple wavelengths across a single fibre strand, addressing the fibre scarcity constraints facing network operators.
Industry Insights
Telecom operators and internet service providers maintain the dominant end-user segment, controlling approximately 39.0% market share. This leadership reflects the fundamental role telecommunications carriers play as primary consumers of optical network infrastructure, deploying equipment across metropolitan networks, long-haul transmission systems, and 5G transport architecture. As carriers expand geographic coverage, upgrade legacy systems to 5G standards, and compete for market share through service differentiation, optical communication equipment consumption remains substantial and predictable. The implementation of Open ROADM standards enables multi-vendor procurement flexibility, allowing carriers to optimise cost structures while maintaining interoperability compliance, thereby intensifying equipment refresh cycles and supporting consistent market demand.
Cloud and hyperscale data centre operators represent the fastest-growing end-user segment, fueling market expansion through unprecedented demand for high-speed optical interconnects driven by artificial intelligence workload proliferation. These operators—including Amazon Web Services, Microsoft Azure, Google Cloud, and Chinese platforms such as Alibaba Cloud and Tencent Cloud—deploy proprietary optical network architectures optimised specifically for AI training environments requiring terabit-class interconnectivity between GPU clusters and memory systems.
Regional Insights and Trends
North America Optical Communication and Networking Equipment Market Trends
North America holds approximately 32% of the global optical communication and networking equipment market, anchored by robust fibre deployment initiatives, extensive cloud infrastructure, and advanced 5G networks. The region's market leadership reflects sustained telecommunications capital expenditure, substantial private equity investment in fiber infrastructure, and the concentration of hyperscale cloud operators such as Amazon, Microsoft, Google, and Meta, driving optical technology adoption.
The U.S. Broadband Equity, Access, and Deployment (BEAD) program has accelerated fibre-to-the-premises deployments, with demand for optical cables expected to grow by 15.9% by 2025, bringing total deployment scale to over 100 million fibre-kilometres, substantially expanding market size within the region. AI-driven data centre optical cable demand surges, with North America accounting for over 40% of global demand, reflecting the concentration of advanced computing infrastructure and artificial intelligence research and development activities.
Google and Meta's submarine fiber optic cable investments, including trans-Pacific and trans-Atlantic initiatives, exemplify the region's forward-looking optical infrastructure development. North American operators increasingly deploy 400G and 800G coherent optics, particularly for links beyond 80 kilometres and intra-data centre applications.
Regulatory support through broadband subsidies, combined with competitive pressure among telecommunications providers and cloud operators, creates sustained optical equipment procurement cycles supporting vendor profitability and capacity expansions.
East Asia Optical Communication and Networking Equipment Market Trends
East Asia commands approximately 21% of the global market, with China, Japan, and South Korea driving regional consumption through government digital infrastructure initiatives, 5G acceleration, and enterprise digitalisation. China represents the Asia-Pacific's single largest market, with the CNNIC documenting sustained infrastructure deployment: IPv6 address blocks reached 69,148 /32 by December 2024, up 1.6% year-on-year, while basic internet resources expanded robustly.
The BharatNet initiative in India, targeting optical fiber connectivity for Gram Panchayats, has achieved 2.13 lakh service-ready connections out of 2.22 lakh planned, with the Amended BharatNet Program extending ambitions to 42,000 uncovered Gram Panchayats and 3.84 lakh villages, alongside plans for 1.5 crore rural home fiber connections. This infrastructure-scale deployment directly translates into substantial optical component procurement across transceivers, fiber cable, amplifiers, and multiplexing equipment.
Japan's completion of nationwide all-optical core network deployment using Fujitsu's 1FINITY Ultra system exemplifies technological advancement in the region, with liquid-cooling and all-optical transmission reducing power consumption by 90% while achieving 48.8 Tbps capacity, setting performance benchmarks that influence procurement specifications across East Asian operators. South Korea's advanced 5G infrastructure and electronics manufacturing ecosystems position the nation as both a significant optical equipment market and a component supplier hub for global markets. Regional government policies promoting digital economy development, rural broadband expansion, and technology self-sufficiency drive consistent optical equipment investment cycles.
Europe Optical Communication and Networking Equipment Market Trends
Europe represents approximately 26% of the global optical communication and networking equipment market, characterised by mature telecommunications infrastructure, stringent regulatory requirements, and accelerating fibre-to-the-home deployments aligned with the European Union's Digital Decade initiative. Eurostat data reveal that in 2025, 94% of EU individuals used the internet within the last three months, reflecting advanced digital adoption, while household internet access levels demonstrated remarkable consistency: the Netherlands and Luxembourg reached 99%, though Greece and Croatia recorded 89% and 88% respectively, indicating continued deployment requirements.
Digital engagement intensified, with one-third of EU individuals using generative AI tools, reflecting the technology sector's advanced sophistication and associated optical infrastructure demands. The EU's mandate for full fibre coverage by 2030 creates regulatory drivers for optical network expansion, while digitalization policies encourage enterprise and government investment in fibre-based connectivity.
European carriers face geopolitical pressures requiring the replacement of specific vendors' equipment by 2029, creating dual-sourcing requirements that extend transition timelines to 24 months and drive optical equipment procurement cycles. Nordic countries—Sweden, Norway, Finland, and Denmark—maintain globally leading fibre penetration rates, supported by public-private partnerships and proactive government policies, while Southern European nations, including Spain and Portugal, pursue substantial fiber network modernisation programs. Eastern European markets, particularly Romania, Bulgaria, and the Baltic states, leverage European Union funding mechanisms to accelerate the deployment of optical infrastructure and catch up with Western European standards.
Competitive Landscape
The global optical communication and networking equipment market is highly consolidated, dominated by major players leveraging advanced technologies, strategic partnerships, and extensive global distribution networks. Leading companies such as Huawei, Nokia, Corning, NEC Corporation, Fujitsu, and Applied Optoelectronics, Inc. drive market growth through innovations in high-capacity optical transport systems, all-optical networks, and AI-enabled solutions.
These players continuously expand their portfolios with advanced optical line systems, pluggable coherent optics, fiber sensing solutions, and next-generation campus and data center connectivity, supported by significant R&D investments to deliver high-speed, low-latency, and energy-efficient equipment. Strategic alliances, large-scale deployments, and collaborations with telecom operators, hyperscale data centres, and enterprises further reinforce the market’s consolidated structure.
Key Industry Developments
- In December 2025 – Applied Optoelectronics, Inc.: AOI introduced a new 400 mW narrow-linewidth semiconductor pump laser to support silicon photonics and co-packaged optics (CPO) architectures in AI data centres. The ultra-high-power optical source enables 800G and 1.6T optical networking by improving power efficiency, wavelength stability, and scalability for next-generation optical communication and networking equipment.
- December 17, 2025 – Archangel Lightworks, Omantel: Archangel Lightworks and Omantel formed a strategic partnership to deploy laser-based optical communication technologies within Omantel’s telecom infrastructure in Oman. The collaboration focuses on optical satellite ground stations, hybrid RF–optical links, and high-throughput optical systems, strengthening optical communication and networking equipment adoption for next-generation satellite and terrestrial networks.
Companies Covered in Optical Communication and Networking Equipment Market
- Huawei Technologies Co. Ltd.
- Corning Incorporated
- Ciena Corporation
- Nokia
- Cisco Systems Inc.
- Fujitsu
- ADVA Optical Networking SE
- NEC Corporation
- Infinera Corporation
- Juniper Networks Inc.
- Thales Group
- General Atomics
- Space Photonics Inc.
Frequently Asked Questions
The global optical communication and networking equipment market is projected to be valued at US$ 20.4 Bn in 2026.
The Optical Transceivers segment is expected to account for approximately 32% of the global Optical Communication and Networking Equipment market by component type in 2026.
The market is expected to witness a CAGR of 7.8% from 2026 to 2033.
The global Optical Communication and Networking Equipment market is driven by surging global data traffic, high-speed connectivity demands from streaming, cloud, and AI applications, and widespread 5G and fiber broadband deployments requiring resilient, high-bandwidth optical networks.
Key market opportunities in the global Optical Communication and Networking Equipment market lie in the widespread adoption of advanced fibre-optic technologies for enterprise and data centre networks, the deployment of high-capacity coherent optical modules and optical circuit switches to support AI and hyperscale workloads, and strategic collaborations, mergers, and R&D investments that accelerate innovation in silicon photonics, optical transceivers, and hybrid satellite-terrestrial optical systems..


