


- Sensors & Controls
- Optical Power Meter Market
Optical Power Meter Market Size, Share, and Growth Forecast, 2026 – 2033
Optical Power Meter Market by Product Type (Virtual Meters, Benchtop Meters, Portable Meters), Detector Type (InGaAs (Indium Gallium Arsenide), Germanium, Silicon, Others), Application (Research & Development (R&D), Installation & Maintenance, Industrial, Manufacturing, Others), and Regional Analysis for 2026-2033
Optical Power Meter Market Share and Trends Analysis
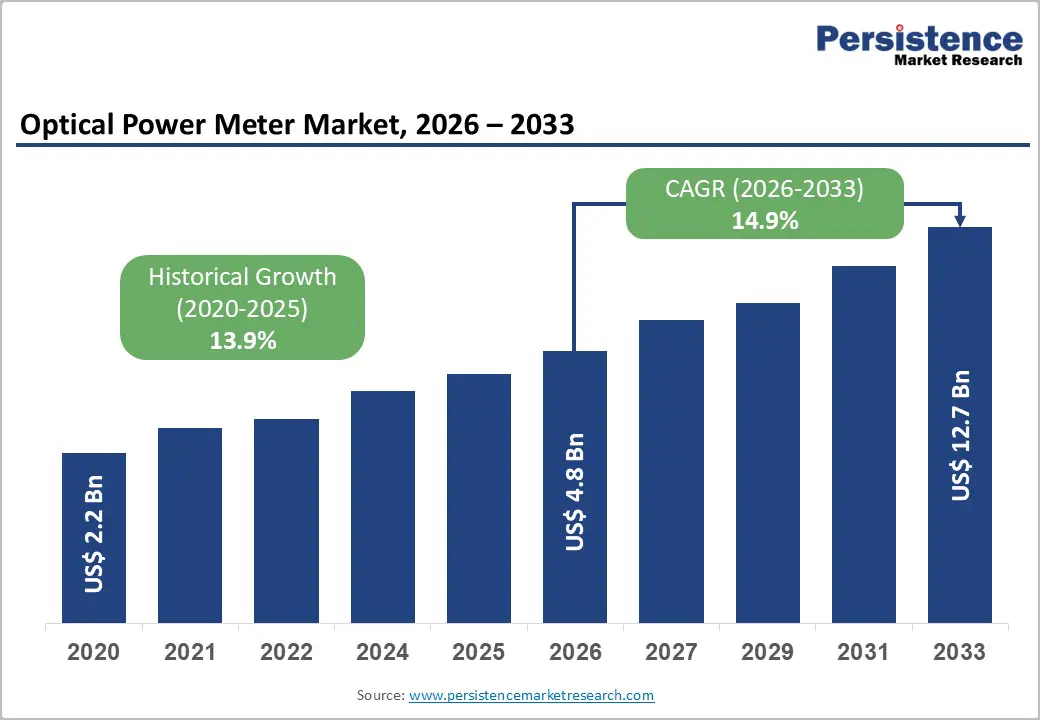
The global optical power meter market size is likely to be valued at US$ 4.8 billion in 2026, and is projected to reach US$ 12.7 billion by 2033, growing at a CAGR of 14.9% during the forecast period 2026−2033.
The market demonstrates stable, infrastructure-led expansion driven by global fiber-optic network densification and precision measurement requirements across telecommunications, data centers, and industrial photonics. Increasing deployment of fiber-to-the-home networks, hyperscale data centers, and 5G backhaul architecture continues to elevate demand for accurate optical signal validation across installation, testing, and maintenance cycles. Rising enterprise reliance on high-bandwidth optical transmission increases the need for reliable measurement tools to minimize signal loss and network downtime. Technology integration strengthens adoption momentum. Digital optical power meters featuring automated calibration, wavelength recognition, and cloud-enabled diagnostics enhance operational efficiency for field technicians and network operators. Industrial automation and laser-based manufacturing processes further reinforce demand through stringent power accuracy requirements.
Key Industry Highlights
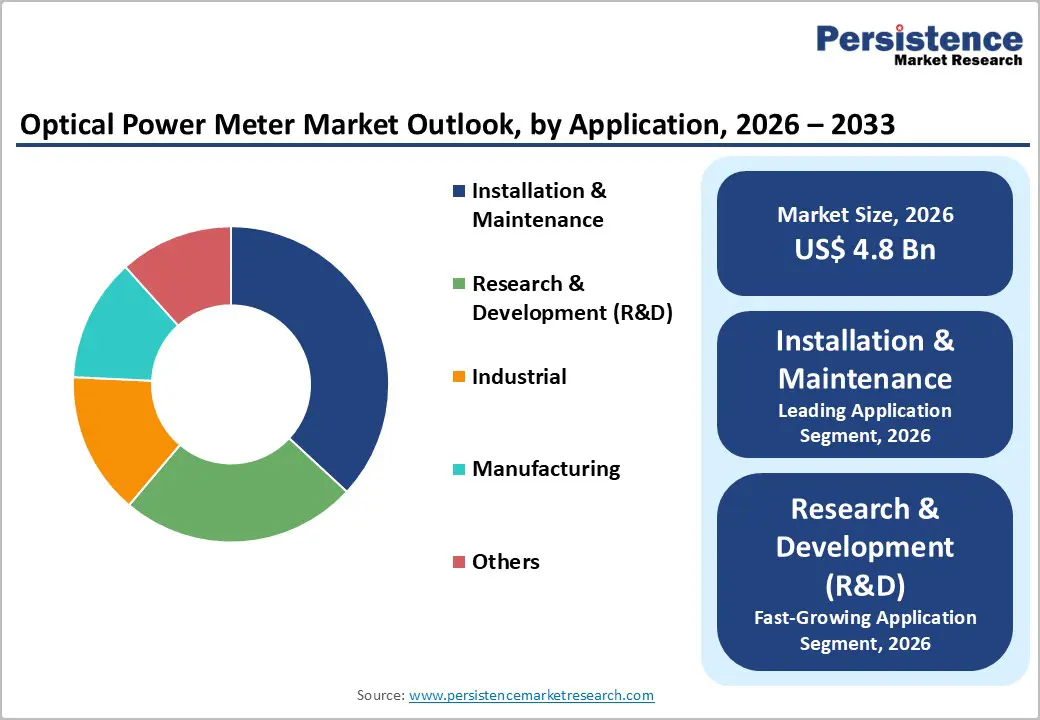
- Leading Application: Installation and maintenance are projected to lead with roughly 38% revenue share in 2026, underpinned by mandatory testing, routine verification, and network densification.
- Fastest-growing Application: R&D applications are anticipated to be the fastest-growing through 2033, owing to photonics research funding and digitalized laboratory workflows.
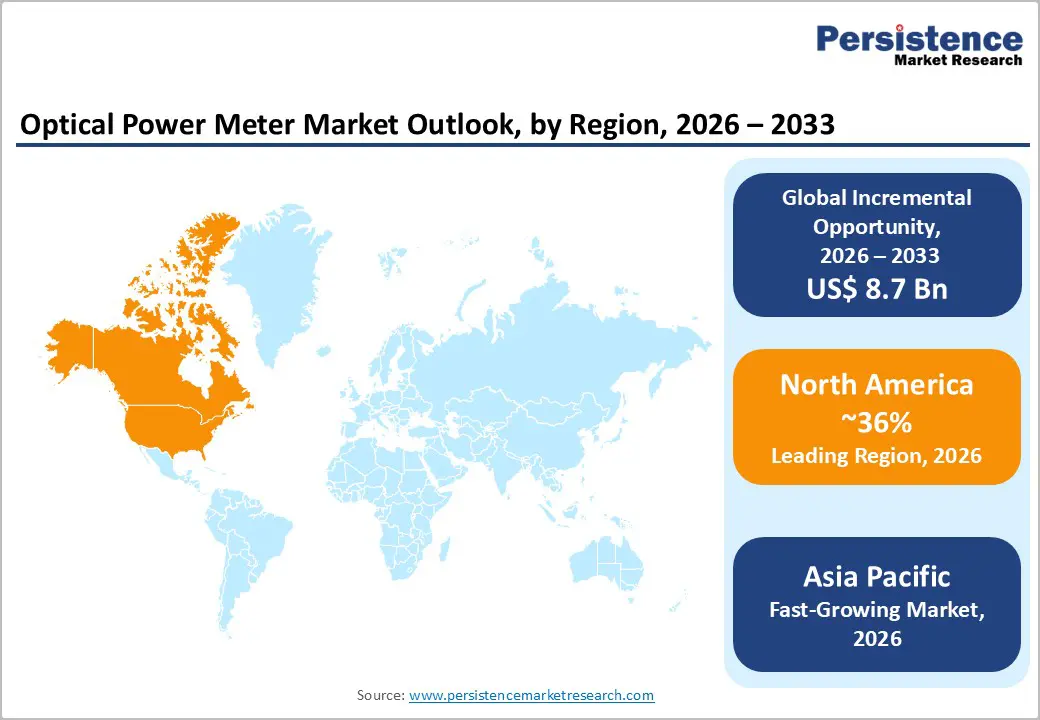
- Dominant Region: North America is expected to dominate with about 36% market share in 2026, powered by advanced transmission standards, hyperscale data centers, and stringent network reliability.
- Fastest-growing Market: Asia Pacific is projected to be the fastest-growing market from 2026 to 2033, driven by large-scale fiber deployments and industrial digitization.
- January 2026: MKS Inc. launched Newport™ advanced benchtop optical power meters designed for faster, more accurate, and fully calibrated measurements tailored to datacom, research, and industrial production needs.
| Key Insights | Details |
|---|---|
| Optical Power Meter Market Size (2026E) | US$ 4.8 Bn |
| Market Value Forecast (2033F) | US$ 12.7 Bn |
| Projected Growth (CAGR 2026 to 2033) | 14.9% |
| Historical Market Growth (CAGR 2020 to 2025) | 13.9% |
Market Factors – Growth, Barriers, and Opportunity Analysis
Expansion of Fiber-Optic Communication Infrastructure
The rapid build-out of fiber-optic communication networks creates structural demand for precise signal verification tools across deployment and operational phases. Fiber links require strict control of insertion loss, attenuation, and continuity to meet service-level expectations for data throughput and network stability. Optical power meters support installers and operators during commissioning, fault isolation, and periodic inspection by delivering quantitative validation of optical signal performance. Large fiber roll-outs across backbone, access, and last-mile networks expand the number of endpoints and interconnections, raising the frequency of testing activities across telecom operators, infrastructure contractors, and utility partners. This environment positions optical power measurement as a routine operational requirement rather than an occasional diagnostic task.
Public digital infrastructure programs reinforce this demand pattern through scale and geographic reach. India’s national broadband initiative illustrates the relationship between fiber expansion and testing intensity. As of May 2025, the BharatNet program reported deployment of over 693,000 kilometers of optical fiber and activation of more than 1.28 million fiber-to-the-home connections, reflecting extensive network penetration across rural and semi-urban regions. Each deployed route and customer connection requires verification of signal strength to ensure compliance with technical standards and continuity of service delivery. Similar government-led broadband strategies worldwide prioritize high-capacity fiber as the foundation for digital services, cloud adoption, and wireless backhaul.
Growth of Photonics-Enabled Industrial and Medical Applications
Photonics is a foundational technology for advanced industrial and medical systems, driving demand for precision optical measurement tools. Official research and standards bodies such as the U.S. National Institute of Standards and Technology (NIST) prioritise photonics metrology to support both advanced manufacturing and healthcare applications, because light-based processes underpin critical measurement and sensing functions in these sectors. Photonics techniques enable high-resolution imaging, spectral analysis, and calibration that support quality assurance and operational standards across diverse applications ranging from laser-based industrial fabrication to diagnostic imaging systems in clinics. The Physical Measurement Laboratory of the U.S. National Institute of Standards and Technology (NIST) highlights photonics’ role in technologies such as screen-based and in-vitro diagnostic platforms, indicating that calibrated optical detection and measurement are essential to system performance and safety in clinical environments.
Government strategies also underscore photonics as a strategic enabler of digital and industrial transformation. For example, European Commission (EC) planning documents identify photonics as essential to digital competitiveness, supporting initiatives in healthcare, smart manufacturing, and communications that rely on light-based technologies for data transfer, precision control, and system integration. This recognition translates into targeted funding and partnerships aimed at driving innovation across value chains where light-based measurement and control are business-critical. Since industrial automation and medical diagnostics depend on quantifying optical signals with high accuracy, investment in these upstream technologies supports downstream application reliability and system certification.
High Calibration and Maintenance Complexity
The precision and reliability of an optical power measurement depend heavily on rigorous calibration and ongoing maintenance. Optical power meters must be calibrated against traceable national measurement standards to ensure that readings reflect true optical power levels within defined uncertainty limits. Calibration processes require specialized equipment, trained personnel and strict adherence to standards such as IEC 61315:2019, which mandates documented procedures, environmental control (for example, temperature and humidity) and traceability to national metrology institutes. These requirements increase operational workload and technical burden for organizations that deploy and manage these devices at scale.
Operational teams often need to return instruments to accredited laboratories or manufacturers for calibration due to a lack of local facilities capable of performing such specialized adjustments. This logistical dependency introduces downtime and additional costs for transport, service fees and potential instrument unavailability. A report from the NIST indicates that field-calibrated optical power meters can still exhibit uncertainty around ±5%, demonstrating that achieving high accuracy demands meticulous calibration stages and consistent quality control throughout the calibration chain.
Complexity in Integration with Legacy Systems
Integrating modern testing instruments with existing legacy systems presents a substantial operational barrier. Legacy infrastructure typically operates on outdated interfaces, proprietary protocols and seldom-updated software, which lack built-in support for contemporary connectivity standards. This gap forces engineering teams to develop bespoke adapters or middleware to enable basic communication between new meter hardware and older control or monitoring platforms. Legacy documentation is often incomplete and original developers may no longer be available, creating a knowledge gap that magnifies integration risks and prolongs deployment timelines. Government evidence from digital modernization efforts shows that large IT estates across agencies require significant modernization, with outdated systems continuing to dominate operational workloads and posing barriers to adopting advanced tools and automation frameworks.
Technical differences extend beyond interfaces to encompass security, data handling and performance controls. Older platforms were seldom designed for high-resolution data streams or the real-time telemetry required by advanced optical measurement devices. Bridging this divide can expose systems to increased cybersecurity risk and require complex validation to ensure data integrity across the integrated environment. Moreover, customization for each unique legacy setup increases project cost and creates ongoing maintenance responsibilities. Enterprises must often retain specialized skills for both legacy and modern systems, a combination that is increasingly scarce in the workforce.
Integration with Smart Monitoring and Digital Test Ecosystems
Rising network density and service quality expectations elevate digitally connected measurement solutions into core operational assets. Smart monitoring alignment converts optical testing from isolated field activity into an integrated workflow embedded within network operations. Automated data capture, remote visibility, and software-driven analytics support continuous performance validation across deployment and maintenance cycles. Digital test ecosystems strengthen coordination between field teams, network operations centers, and compliance functions, supporting faster issue identification and structured documentation. This operating model aligns measurement activity with enterprise digital transformation priorities, reinforcing transparency, traceability, and decision discipline across complex fiber infrastructures.
Public digital infrastructure programs reinforce this opportunity through policy direction and execution frameworks. National connectivity initiatives published on official government portals, such as the National Broadband Mission by the Government of India, emphasize large-scale fiber deployment, service reliability, and lifecycle accountability as strategic objectives. Such policy focus increases reliance on centralized monitoring, standardized reporting, and predictive maintenance practices across geographically dispersed assets. Smart ecosystems that integrate cloud platforms and Internet of Things (IoT – Internet of Things) connectivity support real-time supervision without dependence on repetitive manual testing. Digital integration strengthens governance oversight, contractor accountability, and long-term service assurance across publicly supported networks.
Emerging Market Infrastructure Development
Emerging market infrastructure development is a pivotal driver of long-term industry growth given the rapid expansion of broadband and mobile connectivity in developing economies. Government-led initiatives are transforming digital infrastructure by extending optical fiber networks to underserved regions, enabling telecom operators and service providers to deliver high-speed broadband and next-generation services. For example, India’s BharatNet program aims to provide broadband connectivity to approximately 250,000 village gram panchayats with extensive optical fiber cable deployment to improve access to e-services and socio-economic inclusion, underscoring public sector commitment to robust digital networks.
Demand for optical test instruments rises in parallel with infrastructure build-out, especially where fiber-to-the-home (FTTH), backhaul links for 5G, and enterprise connectivity projects are prioritized. Expanding network footprints in Asia, Africa, and Latin America translate into consistent requirements for calibration, installation, and troubleshooting equipment, which facilitates efficient workforce deployment and minimizes costly service faults during roll-outs. As operators scale infrastructure to support high-capacity traffic and quality-of-service commitments, precise optical measurement is essential to certify performance and optimize operational effectiveness.
Category-wise Analysis
Product Type Insights
Portable meters are anticipated to secure around 46% of the optical power meter market share in 2026, reflecting widespread adoption across field installation, maintenance, and troubleshooting activities. This leadership position is reinforced by strong utilization across telecom rollout teams, industrial maintenance units, and laboratory environments that require fast, accurate, on-site optical validation. Portability supports operations in remote locations, dense urban corridors, and confined industrial settings where fixed systems are impractical. Use cases include fiber link verification during last-mile deployment, attenuation checks in data centers, and alignment testing in photovoltaic manufacturing lines. Integration of rugged enclosures, long-life rechargeable batteries, and touchscreen interfaces improves usability under field conditions.
Virtual meters are expected to be the fastest-growing segment during the 2026–2033 forecast period, propelled by integration with software-defined testing platforms and digital instrumentation ecosystems. Growth momentum reflects rising reliance on centralized analytics, cloud-enabled monitoring, and remote diagnostics within advanced production and research environments. Virtualized measurement reduces hardware intensity, enhances scalability, and enables multi-point testing across distributed operations. Integration with digital manufacturing systems supports continuous performance evaluation and data-driven process optimization. Progress in optical sensing technologies, data acquisition architecture, and calibration algorithms strengthens measurement precision.
Application Insights
Installation and maintenance are likely to be the leading segment with a projected 38% of the optical power meter market revenue share in 2026 due to mandatory testing requirements during network deployment and lifecycle management. Segment leadership is supported by routine verification needs across fiber network rollout, acceptance testing, fault localization, and performance assurance activities. Service providers follow standardized optical testing procedures to validate signal strength, insertion loss, and continuity at multiple deployment stages. Ongoing network densification and capacity upgrades increase testing frequency across access and backbone infrastructure. Clinical credibility of standardized testing protocols and provider referrals reinforce recurring demand, particularly where compliance and service-level assurance are critical.
Research and development are anticipated to be the fastest-growing segment from 2026 to 2033, fueled by expanding photonics research funding, digitalization of laboratory workflows, and cost-efficient technology-enabled service delivery models. Growth reflects intensified focus on optical communication systems, integrated photonics, and advanced sensing technologies within academic and industrial research environments. Laboratories increasingly adopt precision measurement tools to support experimental validation, prototype testing, and performance benchmarking. Digital laboratory management systems drive demand for instruments compatible with automated data capture and analysis frameworks. Examples include optical characterization in semiconductor research and laser performance evaluation in material science studies.
Regional Insights
North America Optical Power Meter Market Trends
North America is expected to dominate with an estimated 36% of the optical power meter market value in 2026, reflecting concentration of high-value optical infrastructure, advanced transmission architectures, and sustained investment in precision network assurance. Market leadership is anchored in extensive deployment of long-haul and metro fiber networks, hyperscale data centers, and mission-critical communication systems that operate under tight optical power budgets. Rapid transition toward 400G and 800G transmission standards elevates demand for high-accuracy measurement to manage signal integrity, loss margins, and system interoperability. Strong alignment between telecom operators, cloud service providers, defense communication programs, and healthcare networks sustains recurring procurement cycles focused on reliability rather than volume. Regulatory emphasis on service-level compliance, network resilience, and calibration traceability institutionalizes routine optical testing across deployment and operational phases, reinforcing revenue stability.
Dominance is further supported by innovation-driven consumption patterns across photonics research, semiconductor manufacturing, and medical device production. High density of research institutions and advanced manufacturing facilities accelerates early adoption of next-generation optical testing solutions integrated with automated and digitalized workflows. Procurement priorities emphasize accuracy, repeatability, and compatibility with software-defined test environments, favoring premium instruments over cost-optimized alternatives. Presence of accredited calibration laboratories and mature service ecosystems strengthens lifecycle dependency and replacement demand. Skilled technical workforce specialization in fiber engineering and optical diagnostics increases utilization intensity per installation.
Europe Optical Power Meter Market Trends
Europe demonstrates a distinct market profile shaped by advanced infrastructure maturity and continuous technology renewal across Germany, France, the United Kingdom, Italy, and the Nordic economies. Demand is driven by systematic upgrades of fiber networks to support higher-capacity transmission, dense urban connectivity, and rising cross-border data traffic. Strong regulatory frameworks governing network quality, safety, and calibration accuracy institutionalize routine optical testing across deployment and operational stages. Emphasis on sustainability and energy efficiency influences procurement priorities, encouraging adoption of instruments that support power optimization and minimized signal loss. High concentration of research institutions, telecommunications laboratories, and standards organizations elevates requirements for traceable and repeatable measurement, sustaining demand for precision-focused solutions rather than volume-led expansion.
Growth opportunities are reinforced by rising investment in data center interconnection, industrial automation, and next-generation transportation and energy systems. Expansion of rail signaling, smart grid communication, and intelligent manufacturing environments increases reliance on fiber-based control networks requiring continuous performance verification. Public funding initiatives supporting photonics research, quantum communication, and advanced optical sensing strengthen adoption within research and development environments. Manufacturing ecosystems prioritize integration of optical testing within automated production and regulatory compliance workflows, reinforcing recurring usage. Strong collaboration between academia and industry accelerates validation of emerging optical technologies.
Asia Pacific Optical Power Meter Market Trends
Asia Pacific is projected to emerge as the fastest-growing market for optical power meters during the 2026–2033 forecast period, supported by large-scale green field fiber deployments, rapid industrial digitization, and sustained public and private investment in high-capacity connectivity infrastructure. Growth momentum is shaped by extensive rollout of fiber-to-the-home networks, metropolitan backhaul expansion, and subsea cable projects that require continuous optical validation across installation and optimization stages. Network build intensity remains structurally higher than mature geographies, driving elevated testing frequency per deployment cycle. Strong alignment with smart city programs, manufacturing modernization initiatives, and enterprise digital transformation sustains long-term demand for field-ready and scalable optical measurement solutions.
Acceleration is reinforced by expansion of electronics manufacturing, semiconductor fabrication, and applied photonics research across major production hubs. Integration of optical testing into automated quality control and high-speed interconnect validation workflows increases recurring utilization. Localization of manufacturing and component sourcing reduces cost barriers and shortens procurement cycles, encouraging adoption among mid-scale operators and industrial users. Rising data center density and cloud infrastructure investment elevate requirements for precision optical power validation under dense interconnect environments.
Competitive Landscape
The global optical power meter market structure exhibits moderate fragmentation with leading multinational instrumentation companies holding a combined share exceeding one-third of global revenue. Market structure reflects coexistence of global technology leaders and a broad base of regional and niche suppliers addressing price-sensitive and application-specific demand. Competitive intensity remains controlled due to high entry barriers linked to calibration standards, measurement precision, and certification requirements. Buyers across telecommunications, data centers, manufacturing, and research environments prioritize reliability and traceability, which reinforces preference for established suppliers with proven validation capabilities. Product differentiation focuses on wavelength accuracy, dynamic range, repeatability, and compatibility with advanced fiber systems. As networks migrate toward higher transmission speeds and tighter power margins, supplier credibility and long-term service support increasingly influence procurement decisions, strengthening the position of companies with global footprints and strong technical depth.
Keysight Technologies, VIAVI Solutions Inc., EXFO Inc., Anritsu, and Yokogawa Test & Measurement Corporation anchor the competitive landscape through comprehensive portfolios spanning portable, bench-top, and software-integrated solutions. Competitive positioning extends beyond hardware performance into digital diagnostics, automation readiness, and lifecycle service offerings. Integration with network analytics platforms, cloud-enabled test environments, and remote monitoring systems enhances customer value and switching resistance. These companies maintain advantage through sustained investment in research, compliance with international standards, and close alignment with telecom operators, hyperscale data center operators, and industrial manufacturers. Strong global service networks support calibration, training, and post-deployment optimization, reinforcing recurring revenue streams.
Key Industry Developments
- In January 2026, the Bangalore Electricity Supply Company saved an estimated INR 120 crore in five months by rolling out an automated optical port probe meter reading system that eliminated human error and revenue leakage in billing processes.
- In June 2025, Kingfisher International announced enhanced traceable calibration capability for optical power meters using ISO 17025-accredited processes that deliver 0.7% uncertainty across a wide wavelength range, setting a new industry benchmark for measurement accuracy and laboratory flexibility.
- In March 2025, Yokogawa Test & Measurement released next-generation AQ2300 Series optical power meter modules featuring faster sampling, enhanced data transfer, and synchronous integration with source measure units to support high-speed optical and electronic measurement workflows.
Companies Covered in Optical Power Meter Market
- Keysight Technologies
- VIAVI Solutions Inc.
- EXFO Inc.
- Anritsu
- Yokogawa Test & Measurement Corporation
- Thorlabs, Inc.
- Newport Corporation.
- Kingfisher International
- GAO Tek & GAO Group Inc.
Frequently Asked Questions
The global optical power meter market is projected to reach US$ 4.8 billion in 2026.
Expanding fiber-optic network deployment, rising need for high-speed data transmission, and mandatory performance validation across telecommunications, data centers, healthcare, and advanced manufacturing environments are driving the market.
The market is poised to witness a CAGR of 14.9% from 2026 to 2033.
Large-scale fiber infrastructure expansion, growth of data centers and 5G backhaul networks, rising photonics research activity, and increasing adoption of software-integrated optical testing solutions are creating attractive growth avenues.
Some of the key market players include Keysight Technologies, VIAVI Solutions Inc., EXFO Inc., Anritsu, Yokogawa Test & Measurement Corporation, Thorlabs, Inc.


