


- Semiconductor Materials & Components
- Network Interface Card (NIC) Market
Network Interface Card (NIC) Market Size, Share, and Growth Forecast, 2026 - 2033
Network Interface Card (NIC) Market by Connectivity (Wired NICs, Wireless NICs), Data Rate (Upto 100 Mbps, 100 Mbps - 1Gbps, 1 Gbps - 40 Gbps, 40 Gbps - 100 Gbps, Above 100 Gbps), End-user (Data Centers, Telecom & Networking Service Providers, BFSI, Manufacturing / Industrial, Enterprises / Corporates, Healthcare, Government & Defense, Others), and Regional Analysis for 2026 - 2033
Network Interface Card (NIC) Market Size and Trends Analysis
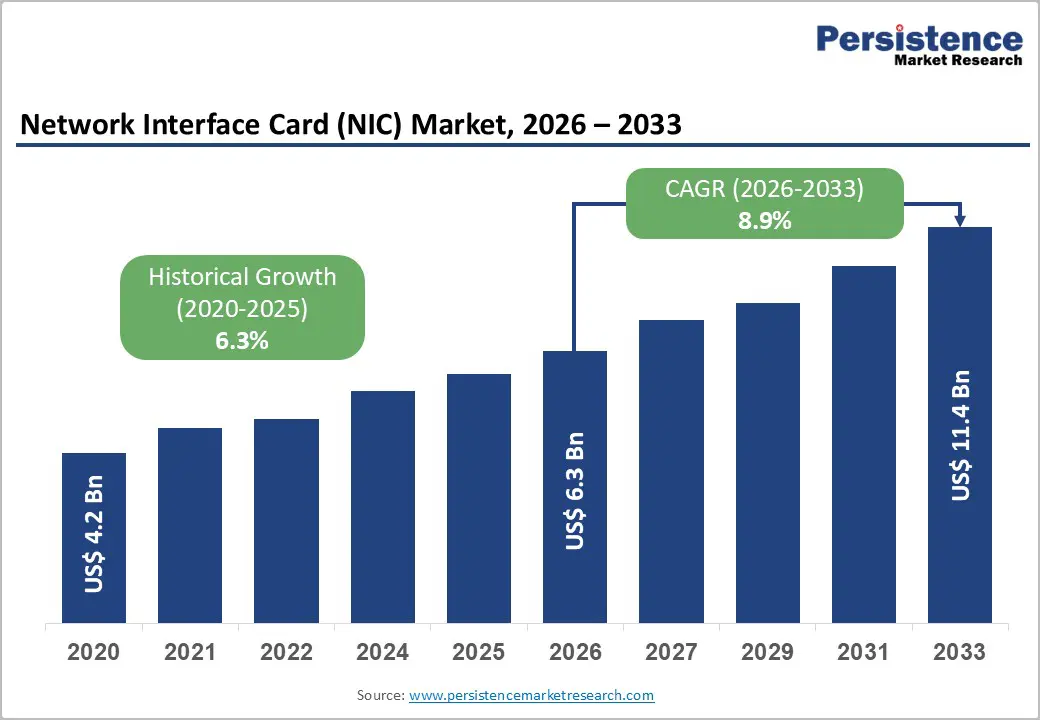
The global network interface card (NIC) market size is projected to rise from US$6.3 billion in 2026 to US$11.4 billion by 2033, to witness a CAGR of 8.9% during the forecast period from 2026 to 2033. The need for ultra-low-latency data transfer, scalable bandwidth, and efficient packet processing has intensified with the rise of cloud computing, virtualization, and AI/ML workloads. Enterprises increasingly prioritize NICs with advanced security, programmability, and energy-efficient designs to meet evolving regulatory, sustainability, and workload requirements.
Key Industry Highlights:
- Leading Connectivity: Wired NICs dominate with over 58% share in 2026 & projected to reach US$ 5.4 Bn by 2033, driven by demand for reliable, low-latency, and high-throughput performance in cloud, AI, and virtualization environments. Wireless NICs grow at a strong 13.1% CAGR, fueled by Wi-Fi 6/6E/7 upgrades and IoT proliferation.
- Leading Data Rate: 1–40 Gbps NICs lead with over 43% share in 2026, valued at US$ 2.7 Bn, offering an optimal cost–performance balance for enterprise, SME, and edge deployments. Above 100 Gbps NICs represent the fastest-growing category, driven by hyperscale AI data centers, NVMe-oF storage, and large-scale HPC clusters demanding ultra-high bandwidth and deterministic latency.
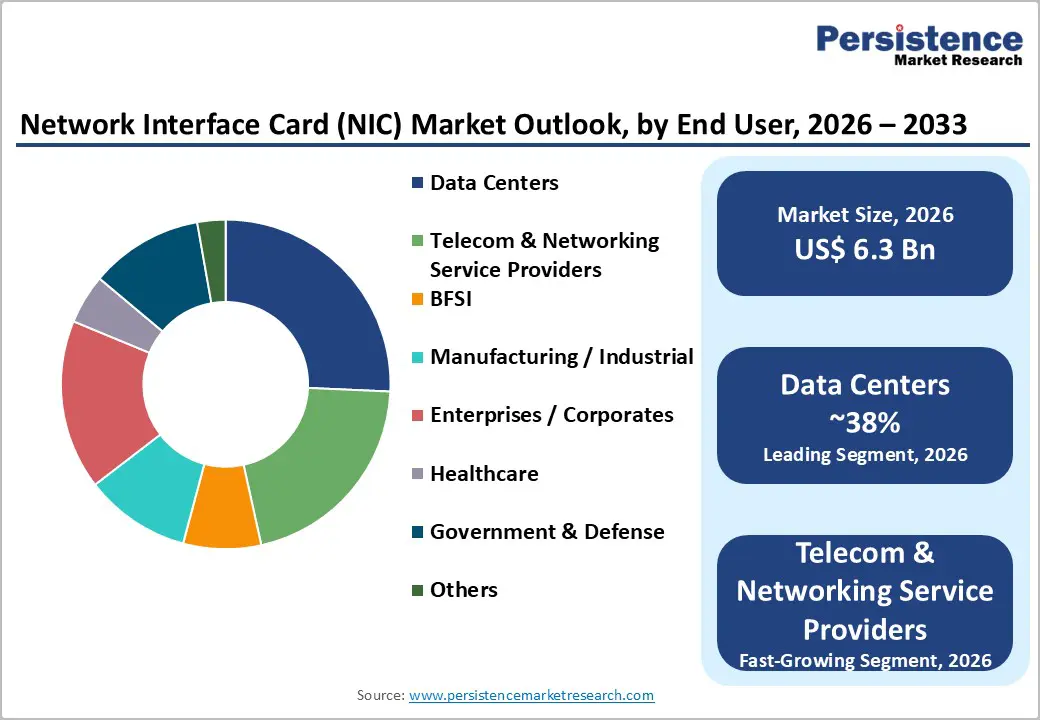
- Leading End-user: Data centers capture over 38% share in 2026, valued above US$ 2.4 Bn, driven by AI/ML workloads, virtualization, cloud-native architectures, and expansion of hyperscale and colocation facilities. Telecom and networking providers grow rapidly as 5G, fiber broadband, and edge-network architectures demand high-bandwidth, ultra-low-latency NICs.
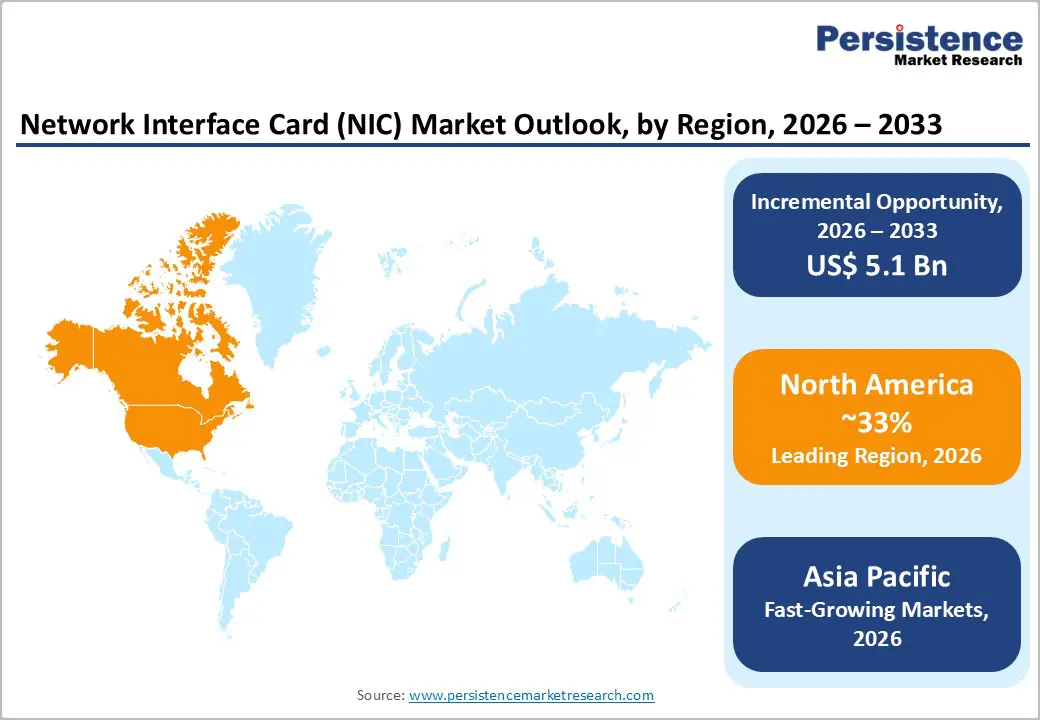
- Leading Region: North America leads with ~33% share in 2026, valued at ~US$ 2.1 Bn, supported by strong semiconductor capability, AI-first data center investments, and 83% 5G population coverage. Asia Pacific is the fastest-growing region with a 14.3% CAGR, expected to exceed US$ 4.5 Bn by 2033, driven by manufacturing hubs, telecom upgrades, local chip production, and rising broadband penetration across India, South Korea, and Japan.
- Growth Indicator: High-speed Ethernet adoption, SDN/NFV virtualization, and the shift toward 25/40/100/400/800G networking are accelerating NIC upgrades. Explosive cloud and data-center expansion, including 523 MW added in Northern Virginia, combined with global 5G coverage reaching ~55% of the population by 2025, significantly boosts NIC demand.
|
Key Insights |
Details |
|
Network Interface Card (NIC) Market Size (2026E) |
US$6.3 Bn |
|
Market Value Forecast (2033F) |
US$11.4 Bn |
|
Projected Growth (CAGR 2026 to 2033) |
8.9% |
|
Historical Market Growth (CAGR 2020 to 2025) |
6.3% |
Market Dynamics
Driver - Surge in Demand for High-Speed Ethernet and Network Virtualization
Enterprise adoption of SDN and NFV is transforming NIC requirements, driving demand for advanced features like SR-IOV, VM queue support, and programmable offloading. The shift from 10GbE to 25/40/100GbE and upgrades to 400G and 800G in hyperscale data centers and telecom networks reflects the need for higher bandwidth to support containerized workloads, microservices, and real-time analytics. Modern NICs with offloading capabilities reduce CPU load, optimize traffic management, and enhance overall network efficiency, enabling enterprises to meet the performance demands of virtualization and bandwidth-intensive applications.
Explosive Growth in Data Center Deployments and Cloud Computing
Enterprise migration of workloads to cloud platforms is driving demand for high-speed, low-latency NICs capable of handling massive data traffic and scalable server-to-server interconnects. Adoption of AI, big data analytics, IoT, and hybrid/multi-cloud architectures increases the need for SmartNICs and RDMA-enabled solutions for optimized performance. Edge computing and rapid digital transformation in North America, Europe, and the Asia Pacific further accelerate NIC adoption, supported by government initiatives and private investments, for instance, Northern Virginia added 523 MW of new data center capacity in a single year.
Widespread Deployment of 5G Networks and IoT Ecosystem Expansion
The rapid global deployment of 5G networks, covering ~55 % of the population and accounting for ≈3 billion mobile broadband subscriptions in 2025, is driving demand for advanced NICs capable of ultra-low latency, high throughput, and enhanced reliability. Applications across smart cities, connected vehicles, industrial IoT, edge computing, and AI-driven real-time processing increasingly rely on NICs to handle massive device connectivity and distributed computing needs. The expansion of 5G infrastructure and mobile technologies, which contribute ~5.8 % (~$6.5 trillion) to global GDP, is extending NIC demand beyond traditional data centers into telecommunications and edge networks.
Restraint - Supply Chain Vulnerabilities and Semiconductor Dependency
The NIC market faces structural restraints due to its dependence on advanced semiconductor components and globally distributed fabrication ecosystems, where geopolitical tensions and regional manufacturing disruptions create direct production and delivery risks. Limited foundry capacity for leading-edge process nodes continues to cause supply bottlenecks, while tariff changes and trade-policy uncertainty increase cost volatility for globally sourced components. The supply chain shocks observed in 2022–2023, which led to widespread delivery delays and higher manufacturing costs, particularly affected NIC penetration in price-sensitive segments. Manufacturers pursuing supply-chain diversification and geographic localization require high capital outlays that compress margins and reduce competitive agility.
Opportunity - Artificial Intelligence and Machine Learning Infrastructure Acceleration
The rapid expansion of AI/ML workloads driven by hyperscale training clusters, real-time inference, and distributed ML frameworks is creating unprecedented demand for high-performance NICs capable of ultra-low-latency, high-bandwidth data movement. Smart NICs with hardware accelerators, RDMA support, and tensor-optimized traffic handling are becoming critical enablers of AI infrastructure, commanding premium pricing over traditional NICs. With enterprises investing more in AI data centers than in conventional virtualization environments, advanced NICs are now viewed as core compute components rather than commodity networking devices. Organizations deploying generative AI, LLMs, and real-time analytics increasingly rely on such NICs to eliminate network bottlenecks and sustain large-scale model performance.
Edge Computing and Distributed Infrastructure Expansion
The rapid expansion of 5G networks and the rise of latency-sensitive applications are accelerating the adoption of edge computing architectures, creating new demand for specialized NICs. Edge data centers, telecom aggregation sites, autonomous vehicle processing nodes, and IoT gateway infrastructures increasingly require NICs that deliver high throughput while maintaining low power consumption and compact, ruggedized designs. Unlike centralized hyperscale facilities, these distributed environments need tailored NIC configurations optimized for constrained space and thermal budgets. This shift opens high-growth, relatively unsaturated market segments for manufacturers offering edge-optimized NIC solutions engineered for performance, efficiency, and durability.
Category-wise Analysis
By Connectivity Insights
Wired NICs are expected to account for more than 58% share in 2026 & are projected to be valued at US$ 5.4 billion by 2033 as enterprises need highly reliable, stable, and interference-free connectivity to support mission-critical workloads, data-intensive applications, and rapidly growing bandwidth demands. Organizations increasingly prioritize consistent low latency, secure data transfer, and high throughput for cloud, AI, and virtualization environments, where wired NICs outperform wireless options.
Wireless NICs are projected to grow at a CAGR of 13.1% driven by the increasing need for flexible, cable-free connectivity to support mobile devices, IoT sensors, and remote work environments. The rapid expansion of Wi-Fi 6/6E/7 upgrades drives demand for higher-speed wireless interfaces. Smart homes, industrial automation, and edge devices require scalable, easy-to-install wireless NICs to avoid costly wired infrastructure. The high-bandwidth content also pushes organizations to deploy more advanced wireless NICs to ensure seamless mobility and network performance.
By Data Rate Insights
1 Gbps - 40 Gbps are expected to account for over 43% share nearly US$ 2.7 billion in 2026, reflecting this speed range's optimal performance-to-cost-effectiveness balance for contemporary enterprise and data center deployments. These speed tiers meet the rising needs of virtualization, video streaming, hybrid cloud adoption, and growing device density without requiring the high capex of 100G+ upgrades. SMEs, edge infrastructure, and campus networks continue to prioritize 1–40 Gbps NICs as they offer sufficient throughput, easy integration, and wide compatibility across existing network architectures.
The above 100 Gbps are expected to grow significantly, driven by hyperscale data center expansion, AI infrastructure buildouts, and high-performance computing deployments requiring extreme bandwidth capacity and deterministic low-latency characteristics. Enterprises are scaling AI/ML training, real-time analytics, and cloud-native applications that require ultra-high-speed data movement. The surge in high-performance storage (NVMe-oF) and edge workloads requires NICs that handle massive bandwidth with minimal congestion, accelerating adoption of >100 Gbps solutions.
By End-user Insights
Data centers are expected to account for more than 38% share with value reaching more than US$ 2.4 billion in 2026. They require high-performance, scalable, and reliable network connectivity to support massive data traffic, cloud workloads, and AI-driven applications. Growing demand for low-latency communication, high-bandwidth throughput, and efficient server-to-server interconnects further accelerates the adoption. Virtualization, SDN, and distributed computing also push data centers to deploy advanced NICs for optimized workload handling. Rising hyperscale investments and the expansion of colocation facilities drive continual upgrades of network infrastructure, boosting NIC demand.
Telecom and networking service providers will grow at a rapid rate as they need high-performance, low-latency NICs to support the rapid expansion of 5G, fiber broadband, and edge networking. The surge in data traffic, cloud connectivity, and IoT devices requires scalable, high-bandwidth interfaces to maintain network reliability and speed. Providers also demand advanced features such as virtualization support, SmartNIC capabilities, and enhanced security for modern network architectures. Their continuous infrastructure upgrades and migration to software-defined and cloud-native networks further accelerate NIC adoption.
Regional Insights
North America Network Interface Card (NIC) Market Trends
North America is projected to account for over 33% with a value reaching ~ US$ 2.1 billion by 2026, strengthened by its mature semiconductor ecosystem and continuous innovation from major vendors such as Intel, NVIDIA, and Broadcom, supporting advanced data-center networking needs. The region’s aggressive investments in AI-optimized data-center modernization and the rapid expansion of hyperscale and colocation facilities are driving demand for high-performance, low-latency NIC solutions. Canada’s CIB commitment of over CAD 2 billion in 2024 to extend high-speed internet to 430,000 rural and remote households highlights rising connectivity infrastructure requirements. As of Q1 2025, North America achieved 314 million 5G connections covering 83% of the population, while U.S. wireless data traffic reached a record 132 trillion MB in 2024, further amplifying NIC demand across telecom and cloud networks.
Asia Pacific Network Interface Card (NIC) Market Trends
Asia Pacific is the fastest-growing region, with a projected CAGR of 14.3% and expected to exceed US$4.5 billion by 2033, driven by large-scale manufacturing expansion, digital transformation programs, and telecom infrastructure upgrades. The region’s dense semiconductor and electronics supply chain, especially in China, Taiwan, South Korea, and Japan, creates strong native demand for NIC components and system integration. Government policies promoting domestic chip production and tech self-reliance further accelerate the adoption of locally made NICs. Rapid digitalization beyond metro areas is spurring micro/edge data-center growth in Tier-2/3 cities, increasing NIC deployment density. Rising broadband penetration supports this; for example, India surpassed 1,002.85 million internet/broadband subscribers by June 2025, while South Korea and Japan stood at ≈89% and ≈86%.
Europe Network Interface Card (NIC) Market Trends
Europe’s network interface card (NIC) market, expanding at an estimated 8.2% CAGR, is shaped by strong EU regulatory priorities around data sovereignty, cybersecurity, and sustainable ICT procurement. Accelerated cloud migration and industrial automation are increasing demand for high-performance NICs across enterprises, telecom networks, and edge-computing sites. EU Digital Decade goals for universal gigabit and full 5G coverage by 2030 further push network upgrades in homes, businesses, and data centers. Growing device penetration, 70.9% of EU residents using internet-connected devices in 2024, and near-universal 5G availability in countries such as Germany ≈99.1% coverage in 2025, reinforce NIC adoption needs. Rising digital workforce readiness, with ICT specialists forming 5% of EU employment, also supports sustained investment in advanced networking hardware.
Competitive Landscape
The network interface card (NIC) market is moderately fragmented, with a mix of established players and emerging manufacturers competing on pricing, performance, and innovation. Companies are increasingly investing in R&D to improve throughput, reduce latency, and enhance energy efficiency, while also differentiating their offerings through smart NICs, multi-gig capabilities, and security offload features. Manufacturers further strengthen their position by forming strategic partnerships with OEMs, cloud providers, and data center operators to secure long-term supply channels.
Key Industry Developments:
- In October 2025, Broadcom introduced Thor Ultra, the industry’s first 800G AI Ethernet NIC, designed to interconnect massive XPU clusters for trillion-parameter AI workloads using the open Ultra Ethernet Consortium (UEC) standard. The NIC brings advanced RDMA features such as packet-level multipathing, out-of-order delivery, selective retransmission, and programmable congestion control, enabling high-performance, scalable AI networking without reliance on proprietary ecosystems.
- In September 2025, Napatech launched the F3070X DPU, a 400G SmartNIC built on Altera Agilex FPGAs and Intel Xeon D processors, delivering ultra-low latency and high-performance acceleration for AI, cloud, and enterprise datacenters. The platform combines FPGA programmability with CPU processing to eliminate bottlenecks and enable real-time data acceleration.
Companies Covered in Network Interface Card (NIC) Market
- Intel Corporation
- Broadcom Inc
- Mellanox Technologies (NVIDIA)
- Marvell Technology Group
- Cisco Systems Inc.
- Realtek Semiconductor Corp
- Fujitsu Limited
- TP‑Link Technologies Co., Ltd.
- QNAP Systems, Inc.
- Chelsio Communications
- Silicom Ltd.
- Tehuti Networks
- Others
Frequently Asked Questions
The global network interface card (NIC) market is projected to be valued at US$6.3 Bn in 2026.
The rising need for high-speed, low-latency connectivity to support AI/ML workloads and data-intensive enterprise applications is a key driver of the market.
The market is expected to witness a CAGR of 8.9% from 2026 to 2033.
Growing adoption of smart/programmable NICs that enable offloading, security acceleration, and high-bandwidth workload optimization is creating strong growth opportunities.
Intel Corporation, Broadcom Inc., Mellanox Technologies (NVIDIA), Marvell Technology Group, Realtek Semiconductor Corp, and Fujitsu Limited are among the leading key players.


