


- Automotive
- India Used Car Market
India Used Car Market Size, Share, Trends, Growth, Regional Forecasts 2026 - 2033
India Used Car Market by Vehicle Type (Hatchbacks, Sedans, Sports Utility Vehicles), Vehicle Age (Less than 3 Years, 3 Years to 7 Years, Above 7 Years), Fuel Type (Petrol, Diesel, CNG, EVs/Hybrids), Brand (Maruti Suzuki, Hyundai, Tata Motors, Mahindra & Others), Sales Channel (Organized Dealers, Unorganized Dealers) and Regional Analysis for 2026 - 2033
India Used Car Market Share and Trends Analysis
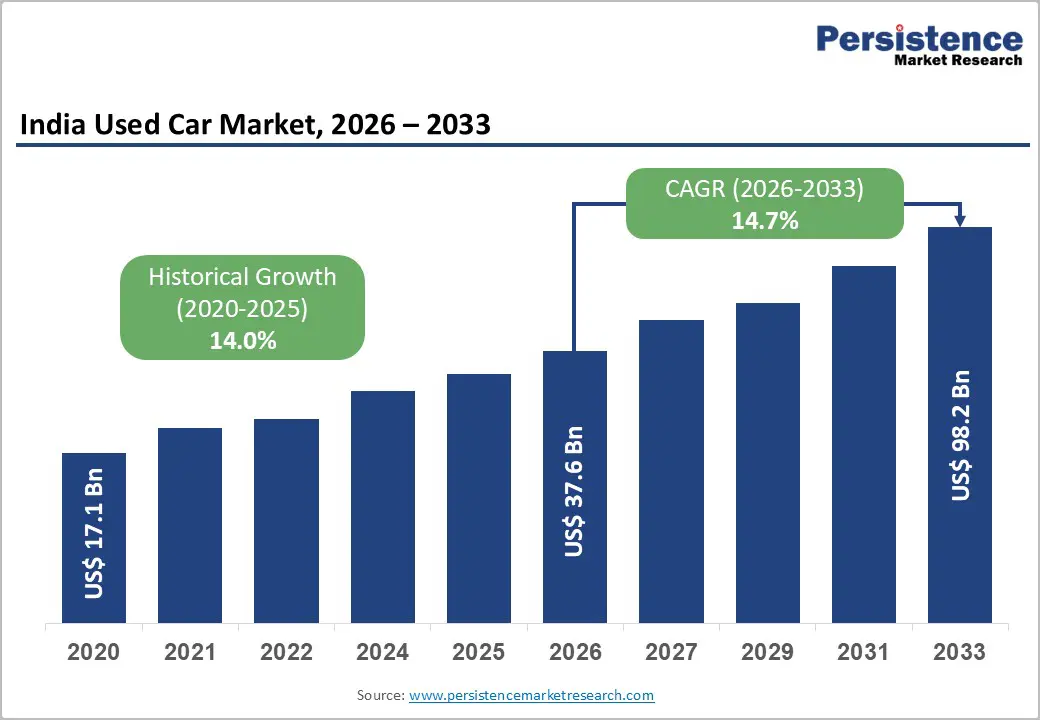
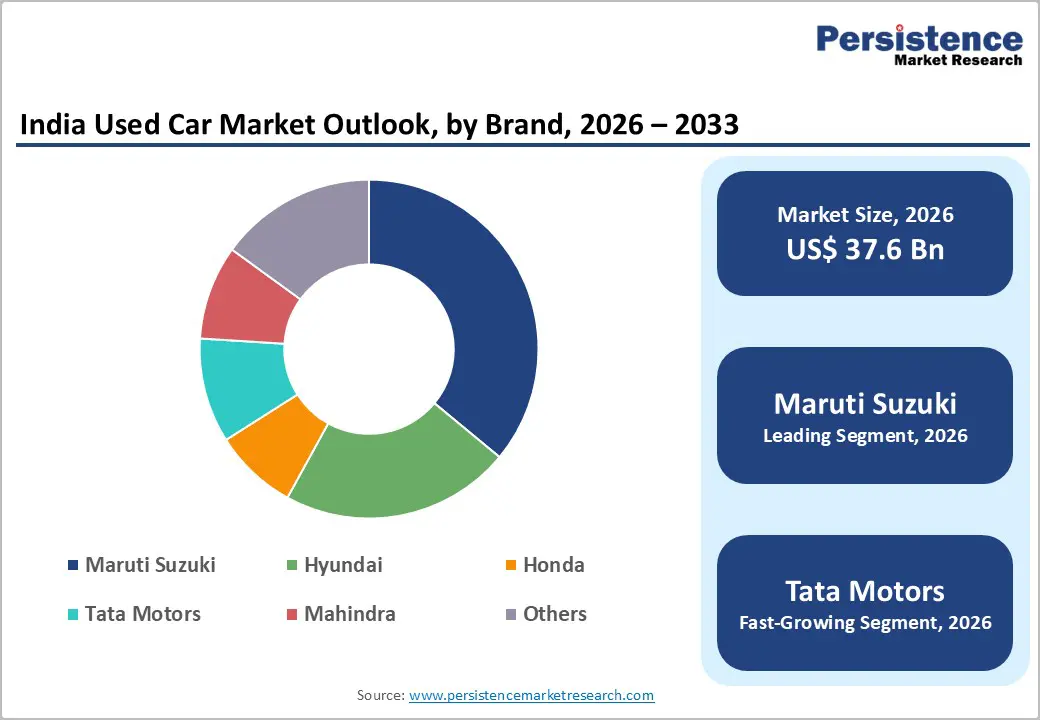
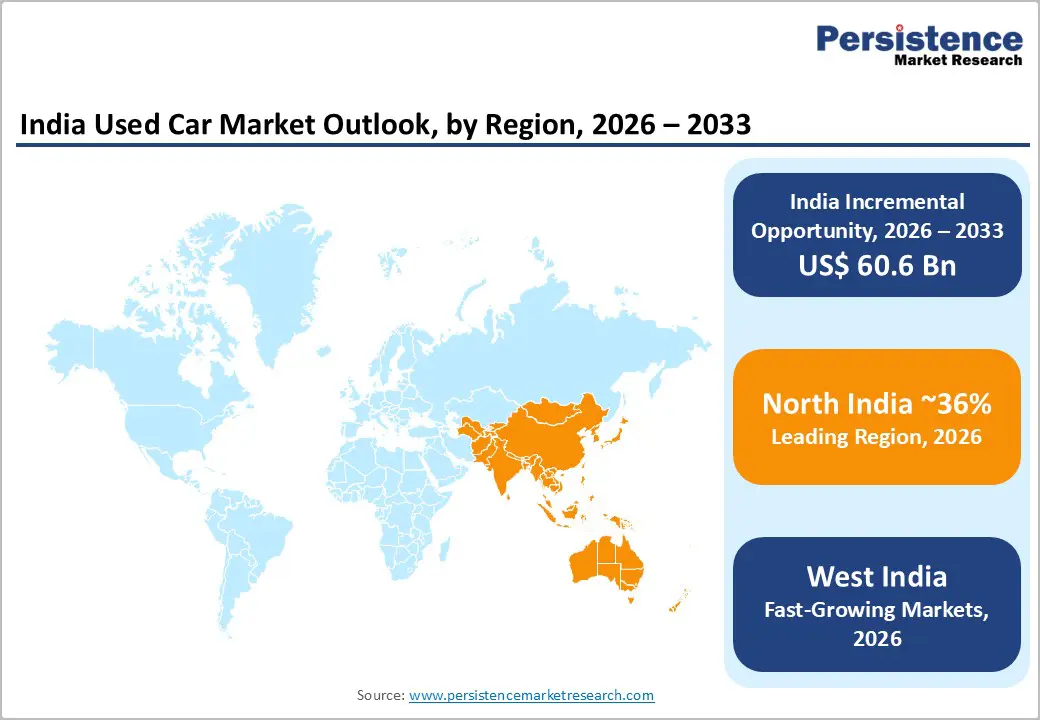
The India Used Car Market size is projected at US$37.6 billion in 2026 and is projected to reach US$98.2 billion by 2033, growing at a CAGR of about 14.7% between 2026 and 2033.
Robust demand is underpinned by rising middle-class incomes, greater financing penetration, and longer vehicle lifecycles, which expand available stock. Accelerated digitalization, including AI-enabled pricing and online platforms, is formalizing transactions and shifting share from informal brokers. Policy focus on scrappage, safety, and emissions is also nudging buyers toward younger, better-documented vehicles, supporting value migration to organized and certified channels.
Key Industry Highlights:
- Market volumes stood at roughly 5.9 million units in FY2024-25 and are expected to reach around 9.5 million units by 2030, growing at about 10% unit CAGR.
- Hatchbacks lead with around 46% share, while SUVs are the fastest-growing body type, with an approximate 16.7% CAGR, already exceeding 50% of used-car volumes in recent reports.
- The 3–7 year vehicle age band commands about 47% share, whereas sub-3-year vehicles are projected to grow at nearly 17.2% CAGR as upgrade cycles shorten and leasing gains traction.
- Petrol vehicles dominate with roughly 55% share, while EVs/hybrids are poised for about 21.7% CAGR, supported by a 76% jump in EV sales and an 83% rise in hybrid sales in 2025.
- North India holds ~36% market share, South India around 26%, while West India is projected to grow at about 15.3% CAGR, supported by strong urbanization and industrial bases.
- Unorganized C2C channels control nearly 62–70% of volumes, but organized and certified channels already represent roughly one-third of sales and are growing at a high-teens to 20%+ CAGR.
| Key Insights | Details |
|---|---|
|
India Used Car Market Size (2026E) |
US$ 37.6 billion |
|
Market Value Forecast (2033F) |
US$ 98.2 billion |
|
Projected Growth CAGR (2026-2033) |
14.7% |
|
Historical Market Growth (2020-2025) |
14.0% |
Market Dynamics Analysis
Drivers - Digital platforms, transparency, and certified pre-owned ecosystems
Digital platforms and OEM-backed certified programs are reshaping how Indians buy used cars, improving trust and liquidity. Online and app-based marketplaces now offer AI-driven pricing, comprehensive inspection reports, and instant financing approvals, addressing long-standing concerns about odometer tampering and hidden defects. According to recent sector studies, organized and online channels have reached roughly 30%+ of used-car sales by 2024–25, up sharply over the last five years, with online volumes growing at CAGR rates in the high teens to mid twenties. This formalization expands addressable demand among digitally savvy, younger consumers and incorporates documentation, warranties, and standardized processes.
Premiumization and SUV shift in the used car mix
The body-type mix in India’s used car market is undergoing rapid premiumization, anchored by SUVs and compact SUVs.Indian Blue Book data indicates that SUVs now account for more than 50% of used-car transactions, up from about 23% just four years ago, while average selling prices have risen by about 36% over the same period. This mirrors the new-car market, where SUVs and crossovers account for over 50% of passenger vehicle sales. As higher-priced new SUVs enter the parc and cycle into second ownership within 3–7 years, their high residual values and aspirational positioning drive both larger ticket sizes and stronger margins for organized dealers and financiers.
Restraints - Dominance of unorganized C2C channels and trust deficits
Despite rapid formalization, unorganized C2C and small-dealer channels still account for around 70–75% of used-car volumes, keeping the market fragmented and opaque. These channels often lack standardized inspection, documentation, and warranties, reinforcing buyer fears of hidden mechanical issues, accident histories, and title disputes. Limited recourse mechanisms and uneven enforcement of consumer-protection norms create perceived risk premia, particularly for higher-value SUVs and diesel models, constraining price realization and slowing the shift toward more transparent, high-value formats.
Regulatory and compliance complexity across states
The sector faces regulatory friction around registration transfer, taxation, and dealer licensing, which varies significantly by state. Dealers have flagged complexities in implementing GST rules on used vehicles and navigating state-wise registration norms under the Ministry of Road Transport and Highways (MoRTH), particularly for small players that fall below GST thresholds. These hurdles increase transaction time and cost, discourage formalization among micro-dealers, and can delay regional inventory movement, impacting working capital cycles and constraining scale-up of organized networks.
Opportunities - Acceleration of organized, certified, and omni-channel models
The shift from informal brokers to organized, certified ecosystems offers a large value-creation window. Indian Blue Book and leading OEM channel data suggest organized and certified formats could capture 40–45% of market value by 2030, up from roughly one-third today, implying incremental organized revenue pools in the tens of billions of dollars by early 2030s. Omni-channel journeys that blend online discovery, centralized inspections, and offline delivery hubs can unlock higher inventory turns, better pricing power, and ancillary income from financing, insurance, and service contracts.
Younger vehicle age, EVs/hybrids, and green policy tailwinds
Tightening emission and scrappage norms, alongside rising new-vehicle prices, are pushing demand toward younger used cars (sub-7 years) and more efficient powertrains. India’s hybrid vehicle market alone is projected to grow at about 26% CAGR during 2025–2033, while electric cars recorded a 76% year-on-year sales surge in 2025, indicating a strong future pipeline of EV and hybrid models entering the used market in the next 3–7 years. Even if EVs/hybrids represent a single-digit share of used volumes by 2030, they can command significant price and margin premiums, creating a differentiated opportunity for early-adopting organized players.
Category-wise Analysis
Vehicle Type Insights
Hatchbacks remain the leading segment, accounting for about 46% of India’s used car market in 2026, supported by their affordability, compact footprint, and strong presence in the entry and lower-mid segments. High parc penetration of models from Maruti Suzuki and Hyundai ensures ample supply, while lower running and maintenance costs keep residual values resilient in price-sensitive urban and semi-urban clusters. Although SUVs have grown strongly, hatchbacks still dominate volumes, especially among first-time buyers and households upgrading from two-wheelers.
The fastest-growing vehicle type is SUVs, projected to clock around 16.7% CAGR between 2026 and 2033, as aspirational consumers shift toward higher ground-clearance, safety, and feature-rich models. As SUVs already command over 50% of used-car value in some recent studies, their share is expected to rise further as new-car sales continue to premiumize and a steady stream of 3–7-year-old compact SUVs enters the pre-owned market.
Vehicle Age Insights
Vehicles aged 3 to 7 years lead the market with around 47% share, reflecting the sweet spot between affordability and remaining useful life. This cohort typically includes first-owner cars with documented service histories, benefiting from improved reliability and safety features introduced over the last decade. OEM warranty expiries and upgrade cycles in this age band release a steady supply, offering organized and semi-organized players a robust pipeline of vehicles for certification and financing-linked propositions.
The fastest-growing band is “Less than 3 Years”, expanding at an estimated 17.2% CAGR during 2026–2033, helped by faster upgrade cycles in metros, fleet refreshes, and early lease returns. Higher new-car prices and aggressive OEM discounting on new launches also create arbitrage opportunities that make nearly-new used cars attractive to value-seeking households and small businesses.
Fuel Type Insights
Petrol vehicles form the leading fuel segment with about 55% share of used-car transactions, underpinned by their dominance in new-car sales over the past decade and lower perceived regulatory risk compared with diesel. Petrol engines are seen as smoother and easier to maintain in city conditions, and BS-VI norms have improved fuel efficiency and emission performance, supporting better residual values. This entrenched parc base ensures continued depth in petrol-powered hatchbacks and compact SUVs across both metro and non-metro used-car markets.
The fastest-growing fuel segment is EVs/Hybrids, forecast to grow at roughly 21.7% CAGR over 2026–2033 from a low base, benefitting from strong policy support and rapid growth in new-vehicle sales. As OEMs expand hybrid and EV portfolios and total-cost-of-ownership advantages become clearer, a rising volume of 3–6 year-old green vehicles will enter the used market, creating premium, tech-oriented sub-segments in major urban centers.
Brand Insights
Maruti Suzuki is the leading brand in India’s used-car market, with an estimated 36% share, reflecting its dominant new-car parc, extensive service network, and strong brand trust in reliability and cost of ownership. Its True Value division alone has sold over 6 million pre-owned cars since 2001, with nearly 4.9 lakh units retailed in FY2024-25, underscoring its scale in organized certified channels. High liquidity and strong resale values of popular hatchbacks and compact SUVs further consolidate Maruti’s leadership in the used ecosystem.
Tata Motors is the fastest-growing brand, with its used-car presence estimated to be expanding at about 17.4% CAGR over 2026–2033, driven by its rising share in new-age SUVs and EVs. Strong safety ratings, competitive EV offerings, and improving after-sales perception are boosting demand for Tata models in the 3–7 year bracket, particularly in urban markets where safety and technology are prioritized.
Sales Channel Insights
Unorganized dealers and C2C channels currently dominate the used-car market, accounting for roughly 62% of India’s used-car market, including local brokers, standalone used-car lots, and direct consumer-to-consumer transactions. Their strength lies in hyperlocal reach, flexible negotiation, and lower overheads, particularly in Tier-2/3 cities and rural areas where organized networks are still sparse. However, lack of standardized inspections, warranties, and digital records limits price transparency and constrains their ability to capture higher-value segments.
Organized dealers (OEM-backed and independent) are the fastest-growing channel, projected to expand at about 19.7% CAGR during 2026–2033, as consumers increasingly prioritize trust, certification, and financing options. Studies suggest organized and certified channels may already account for roughly one-third of value share, and continued investments in omni-channel experiences, AI-driven pricing, and extended warranty programs are expected to accelerate their share gains.
Regional Market Insights
North India Used Car Market Share and Trends Analysis
North India accounted for about 36% of the Indian used-car market in 2026, supported by high vehicle parc density in Delhi.NCR, Haryana, Punjab, and Uttar Pradesh. Strong income levels, corporate and government fleets, and early adoption of leasing models feed a consistent supply of 3–7-year-old vehicles into organized and semi-organized channels. Regulatory push on scrappage, diesel restrictions, and congestion measures in Delhi-NCR is accelerating replacement cycles and nudging buyers toward younger, compliant vehicles, reinforcing share dominance.
North India is likely to maintain leadership through 2033, with growth underpinned by continued urbanization, higher SUV penetration, and rapid expansion of certified networks in NCR and state capitals. However, stricter emission and congestion norms could gradually shift some demand and inventory sourcing to neighboring states, prompting dealers to adopt cross-border sourcing and logistics optimization strategies.
West India Used Car Market Trends and Insights
Is West India emerging as one of the fastest-growing regions, with the market estimated to expand at a CAGR of around 15.3% during 2026–2033, on the back of strong economic activity in Maharashtra and Gujarat. High motorization rates in Mumbai, Pune, Ahmedabad, and Surat, combined with vibrant SME and services sectors, generate robust demand for both hatchbacks and compact SUVs in the used segment. Progressive state-level policies on EVs, better road infrastructure, and deepening financing penetration further support sustained double-digit value growth.
Regulatory harmonization across Western states, especially in registration procedures and EV incentives, is expected to streamline interstate vehicle movement and inventory balancing for organized players. This, coupled with OEM and platform investments in refurbished hubs and remarketing centers, positions West India as a key profit pool for premium used SUVs and emerging EV/hybrid portfolios.
South India Used Car Market Trends and Insights
South India accounts for about 26% of the Indian used-car market in 2026 and is growing at approximately 14.9% CAGR, driven by strong automotive manufacturing clusters and technology-driven urban economies in Karnataka, Tamil Nadu, and Telangana. High literacy, early adoption of digital platforms, and a large base of salaried professionals and IT employees support demand for younger, feature-rich vehicles with documented histories. The presence of major OEM plants also fosters an active ecosystem of company-leased cars and fleet renewals feeding into organized used-car channels.
South India’s growth dynamics are likely to be reinforced by rising EV and hybrid penetration in metros like Bengaluru, Chennai, and Hyderabad, creating early secondary markets for green vehicles. Manufacturing advantages and logistics connectivity also enable the region to act as a sourcing and refurbishment base for multi-state used-car networks, supporting inventory standardization and cost efficiencies through 2033.
Competitive Landscape
Market leaders in India’s used car space increasingly pursue innovation-driven, omni-channel expansion strategies, combining certified inspection processes, AI-enabled dynamic pricing, and integrated financing to differentiate on trust and convenience rather than price alone. Key themes include scaling nationwide refurbishment hubs, deepening presence in non-metro markets, and building ecosystem partnerships with banks, insurers, and OEMs to capture lifetime value across sourcing, remarketing, and after-sales touchpoints.
Strategic Developments:
- In January 2025, Toyota Kirloskar Motor launched Toyota Mobility Solutions and Services, introducing a nationwide certified pre-owned vehicle initiative featuring a 203-point inspection program, refurbishment with genuine parts, and standardized pricing, strengthening consumer trust and expanding organized used-car supply across metros and Tier-2 cities.
- In FY2024–25, Maruti Suzuki True Value: Achieves 4.92 lakh pre-owned car sales in a single fiscal year, surpassing 60 lakh cumulative sales since 2001, reinforcing leadership in certified used-car retail and strengthening Maruti Suzuki’s residual-value advantage within India’s rapidly expanding organized pre-owned vehicle ecosystem.
Companies Covered in India Used Car Market
- Maruti Suzuki True Value
- Mahindra First Choice Wheels
- Cars24
- Spinny
- CarDekho / Gaadi
- CarTrade Group
- Hyundai H Promise
- Toyota U-Trust / Toyota Certified Used Cars
- Volkswagen Certified Pre-Owned
- Tata Motors Certified / Tata Motors Assured
- Honda Auto Terrace
- Droom
- OLX Autos
Frequently Asked Questions
The India used car market is estimated at about US$37.6 Bn in 2026, with volumes of nearly 6 million units, and is projected to reach around US$98.2 Bn by 2033.
Market growth is primarily driven by rising motorization, value‑conscious first‑time buyers, digital and certified ecosystems that enhance trust, and premiumization toward SUVs and younger, better‑documented vehicles.
Between 2026 and 2033, the India used car market is expected to grow at approximately 14.7% CAGR in value.
Major opportunities lie in scaling organized and certified omni‑channel models, expanding into non‑metro regions, and building early leadership in younger‑age, EV/hybrid, and premium SUV used‑car segments.
Key players include Maruti Suzuki True Value, Mahindra First Choice Wheels, Cars24, Spinny, CarDekho/Gaadi, OEM‑certified programs from Hyundai, Toyota, Volkswagen, Tata Motors, and digital platforms such as Droom.


