


- Smart Packaging
- Cut and Stack Labels Market
Cut and Stack Labels Market Size, Share, and Growth Forecast, 2026 - 2033
Cut and Stack Labels Market by Form (Roll Stock, Sheets, Others), Material Type (Paper, Films/Plastic, Others), End-user, Promotional Type, and Regional Analysis for 2026 - 2033
Cut and Stack Labels Market Size and Trends Analysis
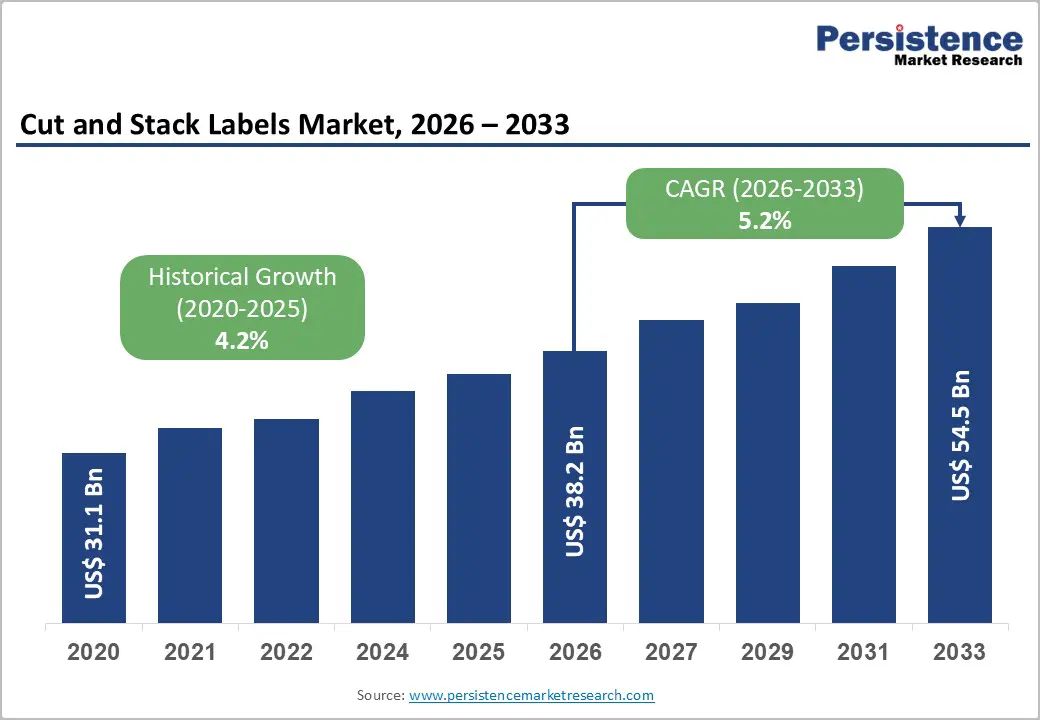
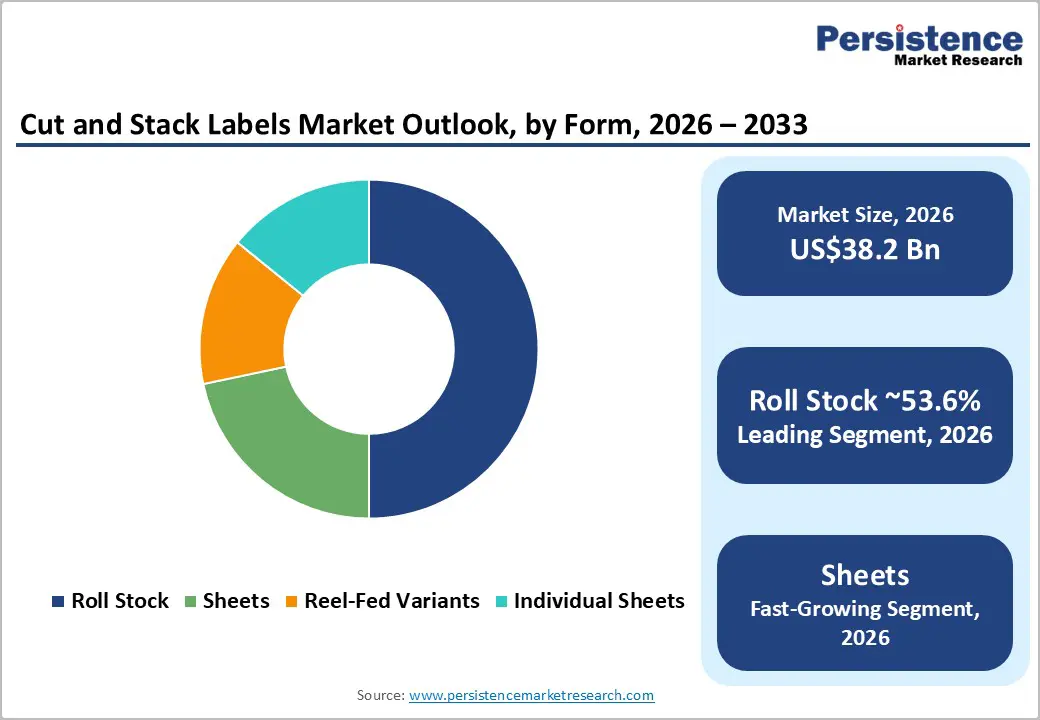
The global cut and stack labels market size is likely to be valued at US$38.2 billion in 2026 and is expected to reach US$ 54.5 billion by 2033, growing at a CAGR of 5.2% between 2026 and 2033, driven by sustained demand from food & beverage and home & personal care sectors, rising premiumization and branding investments, and increasing adoption of digital printing for short-run and customized applications.
Sustainability mandates and interactive label formats, such as peel-and-reveal and digitally personalized labels, are reshaping product mix and unit value. Raw material cost volatility, regulatory compliance requirements, and converter consolidation will also influence competitive positioning and margin structures through 2033.
Key Industry Highlights:
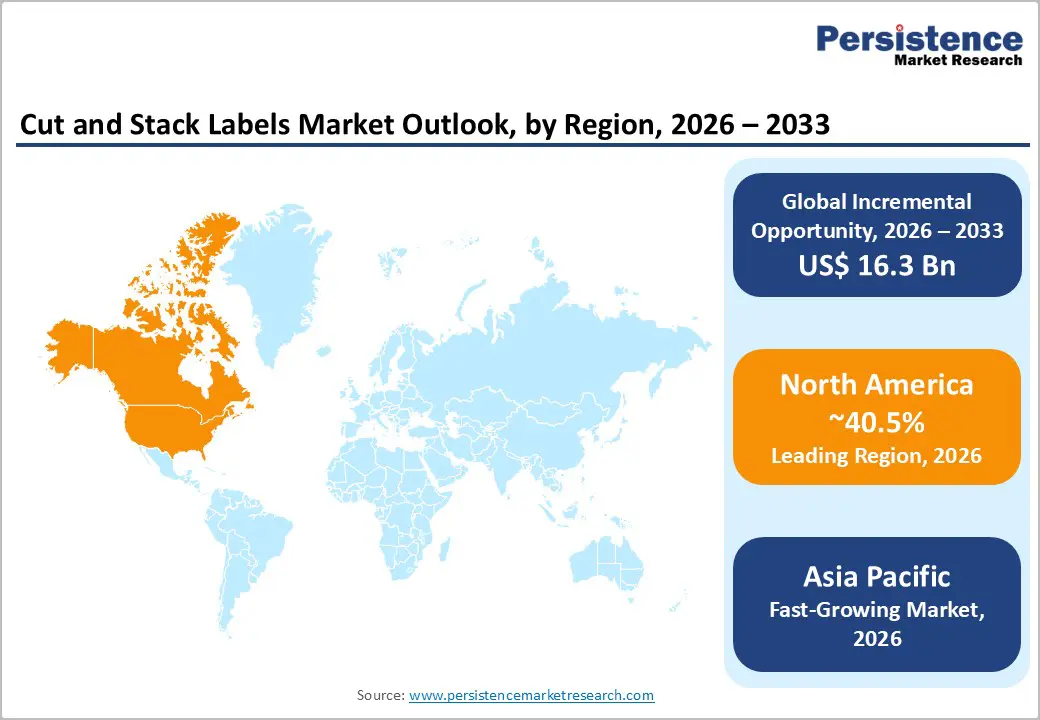
- Leading Region: North America is projected to account for over 40.5% of the market, supported by strong beverage and packaged food production volumes, advanced automation infrastructure, and regulatory-driven demand for compliant labeling solutions.
- Fastest-Growing Region: Asia Pacific is the fastest-growing region, driven by rapid urbanization, rising disposable incomes, and large-scale manufacturing capacity.
- Investment Plans: Capital allocation is concentrated in digital and hybrid press installations, smart-label technologies (including RFID), workflow automation, and sustainability-certified substrate development to capture higher-margin personalization and compliance-driven opportunities.
- Dominant Form: Roll stock is expected to account for 53.6% of the market, maintaining its leadership position due to its compatibility with high-speed beverage and food production lines.
- Leading Material Type: Paper is estimated to hold approximately 53.9% market share, supported by cost efficiency, print performance, and established recycling infrastructure across North America and Europe.
| Key Insights | Details |
|---|---|
| Cut and Stack Labels Market Size (2026E) | US$38.2 Bn |
| Market Value Forecast (2033F) | US$54.5 Bn |
| Projected Growth (CAGR 2026 to 2033) | 5.2% |
| Historical Market Growth (CAGR 2020 to 2025) | 4.2% |
Market Factors - Growth, Barriers, and Opportunity Analysis
Growth Analysis - Strong Demand from Food & Beverage and Consumer Packaged Goods (CPG) Verticals
Rising global consumption of packaged food and beverages continues to underpin demand for cut-and-stack labels. Brand owners are expanding product portfolios, introducing frequent line extensions, and increasing promotional activity, all of which require high-volume, cost-efficient labeling solutions. Food & beverage remains the largest end-user segment for cut-and-stack labels, primarily due to their compatibility with wet-glue systems and high-speed application lines used in beverage bottling and food processing facilities. These labels are particularly well suited for carbonated drinks, canned foods, dairy products, and other mass-market packaged goods where consistency, throughput, and unit economics are critical. Long-term procurement contracts and recurring production cycles among major CPG companies provide label converters with stable, repeat demand. However, maintaining profitability depends on disciplined raw material sourcing, operational efficiency, and effective pricing negotiations with brand owners.
Technology Shift toward Digital Printing and Personalization
The label industry is undergoing a gradual shift toward digital and hybrid printing technologies, driven by demand for flexibility and faster time-to-market. Inkjet and toner-based systems enable shorter production runs, variable data printing, and rapid design changes, making them increasingly attractive for promotional campaigns, regional launches, and niche product variants. Digital workflows also reduce setup times and material waste, improving responsiveness to customer requirements. As personalization and limited-edition packaging gain traction, converters with digital capabilities are better positioned to capture higher-margin orders and serve premium brand segments. Investment in hybrid presses, automation, and integrated workflow software is therefore becoming a strategic priority. These capabilities enable converters to balance high-volume traditional production with agile, value-added digital offerings, thereby strengthening their long-term competitiveness.
Sustainability and Regulatory Pressure Driving Substrate Innovation
Environmental regulations and retailer sustainability commitments are reshaping material selection across the labeling value chain. Brand owners increasingly prioritize recyclable substrates, water-based adhesives, and solutions that align with circular economy principles. Paper continues to dominate due to its cost efficiency, print performance, and established recycling infrastructure. Film and synthetic materials are also gaining adoption in applications requiring moisture resistance, durability, or enhanced shelf appeal. This dynamic is creating a two-tier market structure: high-volume, standardized paper labels on one side and premium, certified-sustainable constructions on the other. Converters with transparent supply chains, recyclability validation, and sustainability certifications are gaining preference in competitive tenders, particularly among multinational CPG brands.
Barrier Analysis -Raw Material Price Volatility and Adhesive Supply Constraints
Label production is highly sensitive to fluctuations in paper pulp, polymer resins, and adhesive inputs. Volatile raw material pricing can quickly erode margins, especially when supply contracts with brand owners limit the ability to pass through cost increases. Large converters often manage this risk through long-term sourcing agreements and diversified supplier bases. Smaller and mid-sized players face greater exposure, which can constrain investment capacity and delay upgrades to digital or automated production systems.
Competitive Pressure from Alternative Label Formats
Cut-and-stack labels face increasing competition from pressure-sensitive labels, shrink sleeves, and in-mold labeling technologies. These alternatives offer design flexibility, full-container coverage, and strong visual differentiation, making them attractive for premium and specialty applications. Ongoing consolidation within the labeling industry further intensifies competition, as large multi-format converters can offer bundled solutions, global coverage, and advanced compliance support. Smaller converters often struggle to match these capabilities due to higher capital requirements and limited scale.
Opportunity Analysis - Digital Personalization and Interactive Label Formats
Interactive and digitally enabled labels are gaining importance as brands seek deeper consumer engagement and improved traceability. QR codes, augmented reality features, and peel-and-reveal formats support marketing campaigns, regulatory disclosures, and product authentication. Converters that invest in workflow automation, variable data printing, and real-time proofing can deliver faster turnaround times and customized solutions. These capabilities are particularly valuable in personal care, beverages, and promotional packaging, where differentiation and speed are critical.
Sustainable and Recyclable Label Systems
Retailer mandates and extended producer responsibility frameworks are accelerating demand for environmentally compliant labeling solutions. Even incremental shifts toward certified sustainable labels represent meaningful value creation opportunities for converters. The growing adoption of recyclable paper labels, biodegradable adhesives, and mono-material constructions is particularly pronounced in North America and Europe. Companies that can demonstrate recycling compatibility, regulatory compliance, and third-party certification are more likely to secure long-term supply agreements with global brand owners.
Category-wise Analysis
Form Insights
Roll stock is expected to maintain its dominant position in the form segment, accounting for 53.6% of the market in 2026. Its dominance stems from seamless compatibility with high-speed automated labeling systems used in beverage bottling plants, dairy processing facilities, and large-scale packaged food operations. Wet-glue cut-and-stack labels supplied in roll format enable continuous application with minimal downtime, which is critical for carbonated soft drinks, bottled water, canned vegetables, and beer packaging lines operating at thousands of units per minute. The format’s structural advantage lies in operational efficiency. Investments in automated splicing systems, high-capacity unwind units, and precision die-cutting presses allow converters to optimize throughput while minimizing waste. Major beverage companies such as Coca-Cola and PepsiCo rely heavily on roll-fed cut-and-stack formats for standardized SKUs where cost per thousand labels remains a primary procurement metric. As long as high-volume production environments dominate the food and beverage landscape, roll stock will continue to generate the largest share of global revenue in this segment.
Sheets represent the fastest-growing form category, driven by increasing demand for shorter production runs, regional customization, and premium packaging differentiation. The rise of direct-to-consumer brands, craft beverage producers, and limited-edition product launches has increased demand for flexible production formats that do not require the scale efficiencies of continuous-roll operations. Digital sheet-fed presses enable rapid artwork changes, variable data printing, and small-batch production without extensive setup time. For example, regional promotional campaigns for flavored beverages or seasonal snack packaging often utilize sheet-based cut-and-stack labels to accommodate SKU variation. Craft breweries and specialty food brands also favor sheet-fed formats to manage inventory risk while maintaining design flexibility. Converters adopting hybrid production environments that combine conventional offset or flexographic roll production with digital sheet-fed capabilities can achieve higher average revenue per order and serve premium, customization-driven clients more effectively.
Material Type Insights
The paper segment is projected to account for 53.9% of the market share in 2026. Its leadership position is reinforced by affordability, excellent print clarity, and compatibility with established recycling systems. In food and beverage applications, such as canned goods, bottled beverages, and processed foods, paper-based cut-and-stack labels offer reliable adhesion, strong ink performance, and cost efficiency at scale. Coated and wet-strength papers are widely used in carbonated beverage and beer packaging, where exposure to condensation requires moderate moisture resistance. Major packaging supply chains in North America and Europe favor paper substrates due to mature recycling infrastructure and alignment with retailer sustainability commitments. As regulatory scrutiny around packaging waste intensifies, paper’s established recyclability credentials and lower environmental impact relative to certain plastics help sustain its dominant market position. Paper’s performance-to-cost ratio ensures its continued relevance in high-volume production environments, particularly where procurement teams prioritize predictable pricing and material availability.
Films and synthetic materials, including biaxially oriented polypropylene (BOPP) and polyethylene terephthalate (PET), are projected to be the fastest-growing material segment. Growth is driven by increasing demand for durability, moisture resistance, and premium aesthetics in categories such as cosmetics, personal care, chilled beverages, and household cleaning products. Film substrates maintain structural integrity in high-humidity or refrigerated conditions, making them suitable for yogurt containers, ready-to-drink beverages, and personal care bottles stored in bathrooms or humid climates. Premium skincare brands, for instance, often select clear or metallic film labels to achieve a “no-label look” or enhanced shelf appeal. Although films incur higher material costs than paper, they enable advanced finishes, such as metallization, embossing, and transparent effects, that support premium brand positioning. This functional and visual differentiation allows converters to command higher margins when serving clients in cosmetics, specialty beverages, and high-end consumer goods. As branding sophistication increases and packaging performance requirements evolve, films and synthetic materials are expected to capture incremental share within the material type category.
Regional Insights
North America Cut and Stack Labels Market Trends - High-Speed Beverage Labeling, Regulatory Oversight, and Market Consolidation
North America is expected to lead, holding over 40.5% of the market share in 2026, with the U.S. driving this dominance. The U.S. benefits from a robust consumer packaged goods (CPG) sector, advanced packaging infrastructure, and stringent regulatory frameworks. Key industries, such as beverages, food processing, and household goods, rely on cost-efficient, wet-glue cut-and-stack labeling systems. Major beverage companies such as The Coca-Cola Company, PepsiCo, Anheuser-Busch, and Molson Coors continue to drive high-volume label demand, especially for cans and glass bottles in the beer, craft beverage, and ready-to-drink segments.
Regulatory factors, particularly from the U.S. Food and Drug Administration (FDA) and the Federal Trade Commission (FTC), shape the market. Strict ingredient disclosure and nutritional labeling standards, along with heightened scrutiny of recyclability claims, are pushing suppliers to offer certified recyclable materials and transparent sourcing. Retail giants such as Walmart and Kroger, focused on sustainability, increasingly prefer vendors with verifiable eco-friendly practices.
The market is also witnessing increased investment in digital transformation and consolidation. Major manufacturers such as CCL Industries and Multi-Color Corporation are expanding digital printing capabilities and automation to meet the demand for short-run customization and promotional packaging. Strategic acquisitions have enabled these companies to offer integrated solutions, combining cut-and-stack, pressure-sensitive, and shrink-sleeve labels under a single agreement. This consolidation strengthens supply chain resilience but raises competitive pressure on smaller regional converters.
Europe Cut and Stack Labels Market Trends - Sustainability Mandates, Premium Branding, and Decorative Innovation
Europe's cut-and-stack labels market is shaped by regulatory harmonization, sustainability mandates, and a strong premium-brand culture. The European Union's packaging and waste directives, alongside extended producer responsibility (EPR) frameworks, are driving changes in packaging materials and labeling strategies. Germany, with its well-developed food and beverage sector, remains the region's industrial core. German sustainability regulations, emphasizing recyclable paper substrates and mono-material packaging, are fueling innovation among local converters.
The U.K. is seeing growth in premium beverages and personal care products. The rise of craft gin, specialty beer, and boutique cosmetics has boosted demand for decorative finishes and limited-edition label runs. Major brands such as Diageo are expanding their premium portfolios, which emphasize visual differentiation and traceability features, further driving demand for high-quality printing and specialty coatings.
France and Spain, known for their wine and specialty food industries, contribute significantly to demand for decorative and peel-and-reveal labels, particularly for export packaging. Sustainability remains a key driver, with EU regulations accelerating the shift towards recyclable paper labels, wash-off adhesives, and reduced plastic use. Converters are investing in certified fiber sourcing and recyclability validation to meet retailer sustainability standards. Large packaging groups are expanding digital printing capabilities to support localized marketing initiatives, particularly in cosmetics and premium beverages, enhancing customization for seasonal campaigns.
Asia Pacific Cut and Stack Labels Market Trends - Volume Manufacturing, Urban Consumption Growth, and Cost-Efficient Expansion
Asia Pacific is expected to be the fastest-growing region, driven by rapid urbanization, rising disposable incomes, and robust manufacturing capacity. The region benefits from strong domestic consumption growth and its pivotal role as a global production hub for consumer packaged goods. China remains the largest manufacturing center, with its extensive beverage, processed food, and household product industries creating significant demand for high-volume labeling solutions. Major multinational brands such as Nestlé and Coca-Cola rely on cost-efficient cut-and-stack labels for mass-market distribution in the country. China's evolving environmental regulations, including plastic-reduction initiatives, are also driving the gradual adoption of recyclable paper-based labeling formats.
India and Southeast Asia, including Indonesia, Vietnam, and Thailand, are experiencing rising packaged food and beverage consumption, fueled by expanding urban populations. As a result, regional beverage companies and global FMCG firms are investing in automated packaging lines, boosting demand for standardized labeling formats. India's growing dairy and bottled beverage sectors, for example, are increasingly adopting high-speed labeling systems that favor cut-and-stack production.
Japan drives demand for high-value applications, particularly in cosmetics and specialty foods. Premium skincare and functional beverage brands require superior print quality and precision, integrating specialty finishes and durable film substrates. Southeast Asia benefits from cost competitiveness, attracting foreign investment in packaging facilities due to lower labor costs and localized raw material sourcing. With infrastructure improvements, expanding logistics networks, and a rising middle class, Asia Pacific is positioned as a long-term growth engine in the global cut-and-stack labels market. Digital printing adoption is accelerating, particularly in Japan and South Korea, further enhancing market potential.
Competitive Landscape
The global cut-and-stack labels market is moderately consolidated, characterized by the presence of a limited number of global players with substantial revenue share alongside a broad base of regional and local converters serving niche or geography-specific demand. Large multinational converters benefit from established relationships with global brand owners and beverage producers, while smaller players tend to focus on localized food, beverage, and consumer goods customers where proximity, responsiveness, and cost competitiveness matter most.
Competitive positioning within the market is primarily influenced by geographic footprint, digital printing capability, sustainability compliance, and the ability to provide integrated finishing and logistics services. Companies with multi-regional manufacturing networks are better positioned to serve multinational CPG clients seeking consistent quality, regulatory compliance, and supply continuity across markets. Scale advantages allow larger firms to amortize capital investments in high-speed presses, digital platforms, and automation, enabling them to compete more effectively on both price and service reliability. In contrast, smaller converters face increasing pressure to specialize or partner with larger groups to remain competitive.
Key Industry Developments:
- In March 2025, UPM Adhesive Materials launched its Carbon Action Plastic Labels Portfolio and began expanding production in North America and Malaysia to scale sustainable label materials with a reduced carbon footprint.
Companies Covered in Cut and Stack Labels Market
- CCL Industries
- Multi-Color Corporation
- Fort Dearborn Company
- Resource Label Group
- Smyth Companies
- Hammer Packaging
- Inland Packaging
- Anchor Printing
- Walle Corporation
- Epsen Hillmer Graphics Co.
- WS Packaging Group
- Precision Press
- Labels West
- Traco Manufacturing
- Constantia Flexibles
- UPM Raflatac
- Fuji Seal International
- Huhtamaki Group
Frequently Asked Questions
The global cut and stack labels market size is valued at US$38.2 billion in 2026.
By 2033, the cut and stack labels market is expected to reach US$54.5 billion.
Key trends include increasing use of recyclable paper substrates, rising adoption of digital and hybrid printing for personalization, growing demand for interactive formats such as peel-and-reveal labels, and ongoing converter consolidation to achieve scale, efficiency, and compliance.
Roll stock is the leading form segment, accounting for 53.6% of market share, due to its compatibility with high-speed automated labeling lines in beverage and packaged food applications.
The cut and stack labels market is projected to grow at a CAGR of 5.2% between 2026 and 2033.
Major players include CCL Industries, Multi-Color Corporation (MCC), Fort Dearborn Company, Resource Label Group, and Smyth Companies.


