


- Technology
- Connected Homes Market
Connected Homes Market Size, Share, and Growth Forecast 2026 – 2033
Connected Homes Market by Component (Hardware, Software & Platforms, Services), by Connectivity Technology (Wi-Fi, Bluetooth/BLE, Zigbee, Z-Wave, Cellular (4G/5G), Thread, NFC, LPWAN), by Application (Home Automation, Security & Surveillance, Energy Management, Entertainment & Convenience, Health & Wellness), by End User (Residential, Commercial), by Regional Analysis, 2026-2033
Connected Homes Market Size and Trend Analysis
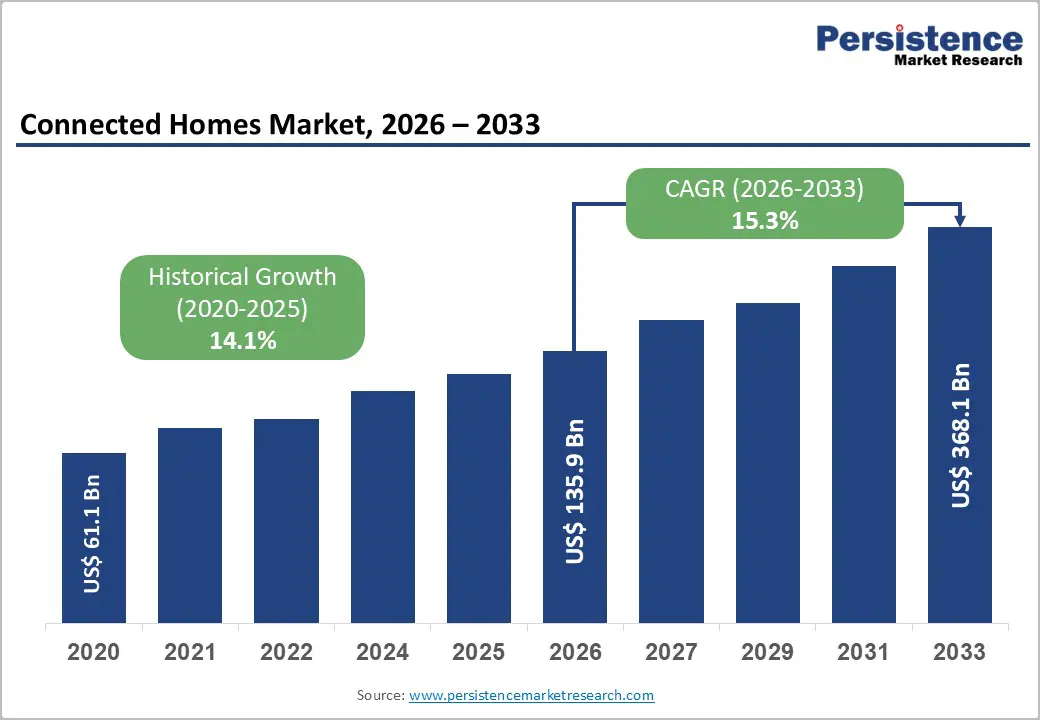
The global Connected Homes Market size is likely to be valued at US$ 135.9 Billion in 2026 and is expected to reach US$ 368.1 Billion by 2033, growing at a CAGR of 15.3% during the forecast period from 2026 and 2033. The connected homes market experiences robust growth driven by surging demand for intelligent home automation, enhanced security solutions, and energy-efficient living environments. This expansion stems from widespread adoption of IoT technologies, government-backed smart city initiatives, and rising consumer incomes enabling premium smart home investments.
Key Market Highlights
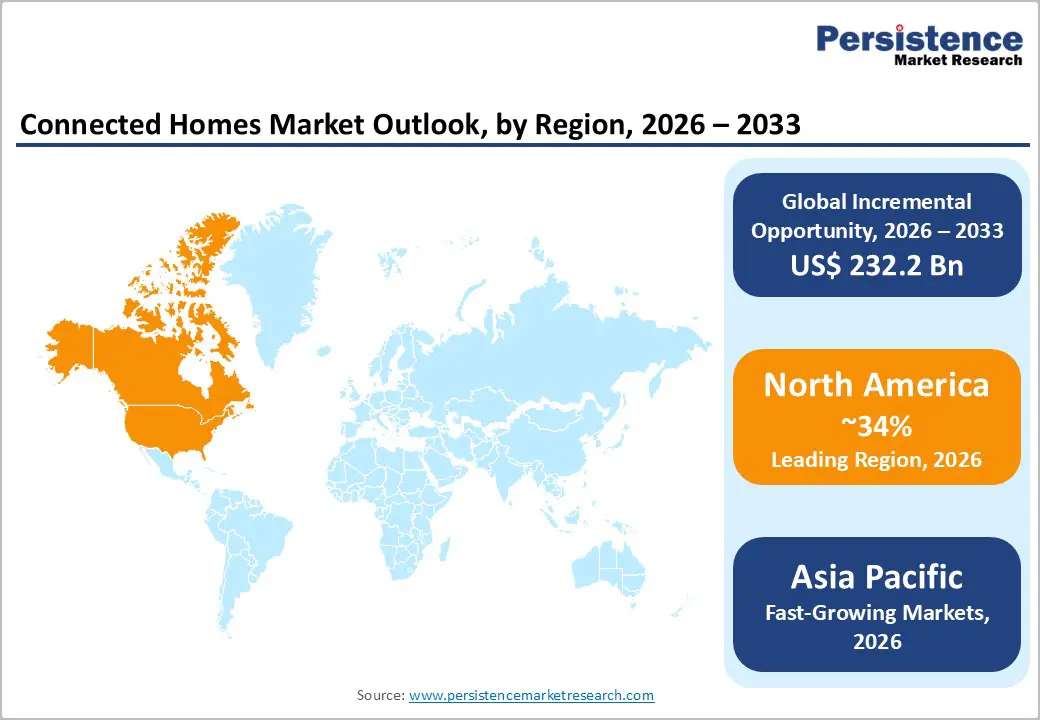
- North America leads with 34% global share driven by telco dominance, IRA incentives, and Matter innovation ecosystem (U.S. leadership).
- Asia-Pacific fastest-growing at 24% CAGR propelled by China scale, India urbanization, ASEAN manufacturing (smart city acceleration).
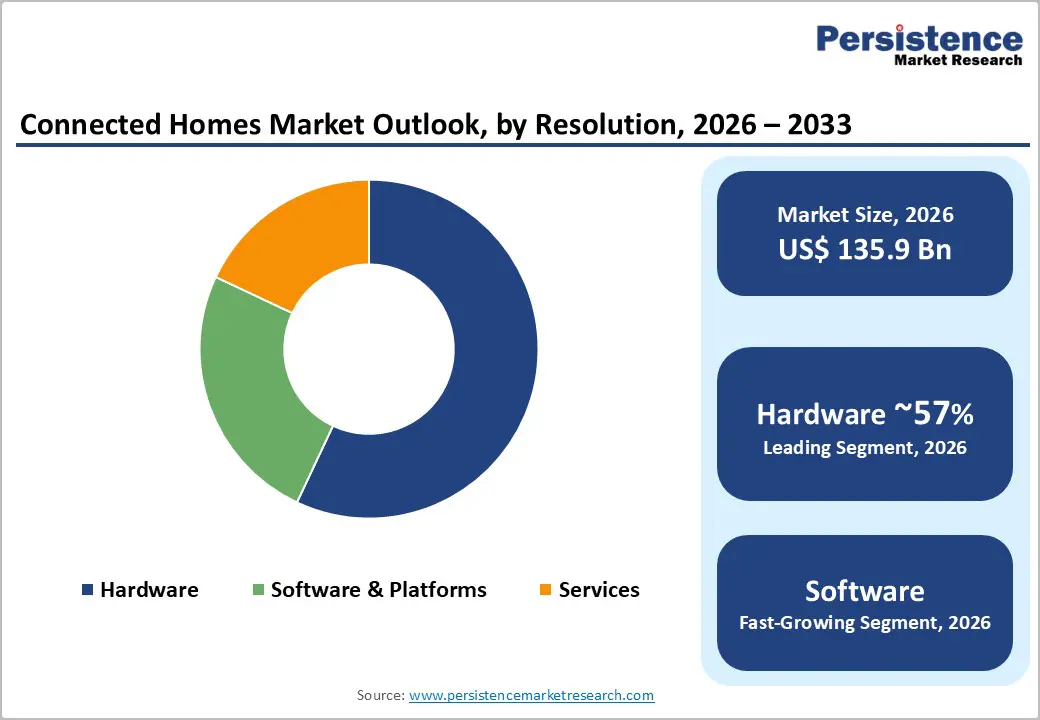
- Hardware dominates components at 57% share providing essential sensors, controllers, connectivity (foundational infrastructure).
- Energy management fastest application growing 12% CAGR via regulatory mandates, cost savings (sustainability imperative).
- Matter interoperability key opportunity eliminating silos, enabling $50B addressable vendor-neutral ecosystems (standardization revolution) .
| Key Insights | Details |
|---|---|
| Connected Homes Market Size (2026E) | US$ 135.9 Billion |
| Market Value Forecast (2033F) | US$ 368.1 Billion |
| Projected Growth CAGR (2026-2033) | 15.3% |
| Historical Market Growth (2020-2025) | 14.1% |
Market Dynamics
Market Growth Drivers
Proliferation of IoT-Enabled Smart Devices
Exponential growth in IoT device deployments fundamentally transforms residential living by enabling interconnected ecosystems that deliver unprecedented convenience, security, and efficiency. Connected IoT devices surpassed 18 billion units globally in 2024, with smart home applications representing the fastest-growing category according to IoT Analytics. This proliferation drives market expansion through seamless integration of lighting, climate control, security, and entertainment systems controllable via unified mobile interfaces or voice commands.
Consumer preference for multi-functional devices combining sensing, processing, and connectivity capabilities accelerates adoption, while falling component costs make premium automation accessible to mainstream households. Matter protocol standardization further eliminates interoperability barriers, enabling consumers to build vendor-neutral ecosystems that maximize device utility and investment protection.
Rising Demand for Energy Management Solutions
Consumer focus on sustainability and utility cost reduction propels demand for intelligent energy management systems that optimize residential consumption patterns. Smart thermostats alone deliver 15-20% average energy savings through occupancy-based scheduling and predictive weather algorithms, while integrated platforms coordinating appliances, lighting, and HVAC systems compound efficiency gains. European Green Deal mandates requiring 55% emissions reduction by 2030 incentivize adoption through retrofit subsidies and building efficiency standards.
U.S. Inflation Reduction Act provides $8,000 average tax credits for heat pump installations paired with smart controls. These regulatory tailwinds, combined with rising electricity tariffs averaging 12% annual increases across developed markets, create compelling economic justification for energy intelligence deployment, positioning connected homes as essential infrastructure for achieving household carbon neutrality goals.
Market Restraints
Cybersecurity Vulnerabilities and Privacy Concerns
Rapid proliferation of connected devices exposes households to sophisticated cyber threats targeting personal data, physical security, and financial systems. Mirai botnet attacks demonstrated vulnerability of IoT devices lacking robust security protocols, compromising millions of cameras and routers. 85% of consumers express concerns about smart home data privacy according to Connectivity Standards Alliance surveys. Fragmented security standards across vendors create inconsistent protection levels, eroding consumer confidence and delaying mainstream adoption. Regulatory frameworks like GDPR and California Consumer Privacy Act impose stringent compliance burdens on manufacturers, particularly for cloud-connected systems processing behavioral analytics and occupancy patterns.
High Initial Investment and Installation Complexity
Premium connected home systems demand significant upfront capital expenditure for hardware, professional installation, and ecosystem integration. Professional installation costs average $1,500-3,000 for comprehensive systems, deterring price-sensitive consumers in emerging markets. Complex device pairing across proprietary protocols requires technical expertise beyond average homeowner capabilities. 62% of potential adopters cite installation complexity as primary barrier according to industry association data. Legacy infrastructure in older buildings further complicates deployment, requiring costly electrical upgrades and network retrofitting that diminish return on investment calculations for budget-conscious households.
Market Opportunities
Matter Protocol Standardization and Interoperability
Connectivity Standards Alliance's Matter 1.4.1 protocol launch in May 2025 eliminates longstanding interoperability barriers, enabling seamless device communication across Amazon, Apple, Google, and Samsung ecosystems. Supporting Wi-Fi, Thread, and Ethernet transports with Bluetooth commissioning, Matter delivers 80% faster setup via QR code scanning and multi-admin fabric support.
Matter-certified devices grew 300% year-over-year in 2025, with Samsung and Eve Systems leading certification volume. This standardization creates substantial opportunities for device manufacturers targeting vendor-neutral platforms, service providers offering integration-free installations, and platform developers building cross-ecosystem applications. Retail channels benefit from simplified merchandising without ecosystem silos, while consumers gain flexibility to mix brands without compatibility concerns.
AI-Driven Predictive Automation Platforms
Artificial intelligence integration transforms reactive smart homes into predictive environments learning occupant patterns to preemptively optimize comfort, security, and energy usage. Google Nest and Amazon Alexa AI models analyze 6 months of behavioral data to predict occupancy, automatically adjusting lighting, temperature, and security based on routines. Edge AI processing reduces cloud dependency by 70%, enhancing privacy and responsiveness.
Siemens' Building X AI platform demonstrated 25% energy savings through predictive HVAC optimization in pilot deployments. Service providers can monetize AI subscriptions delivering occupancy analytics, anomaly detection, and personalization engines, creating $15 Billion annual recurring revenue opportunity by 2030. Health monitoring applications analyzing sleep patterns and air quality further expand addressable market into senior living and wellness segments.
Category-wise Insights
Component Analysis
Hardware commands 57% market share as the foundational infrastructure powering connected home functionality through physical devices including sensors, actuators, controllers, and connectivity modules. Dominance reflects consumer prioritization of tangible, reliable components over software abstractions, with smart thermostats ( 23% penetration), security cameras ( 19%), and smart locks ( 15%).
Hardware leadership stems from direct correlation between device quality and user trust in critical functions like physical security and climate control. Manufacturing scale achieved by leaders like Schneider Electric and Legrand drives 25% annual cost reductions through component commoditization, enabling competitive pricing while maintaining margins through premium feature differentiation.
Connectivity Technology Analysis
Wi-Fi dominates connectivity landscape with 62% share, leveraging ubiquitous home broadband infrastructure and high-bandwidth capabilities essential for 4K streaming, multi-camera surveillance, and cloud synchronization. Wi-Fi 6E adoption reached 45% of new devices in 2025, delivering 40% capacity improvements supporting 100+ devices per access point.
Leadership justified by 96% household penetration versus Thread and Zigbee, per Connectivity Standards Alliance deployment metrics. Backward compatibility with existing routers eliminates infrastructure barriers, while Matter-over-Wi-Fi certification accelerates ecosystem integration. Cost advantages from mature semiconductor ecosystem enable 30% lower BOM costs versus proprietary protocols.
Application Analysis
Security & Surveillance applications command 38% market share, driven by consumer prioritization of physical safety amid rising urban crime rates averaging 15% annual increases in major cities. Video doorbells achieved 28% household penetration, indoor cameras 22%, per Parks Associates surveys. Leadership reflects dual value proposition of deterrence and evidence collection. Integration with professional monitoring services generating $4 Billion annual revenue further cements category dominance. AI-powered features including facial recognition and anomaly detection expand addressable market into commercial applications.
End User Analysis
Residential segment maintains 59% dominance, reflecting homeowner autonomy for customization versus commercial leasing constraints. Single-family homes lead with 67% residential penetration versus apartments, driven by retrofit flexibility and investment horizon alignment. U.S. Census Bureau data shows 65 million owner-occupied single-family units versus 42 million rentals, creating larger addressable market. High willingness-to-pay averaging $2,800 per household supports premium deployments, while energy savings ROI averaging 18 months justifies investment. Commercial growth accelerates at 22% CAGR but trails residential scale.
Regional Insights
North America Connected Homes Trends
North America continues to lead global connected home adoption, driven by the maturity of the U.S. market and strong ecosystem partnerships. Major telecom operators such as Comcast Xfinity and Verizon Fios accelerate adoption through bundled connectivity, security, and smart home service packages. Government incentives further strengthen momentum, with Inflation Reduction Act tax credits offering up to USD 2,000 per household, significantly boosting heat pump and smart thermostat installations and supporting a projected 50% HVAC smart penetration by 2030.
Innovation is reinforced by Matter Alliance certification hubs in Silicon Valley, which shorten development cycles and improve cross-platform compatibility. According to CTA, around 42% of new residential construction now includes smart-ready infrastructure, enabled by harmonized NEMA standards. Additionally, insurance-backed incentives play a major role, as the Insurance Institute for Business & Home Safety reports average premium reductions of 25% for monitored systems, driving approximately 3.2 million new connected home activations annually across the region.
Europe Connected Homes Trends
Europe’s connected homes market is shaped by strong regulatory frameworks and sustainability-driven policies. This leadership is supported by EnEV energy efficiency standards that mandate smart metering in roughly 85% of new residential buildings. The UK further accelerates adoption through its Smart Systems and Heat program, offering subsidies of up to GBP 7,500 per heat pump installation when paired with intelligent control systems.
France complements this growth with its MaPrimeRénov’ initiative, providing average grants of EUR 15,000 and targeting nearly four million home renovations by 2030. At the regional level, the EU Green Deal aligns EPBD directives to require zero-energy buildings by 2050, stimulating large-scale retrofit demand that represents about 65% of total installations. Interoperability and cross-border deployment are strengthened by VDI standards, ensuring consistent technology integration across all 28 member states.
Asia Pacific Connected Homes Trends
Asia Pacific represents the fastest-growing connected homes market, led by China, which accounts for approximately 42% of regional demand. Growth is driven by the country’s 14th Five-Year Plan, which mandates smart infrastructure deployment across more than 300 cities. India is also gaining momentum through its Smart Cities Mission, targeting 100 cities with investments totaling INR 48,000 crore to integrate connected housing, utilities, and security systems. Japan’s market focus is distinct, emphasizing senior care and remote monitoring solutions as nearly 29% of its population is over the age of 65.
Within Southeast Asia, ASEAN countries show strong progress, with Singapore’s Smart Nation 2025 program achieving around 92% household coverage. Meanwhile, Thailand and Indonesia strengthen the regional supply chain by leveraging advanced manufacturing ecosystems, collectively producing nearly 60% of global smart home components, supporting both domestic adoption and export-led growth.
Competitive Landscape
The global connected homes market displays a moderately consolidated structure, with approximately 10–12 multinational players controlling nearly 65% of total market share, alongside a wide base of specialized regional competitors. Industry leaders such as Honeywell, Siemens, and Schneider Electric focus on platform consolidation strategies, frequently acquiring software and analytics firms to deliver integrated, end-to-end ecosystems. On average, companies allocate around 7% of annual revenue to R&D, prioritizing AI-enabled edge computing, predictive automation, and zero-trust cybersecurity architectures.
Competitive differentiation increasingly centers on Matter certification leadership, long-term interoperability guarantees of up to five years, and managed service offerings that deliver recurring revenue. These service-led models generate margins nearly 40% higher than traditional hardware sales. As a result, the market economics are shifting steadily from hardware-driven margins of about 25% toward subscription-based SaaS models capable of delivering margins approaching 75%, improving long-term profitability and customer retention.
Key Market Developments
- May, 2025: Matter 1.4.1 enhanced energy reporting and multi-admin interoperability, Siemens partnered with Microsoft to accelerate smart building deployments, and Honeywell announced an automation spin-off to strengthen its USD 20 billion connected buildings and homes strategy.
Companies Covered in Connected Homes Market
- Ericsson AB
- Schneider Electric SE
- Siemens AG
- ABB Ltd.
- Honeywell International, Inc.
- General Electric Company
- United Technologies Corporation
- Johnson Controls, Inc.
- Legrand S.A.
- Samsung Electronics Co., Ltd.
- Emerson Electric Co.
- Amazon.com, Inc. (Alexa)
- Google LLC (Nest)
- Apple Inc. (HomeKit)
- LG Electronics Inc.
Frequently Asked Questions
Global Connected Homes Market expected to reach US$ 135.9 Billion by 2026, expanding from US$ 61.6 Billion in 2020 at 15.3% CAGR through 2033, driven by IoT proliferation and smart infrastructure investments.
Primary drivers include IoT device explosion (18B+ units 2024), energy efficiency mandates (15-20% savings), security concerns (38% application share), 5G infrastructure, and regulatory incentives like EU Green Deal and IRA tax credits.
Hardware dominates with 57% share, providing essential sensors, controllers, and connectivity modules critical for reliable operation across security (38%) and automation applications.
North America leads with 34% global share through U.S. telco dominance (41% activations), IRA incentives, and Matter innovation ecosystem acceleration.
Matter protocol standardization eliminates interoperability barriers, unlocking $50B vendor-neutral ecosystems through seamless cross-platform device communication and simplified consumer adoption.


