


- Industrial Machinery
- Pressure Relief Valves Market
Pressure Relief Valves Market Size, Share, and Growth Forecast, 2025 - 2032
Pressure Relief Valves Market By Product Type (Spring Loaded, Others), Set Pressure (Low, Others), Application (Interior, Others), End-user (Oil & Gas, Others), and Regional Analysis for 2025 - 2032
Pressure Relief Valves Market Size and Trends Analysis
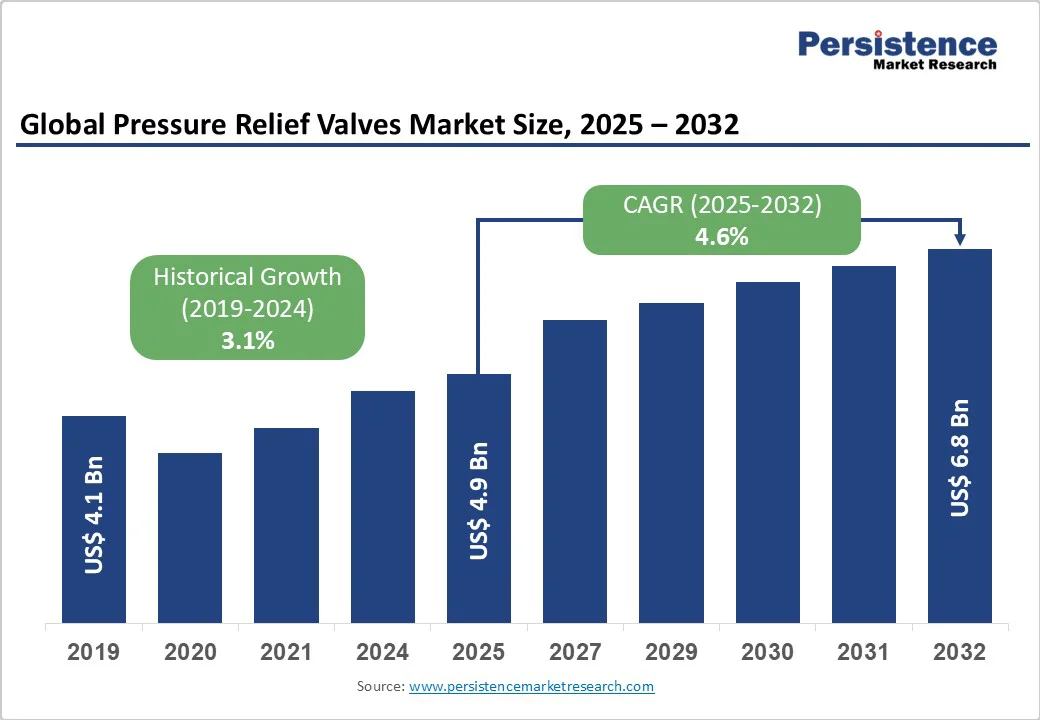
The global pressure relief valves market size is likely to be valued at US$4.9 Billion in 2025 and is expected to reach US$6.8 Billion by 2032, growing at a CAGR of 4.6% during the forecast period from 2025 to 2032, driven by demand for advanced pressure management solutions.
The market exhibits robust growth momentum, supported by mandatory compliance requirements and rising industrial automation adoption across critical infrastructure applications.
Key Industry Highlights
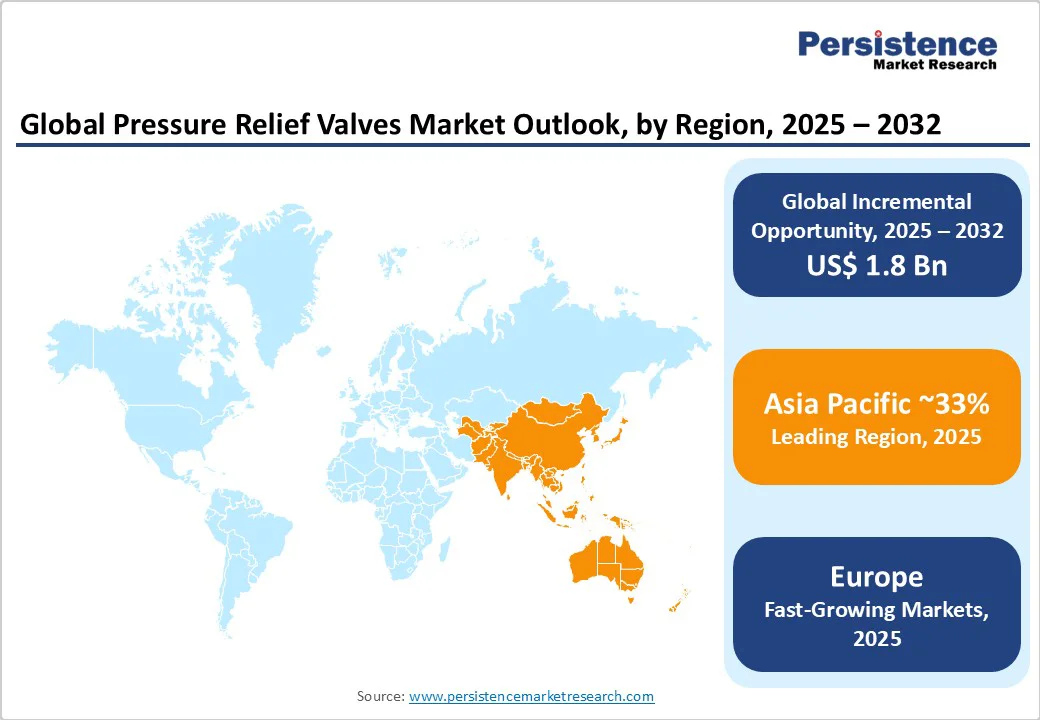
- Regional Leadership: Asia Pacific leads with 32% share, driven by rapid industrialization, followed by North America at 27%, while Europe grows the fastest at 4.8% CAGR on modernization and sustainability focus.
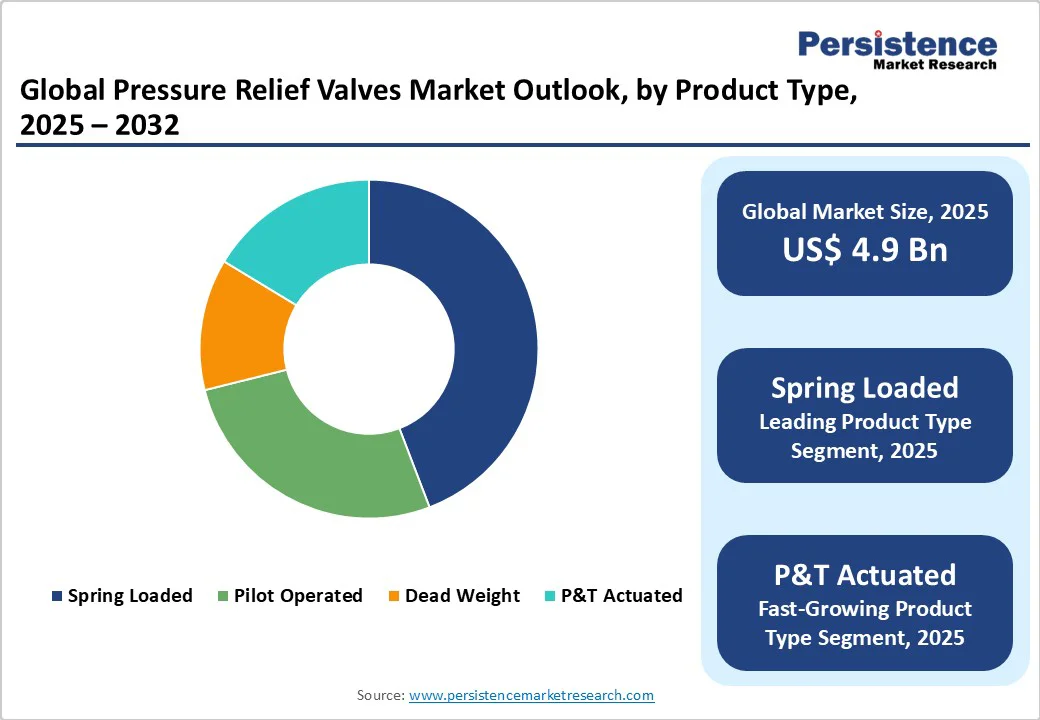
- Product Segments: Spring-loaded valves dominate with 44% share for their reliability, while P&T actuated valves grow fastest at 5.2% CAGR driven by automation and advanced safety integration.
- Application Focus: Oil & gas leads with 28% share due to high safety demands, whereas power generation grows fastest at 5.0% CAGR amid global clean energy transitions.
- Set Pressure Trends: Medium-pressure valves command a 48% share for broad industrial use, while low-pressure valves rise at a 4.7% CAGR with increasing adoption in compact systems.
- Technology Integration: Industry 4.0 and IoT-enabled smart valves boost real-time monitoring, predictive maintenance, and efficiency across advanced industrial setups.
- Regulatory Drivers: Strict safety and automation mandates drive sustained demand, pushing manufacturers toward innovation and compliance with evolving global standards.
| Key Insights | Details |
|---|---|
| Pressure Relief Valves Market Size (2025E) | US$4.9 Bn |
| Market Value Forecast (2032F) | US$6.8 Bn |
| Projected Growth CAGR (2025-2032) | 4.6% |
| Historical Market Growth (2019-2024) | 3.1% |
Market Factors - Growth, Barriers, and Opportunity Analysis
Growth Analysis - Stringent Safety Regulations and Compliance Requirements
The global implementation of enhanced industrial safety standards represents the primary growth catalyst for the pressure relief valves market expansion. Regulatory bodies, including OSHA in North America, the European Union's Pressure Equipment Directive (PED), and international standards such as API 526/ASME compliance mandates, are compelling industrial facilities to adopt advanced pressure management systems. These regulations require comprehensive overpressure protection in high-risk industries, with non-compliance resulting in operational shutdowns and significant financial penalties.
The European PED directive alone categorizes pressure relief devices as Category IV equipment, requiring stringent certification regardless of size or application. Government agencies report that industrial accident prevention through proper safety valve installation reduces workplace incidents by 35-40% annually, driving sustained regulatory enforcement and market demand.
Rapid Industrial Expansion in Emerging Economies
Unprecedented industrial development across Asia Pacific and Latin American regions continues to fuel massive infrastructure investments requiring advanced pressure relief solutions. China's industrial output growth and India's expanding manufacturing base have generated substantial demand for pressure management systems, with government data indicating US$127 Billion in annual industrial safety equipment investments across these markets.
Energy infrastructure expansion, particularly LNG terminals and hydrogen production facilities, demands specialized pressure relief valves capable of handling cryogenic temperatures to -162°C and pressures up to 700 bar. The UN Global Technical Regulation 13 mandate for thermal pressure relief devices in energy applications has created immediate demand for fire-resistant alloy components and rapid-discharge valve geometries. Industrial automation adoption rates in emerging markets exceed 15% annually, necessitating integrated pressure relief systems compatible with digital monitoring platforms.
Barrier Analysis - High Manufacturing and Maintenance Costs
Advanced pressure relief valve systems use stainless steel and high-alloy metals to endure extreme conditions, increasing production costs. High-pressure applications require precision-engineered parts with tight tolerances, raising manufacturing complexity. Beyond purchase costs, total ownership includes regular testing, recalibration, and component replacement per safety standards. Maintenance programs mandate six-month testing and annual verification, burdening smaller facilities. Although costlier initially, alternative technologies need lesser maintenance and longer service intervals, intensifying competition for traditional spring-loaded valves.
Technical Complexity and Integration Challenges
Integrating advanced pressure relief valve systems into existing infrastructure poses technical challenges requiring expert skills and longer implementation timelines. Pilot-operated and digital valves need complex installation and compatibility checks with legacy equipment, risking operational disruptions. Configuring smart valve communication and cyber-security adds further barriers. Training maintenance staff for diagnostics and troubleshooting increases resource needs, especially in regions lacking expertise. Studies show improper installation causes 40-50% of failures, highlighting the need for qualified technical support.
Opportunity Analysis - Smart Technology Integration and Predictive Maintenance
The convergence of IoT sensors, artificial intelligence, and predictive analytics enables next-generation pressure relief valve systems with advanced performance monitoring and maintenance optimization. Smart valves with continuous condition monitoring can predict maintenance needs 30-60 days ahead, minimizing downtime and boosting efficiency. Cloud-based platforms allow centralized management of remote valve networks. With the US$77 Billion industrial IoT market driving growth, AI-driven performance analysis and automated adjustments can cut maintenance costs by 15-20% while enhancing safety and operational reliability.
Renewable Energy Infrastructure Development
The global shift toward renewable energy and clean technologies is driving strong demand for specialized pressure relief solutions. Wind farms need advanced valves for hydraulic and gearbox systems, while solar thermal plants require high-temperature relief valves for concentrated solar power operations. Green hydrogen facilities, backed by US$12 Billion in annual investments, demand corrosion-resistant valves rated up to 700 bar. Battery energy storage systems also require thermal management safety valves, and CCUS projects need CO?-compatible designs, with government incentives accelerating growth in this emerging market.
Advanced Materials and Specialized Applications
Advancements in next-generation valve materials and coatings are expanding applications requiring extreme corrosion resistance, high-temperature durability, and chemical compatibility. Growth in pharmaceutical and biotechnology manufacturing fuels demand for sanitary valves with superior cleanability and validation. Aerospace and defense alloy innovations enable lightweight, high-performance designs with premium value. Nuclear power modernization, a US$8.5 Billion market through 2030, needs radiation- and seismic-qualified systems. Emerging space exploration and deep-sea projects further drive demand for specialized valves built for extreme environments, creating lucrative niche opportunities.
Category-wise Analysis
Product Insights
Spring-loaded pressure relief valves dominate the global market with a commanding 44% market share, representing the most widely adopted technology due to their mechanical simplicity, reliability, and cost-effectiveness. These valves utilize compressed spring force to maintain closure until system pressure exceeds the predetermined set point, making them suitable for diverse industrial applications, including oil and gas processing, chemical manufacturing, and power generation facilities. Their proven track record, standardized designs, and compatibility with the existing infrastructure have established spring-loaded valves as the industry standard for routine pressure protection applications.
The P&T Actuated segment emerges as the fastest-growing product category, achieving a robust 5.2% CAGR driven by increasing demand for precision control and automated response capabilities. These valves utilize pressure and temperature actuation mechanisms, enhancing protection protocols in industrial processes.
The rise of Industry 4.0 and smart manufacturing increases the demand for integrated P&T actuated systems. Their superior performance in critical applications such as nuclear power, pharmaceuticals, and high-precision chemicals justifies premium pricing and drives growth in advanced industrial sectors.
Set Pressure Insights
Medium set pressure valves maintain market leadership with 48% market share, reflecting their versatility across mainstream industrial applications requiring moderate pressure management capabilities. This segment encompasses valves designed for operating pressures typically ranging from 15 to 150 psig, making them suitable for conventional oil and gas processing, chemical production, and manufacturing operations. Medium-pressure applications represent the largest volume segment, due to their broad applicability across diverse industrial processes and established infrastructure requirements.
The low-set pressure segment demonstrates the strongest growth trajectory with a 4.7% CAGR, driven by expanding applications in food and beverage processing, pharmaceutical manufacturing, and specialized industrial processes. Rising demand for hygienic pressure relief solutions in biotechnology and food processing supports premium pricing and market growth.
Innovations in materials and design enhance the precision and reliability of low-pressure valves, crucial for maintaining product quality and process efficiency. The focus on process optimization and quality control is further driving the adoption of specialized low-pressure relief systems.
End-user Insights
Oil and gas applications dominate end-user demand, accounting for 28% of the market, spanning upstream exploration, midstream transportation, and downstream refining. The sector’s high-pressure operations and strict safety requirements drive the need for comprehensive pressure relief protection across drilling platforms, processing facilities, and pipelines. Continued investments in liquefied natural gas (LNG) terminals and shale gas development sustains strong demand, with each new project requiring thousands of relief valves.
Power generation represents the fastest-growing segment, expanding at a 5.0% CAGR, propelled by rising global electricity demand and modernization initiatives. Nuclear plant upgrades and safety enhancements require advanced, seismic-qualified valves, while renewable energy projects, such as concentrated solar power and geothermal systems, fuel demand for high-temperature, corrosion-resistant designs.
The shift toward cleaner energy sources, coupled with grid modernization and emerging technologies such as hydrogen fuel cells and battery energy storage, creates ongoing opportunities for innovative and efficient pressure management solutions across the power generation sector.
Regional Insights
North America Pressure Relief Valves Market Trends
North America holds a significant 27% share of the market, solidifying its position as a leader in industrial safety equipment adoption. The U.S. market, valued at US$1 Billion in 2024, is projected to reach US$1.3 Billion by 2030, growing at a CAGR of 4.6%. This steady growth reflects the region’s strong industrial base, encompassing oil and gas, chemical processing, power generation, and advanced manufacturing.
Extensive energy infrastructure, including refineries, petrochemical complexes, and gas processing facilities, drives consistent demand for high-performance relief systems. With over US$25 Billion invested annually in energy infrastructure, safety equipment accounts for roughly 8-10% of total project expenditures.
Stringent regulations from OSHA and the EPA further support market expansion by mandating robust pressure relief compliance, where violations can result in shutdowns and heavy penalties. Modernization efforts targeting aging assets, especially in refineries and petrochemical plants, create strong upgrade opportunities.
The growing adoption of Industry 4.0 and smart manufacturing technologies is transforming North American facilities through IoT-enabled, predictive maintenance systems, ensuring enhanced reliability, safety, and operational efficiency across critical industrial operations.
Europe Pressure Relief Valves Market Trends
Europe is experiencing a robust 4.8% CAGR in pressure relief valve adoption, driven by stringent regulatory frameworks and industrial modernization across major economies. The European Union’s Pressure Equipment Directive (PED) enforces strict compliance, requiring Category IV classification for all pressure relief devices regardless of size or use.
Germany, the U.K., France, and Spain dominate regional demand, supported by strong chemical, automotive, and energy industries. The region’s focus on environmental protection and industrial safety encourages the adoption of advanced valves with superior leak-tightness and emissions control.
Aggressive renewable energy expansion and clean technology investments generate demand for specialized valves in wind, solar thermal, and hydrogen facilities. The European Green Deal and 2050 carbon neutrality goals further stimulate investment in clean energy infrastructure.
Germany’s Industry 4.0 initiatives accelerate smart valve adoption, featuring digital monitoring and predictive maintenance. Europe’s emphasis on innovation and compliance sustains premium pricing and steady revenue growth in this mature market.
Asia Pacific Pressure Relief Valves Market Trends
Asia Pacific commands 32% of global pressure relief valve revenue, positioning it as the leading growth driver for the global market. China spearheads regional expansion through large-scale industrial development and infrastructure investments, with government data citing US$127 Billion in annual industrial safety equipment spending.
India’s rapidly growing manufacturing base and energy sector further fuel demand, particularly in chemical processing, pharmaceuticals, and power generation. Accelerated industrialization, coupled with rising safety awareness and evolving regulations, underpins robust market growth.
Competitive manufacturing advantages, such as lower production costs, efficient supply chains, and proximity to end-user industries, make Asia Pacific a preferred hub for global valve producers. Rapid growth in the food and beverage sector, supported by urbanization and higher disposable incomes, boosts demand for sanitary pressure relief valves.
The expanding energy infrastructure, including LNG terminals and renewable projects, drives the adoption of advanced, high-performance valves. Strengthened industrial safety and environmental regulations further support sustained market expansion across the region.
Competitive Landscape
The global pressure relief valves market is moderately consolidated, with leading manufacturers such as Emerson Electric Co., Baker Hughes Company, Mercer Valve Co., Inc., and a few other prominent players controlling about 45-60% of the market share.
These companies leverage strong brand recognition, extensive product lines, and global distribution networks, along with significant R&D investments and advanced manufacturing technologies. The remaining 35-40% of market share is held by regional specialists and niche manufacturers targeting specific applications or regions.
Key Industry Developments
- In October 2023, Emerson completed the acquisition of National Instruments Corporation, a provider of software-connected automated test and measurement systems. This move enables enterprises to bring products to market faster and at lower cost.
- In January 2024, Watts Water acquired Josam, a leading provider and manufacturer of drainage and plumbing products offering a comprehensive portfolio of high-quality customized solutions for commercial, industrial, and multi-family end markets.
- In October 2023, Baker Hughes invested in green hydrogen technology by contributing to Elcogen’s US$151 Million funding package, aimed at enhancing Elcogen’s capabilities in solid oxide cell technology essential for green hydrogen production.
Companies Covered in Pressure Relief Valves Market
- Emerson Electric
- GE- Baker Hughes
- Parker Hannifin Corp.
- IMI plc
- Yuanda Valve Grp
- Leser GmbH & Co KG
- Curtiss-Wright Corp
- Mercer Valve Co. Inc.
- Watts Water Technologies
- Alfa Laval AB
- CIRCOR International Inc.
- Flow Safe Inc
- Mercury Manufacturing Company
- Groth Corporation
- HYDAC
Frequently Asked Questions
The pressure relief valves market is valued at US$4.9 Billion in 2025.
Stringent safety regulations from OSHA, EU PED directives, and international compliance standards drive prominent demand, while rapid industrial expansion in emerging economies and Industry 4.0 automation adoption create sustained growth catalysts across process industries.
The pressure relief valves market demonstrates robust growth at a 4.6% CAGR from 2025 to 2032.
Smart IoT integration enabling predictive maintenance, renewable energy infrastructure development requiring specialized valve technologies, and advanced materials for extreme applications present significant growth opportunities through 2032.
Key players include Emerson Electric, GE- Baker Hughes, Parker Hannifin Corp., IMI plc, Yuanda Valve Grp., and Leser GmbH & Co KG.


