


- Display Technologies
- Display Device Market
Display Device Market Size, Share, and Growth Forecast 2026 - 2033
Display Device Market by Technology (LCD, LED, OLED, AMOLED, and Others), by Resolution (HD, Full HD, 4K, 8K, and Others), by Panel Type (Flat Panel Displays, Flexible Displays, Foldable Displays, Transparent Displays), by Product Type (Smartphones & Tablets, Television Sets, Monitors & Laptops, Automotive Display, Wearables, Digital Signage Displays, Others), and by End-use Industry (Consumer Electronics, Automotive, Healthcare, Retail & Advertising, Industrial, Aerospace & Defense, Education, Hospitality, Others) and Regional Analysis, 2026-2033.
Display Device Market Size and Trend Analysis
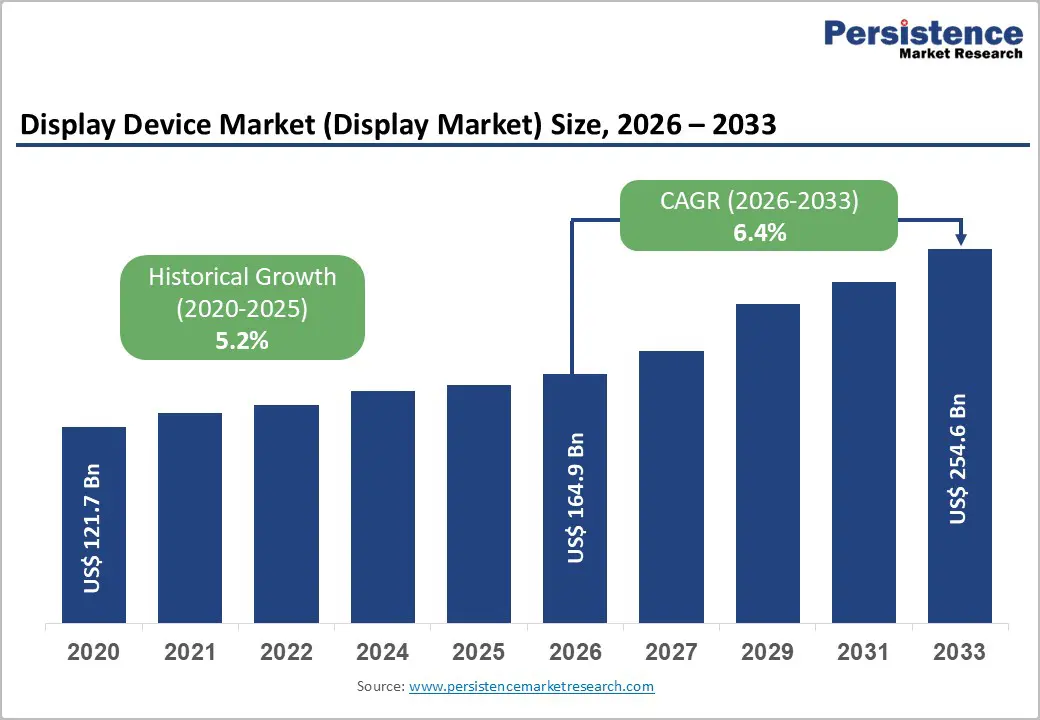
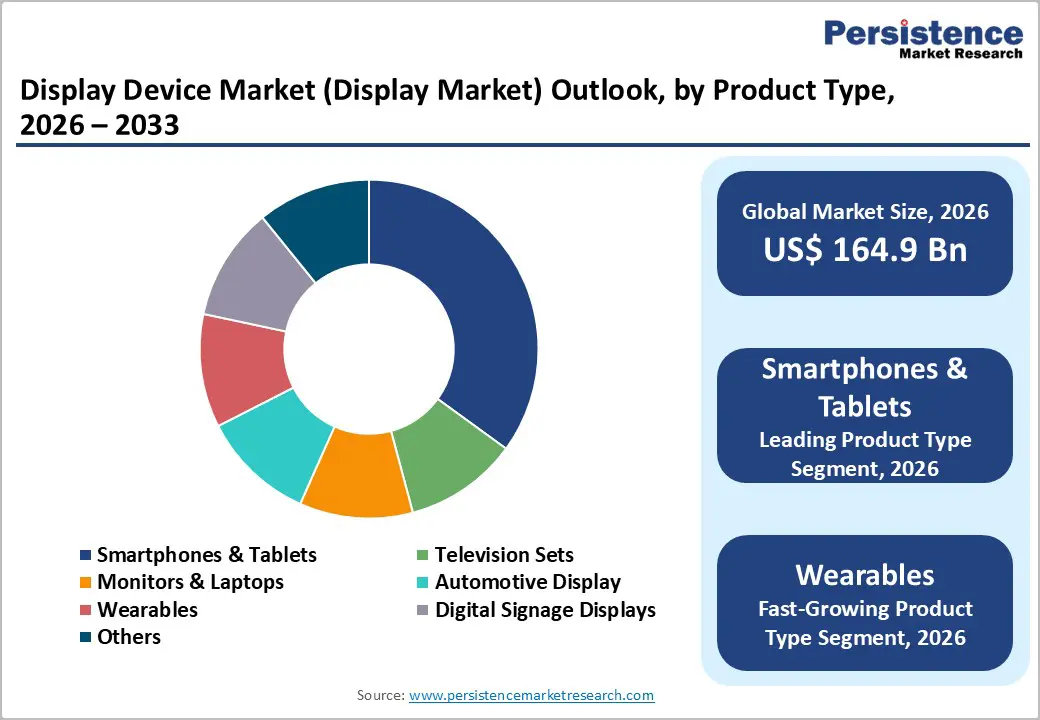
The global Display Device Market is expected to be valued at US$ 164.9 billion in 2026 and projected to reach US$ 254.6 billion by 2033, growing at a CAGR of 6.4% between 2026 and 2033.
Market expansion is fundamentally driven by technological inflection points rather than demand saturation. The OLED technology transition is creating a dual-phase growth mechanism: first, accelerating adoption across premium segments as manufacturing cost convergence eliminates price premiums historically justifying LCD dominance; second, enabling form factor innovation in foldable displays that command price premiums despite niche market penetration. Simultaneously, the automotive sector is experiencing structural demand expansion driven by electric vehicle electrification, which necessitates sophisticated display infrastructure for battery management visualization, infotainment integration, and advanced driver assistance system feedback, growth drivers fundamentally decoupled from consumer electronics replacement cycles.
Key Industry Highlights
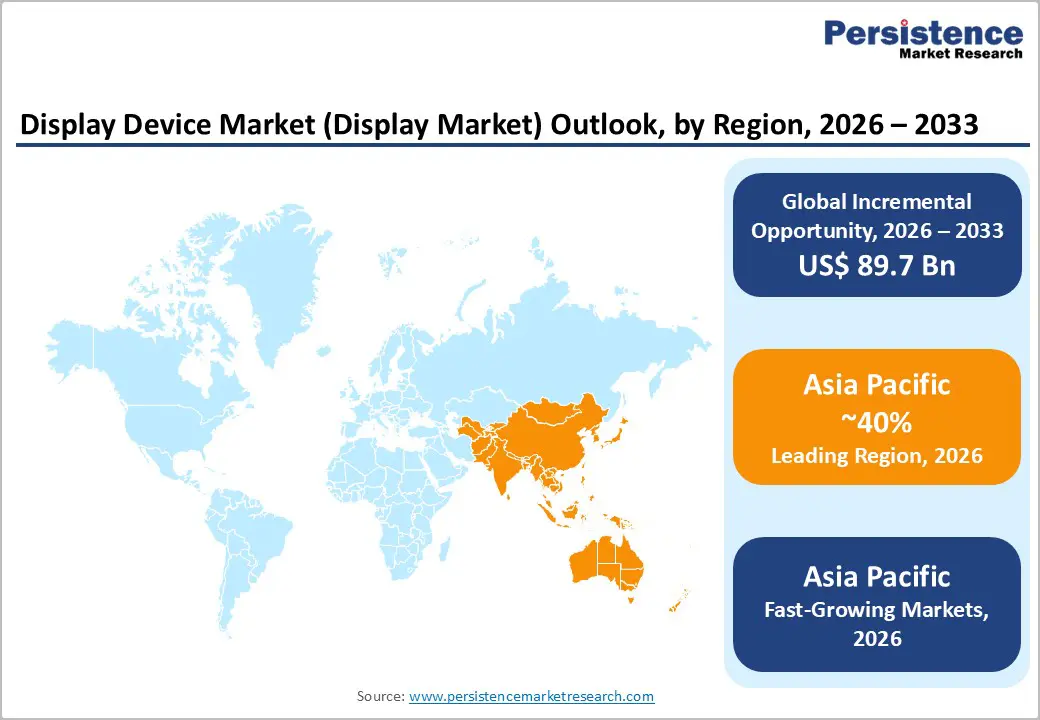
- Leading Region: Asia Pacific leads the global display market with around 40% share in 2025, supported by strong panel manufacturing capacity and robust consumer electronics demand across major regional economies.
- Fastest Growing Region: Asia Pacific is also the fastest-growing region, driven by OLED capacity expansion in China, rapid smartphone penetration in India, and rising electronics consumption across Southeast Asia.
- Dominant Technology Segment: LCD remains the dominant display technology with about 48.5% share in 2025, while OLED is the fastest-growing segment due to rising adoption in smartphones and premium televisions.
- Fastest Growing Product Segment: Wearable display devices are the fastest-growing product category, fueled by increasing demand for health, fitness, and medical monitoring applications.
- Key Market Opportunity: Medical diagnostic imaging displays present the most attractive growth opportunity, supported by high growth rates and the potential for specialized, high-margin supply contracts.
| Global Market Attributes | Key Insights |
|---|---|
| Display Device Market Size (2026E) | US$ 164.9 billion |
| Market Value Forecast (2033F) | US$ 254.6 billion |
| Projected Growth CAGR (2026-2033) | 6.4% |
| Historical Market Growth (2020-2025) | 5.2% |
Market Dynamics
Market Growth Drivers
Accelerated Technology Substitution Driven by Manufacturing Cost Parity Achievement
The OLED technology transition represents a classical substitution S-curve entering the rapid adoption phase. LCD manufacturing has transitioned to a commodity segment controlled by Chinese manufacturers BOE and CSOT, with Korean manufacturers Samsung and LG divesting capacity entirely by 2025, signaling market structural shift. The critical inflection mechanism is manufacturing cost convergence: LG Display’s Guangzhou 8.5-generation OLED line completing depreciation by mid-2025 reduces fixed-cost allocation substantially, while blue phosphorescent material efficiencies and tandem-stack architectures enable production yields sufficient for mainstream pricing.
OLED television panels achieving price parity with 77-inch Mini-LED LCD alternatives in 2026 represents the structural tipping point eliminating consumer preference for inferior LCD technology. Historical precedent demonstrates technology transitions accelerate exponentially once commodity pricing is achieved; OLED smartphone penetration reaching 63% of global shipments in Q1 2025, up from 51% in prior year, validates adoption momentum sustaining 13.7% annualized growth trajectory through forecast period.
Structural Demand Expansion in Automotive Sector Through Electric Vehicle Electrification Requirements
The automotive display market exhibits demand characteristics fundamentally distinct from consumer electronics replacement cycles, creating sustainable 8.4% CAGR through 2033 versus 6.4% aggregate market growth. Electric vehicles necessitate sophisticated digital cockpit infrastructure for battery management visualization, energy consumption feedback, and charging infrastructure integration functional requirements absent in internal combustion vehicles and representing mandatory equipment standardization across all EV manufacturers.
U.S. automotive display market expansion to US$ 30 billion by 2033 reflects both unit growth in vehicle production and component value inflation from display complexity escalation. Full digital instrument clusters commanding 32% of automotive display demand, replacing mechanical speedometers and analog instrumentation, represents permanent architecture shift not subject to economic cyclicality. Advanced driver assistance system integration amplifying display functional complexity through heads-up display requirements and augmented reality feedback mechanisms further validates automotive as secular growth vector independent of consumer discretionary purchasing patterns.
Market Restraints
Pricing Pressure and Margin Compression Eroding Industry Profitability Despite Volume Growth
Display industry financial performance exhibits inverse correlation with shipment growth, manifesting as classic overcapacity manifestation. OLED panel revenues contracted 2% YoY in Q1 2025 despite 8% unit growth in television shipments, demonstrating average selling price (ASP) erosion outpacing volume expansion. The causal mechanism operates through Chinese manufacturer capacity expansion outpacing demand growth: BOE and CSOT flexible OLED production scaling at 20%+ CAGR combined with oversupply of legacy Gen-8.5 large-area LCD fabs creates downstream pricing pressure across multiple segments. LCD fab utilization declining to 76% by May 2025 from 80% in January 2025 signals accelerating supply-demand imbalance. Premium segment differentiation via quantum-dot OLED (QD-OLED) and tandem-stack architectures enables margin preservation for technological leaders, while commodity segment participants experience margin compression insufficient to sustain capex investment. Historical precedent demonstrates display technology transitions consistently generate 24-36 month periods of extreme pricing pressure until capacity consolidation and demand recovery rebalance supply-demand dynamics; current cycle positioning suggests margin recovery delayed through 2027.
Supply Chain Concentration Risks and Geopolitical IP Vulnerabilities Constraining Market Expansion
Display industry supply chain consolidation around Samsung Electronics, LG Electronics, and BOE Technology creates dual-layer vulnerability structure. First, Samsung-BOE intellectual property conflicts intensifying through ITC trade secret complaints and patent litigation threaten supply continuity through potential U.S. market access restrictions for BOE, Samsung’s primary OLED supplier alternative, fundamentally destabilizing Apple’s dual-sourcing strategy. Second, flexible OLED panel production concentrated among Samsung, BOE, and LG Display, with supply constraints evident through yield limitations on Gen-8.6 substrates; scaling from Gen-6 to Gen-8.5 mother-glass dimensions exhibits exponential defect propagation, dampening yields and elevating cost-per-square-meter sufficiently to constrain foldable display market expansion below 124.6 million unit forecasts through 2033. Material supply bottlenecks including ultra-thin protective glass, advanced hinges, and flexible substrates concentrated among specialized suppliers create production flexibility constraints limiting capacity expansion velocity required to achieve profitable scale.
Market Opportunities
Premium Segment Specialization in Medical Diagnostics Imaging Displaying Structural Margin Advantages
Medical diagnostics represents the most attractive opportunity within the display market due to its combination of high growth and structurally superior margins. The diagnostic imaging segment is expanding at a CAGR of 14% through 2033, driven by aging populations in developed economies and expanding healthcare infrastructure in emerging markets. Specialized medical displays used in radiology, oncology, and multi-modality imaging command 30–50% price premiums over consumer displays due to stringent calibration accuracy, regulatory compliance, and certification requirements. Radiology alone accounts for more than half of medical display demand, creating high switching costs and long-term customer relationships. Integration of AI into imaging workflows is increasing precision requirements, further elevating display value. Manufacturers securing medical-grade certifications and long-term supply agreements with hospital networks can achieve stable, high-margin revenue streams through the forecast period.
Foldable Display Market Expansion Contingent on Manufacturing Yield Optimization and Consumer Price Point Convergence
Foldable displays represent a high-potential growth opportunity, currently limited more by manufacturing constraints than by end-user demand. Consumer adoption remains restricted due to concerns around durability, visible creasing, and premium pricing. Ongoing improvements in ultra-thin glass, hinge engineering, and protective coatings are gradually addressing reliability concerns and enhancing product aesthetics. However, broad market adoption depends on achieving cost reductions through higher manufacturing yields and volume scaling. Current pricing positions foldable devices firmly in the ultra-premium category, restricting addressable demand. As production efficiencies improve and defect rates decline, price convergence toward mainstream premium smartphones is expected. Foldable OLED shipments are projected to grow rapidly through the next decade, offering early-moving suppliers the opportunity to establish durable competitive advantages before mass-market adoption accelerates.
Category-wise Insights
Technology Analysis
LCD Technology Experiencing Structural Decline Accelerated by Chinese Manufacturer Commodity Dominance
LCD technology remains the dominant display technology by volume, accounting for about 48.5% market share in 2025 due to its entrenched use in televisions and monitors. However, the segment is structurally declining as production has become highly commoditized and concentrated among Chinese manufacturers. Higher power consumption and limited contrast performance compared to newer technologies are steadily reducing LCD’s competitiveness. As consumer preferences shift toward thinner, energy-efficient, and higher-performance displays, LCD demand is increasingly confined to price-sensitive applications. The withdrawal of capacity by non-Chinese producers further reinforces LCD’s positioning as a low-margin, mature segment with limited scope for technological differentiation or long-term recovery.
Resolution Analysis
4K Ultra HD Establishing as Mainstream Display Standard While 8K Premium Segment Captures Fast-Growth Opportunity
4K Ultra HD has firmly established itself as the mainstream display resolution, capturing roughly 42% market share in television applications by 2025. The segment’s dominance is supported by widespread availability of native 4K content, growing adoption in gaming platforms, and significant reductions in panel manufacturing costs. As pricing converges with Full HD alternatives, 4K has become the baseline consumer expectation rather than a premium feature. This structural standardization ensures stable replacement demand across consumer electronics, positioning 4K resolution as a volume-driven, mature segment with sustained relevance throughout the forecast period.
Panel Type Analysis
Flat Panel Display Leadership Sustaining While Flexible Display Market Expansion Creates Adjacent Opportunity
Flat panel displays continue to lead the market, supported by technological maturity, standardized manufacturing processes, and extensive integration across consumer electronics, automotive, and commercial applications. Their dominance is reinforced by reliable supply chains and cost efficiencies achieved through large-scale production. Flat panels remain the preferred form factor due to compatibility with existing device designs and infrastructure. While innovation is limited compared to emerging form factors, flat panels retain strong relevance in televisions, monitors, and in-vehicle displays. The segment is expected to maintain its leadership position through the forecast period, driven by stable demand and incremental performance improvements rather than disruptive change.
Product Type Analysis
Smartphone and Tablet Segment Maintaining Leadership While Wearable Display Market Expansion Accelerates Fastest
Smartphones and tablets represent the largest product category in the display market, accounting for over 31% share in 2025. Continuous device replacement cycles and rapid technology upgrades sustain strong demand for advanced display features such as high refresh rates, improved brightness, and edge-to-edge form factors. Premium models increasingly rely on high-performance display panels to drive differentiation, reinforcing display value contribution within overall device pricing. Despite high penetration levels, innovation in mobile displays continues to stimulate upgrades, ensuring that smartphones and tablets remain the primary volume and revenue contributors to the global display device market.
End-use Industry Analysis
Consumer Electronics Sustaining Dominance While Healthcare Diagnostics and Automotive Sectors Drive Fastest Growth
Consumer electronics dominate display demand, contributing more than 75% of total OLED market revenue in 2025. Smartphones, televisions, and tablets form the backbone of this segment, supported by recurring replacement cycles and rising consumer expectations for enhanced visual quality. Demand remains resilient across income groups as display performance increasingly influences purchasing decisions. While growth rates are moderating compared to emerging sectors, consumer electronics continue to anchor overall market stability. Ongoing advancements in resolution, energy efficiency, and form factor innovation ensure sustained relevance of this end-use segment throughout the forecast period.
Regional Insights
North America Display Device Market Trends and Insights
North America holds a strong, consolidated position in the display device market, driven by high acceptance of premium pricing and widespread adoption of consumer electronics. In 2024, the region captured about 25% of global 8K television revenue, primarily in wealthy urban centers like California, New York, and Texas, ensuring sustained demand for high-end segments through 2033.
The automotive sector emerges as the key growth driver, with the U.S. automotive display market forecasted to grow from US$ 15.7 billion in 2025 to US$ 28.8 billion by 2035, at a 6.2% CAGR outpacing consumer electronics. Full digital instrument clusters account for 32% of demand, fueled by preferences for integrated digital interfaces and ADAS features. Electric vehicle proliferation boosts needs for advanced battery management and charging displays, offering resilient demand amid economic fluctuations. Meanwhile, digital signage is poised for the fastest CAGR through 2033, propelled by retail investments in immersive experiences and omnichannel strategies, enhancing customer engagement across sectors.
Europe Display Device Market Trends and Insights
Europe demonstrates consistent growth in the display device market, bolstered by regulatory frameworks like REACH and RoHS, which enforce sustainable manufacturing. Major markets in Germany, the UK, France, and Spain lead in premium consumer electronics, paving the way for OLED expansion.
Luxury automakers such as BMW, Mercedes-Benz, Audi, and Volkswagen are integrating large OLED displays into high-end vehicle cockpits, spurring demand for high-brightness and contrast technologies. The EU's focus on sustainability encourages investments in energy-efficient OLED and microLED solutions, which consume less power than LCDs. In professional media and sports broadcasting, there's rising need for 8K displays to support content creation and distribution. Government-backed smart city projects in key capitals are accelerating digital signage rollout in transport hubs and public systems, improving information dissemination and urban efficiency. Overall, these trends position Europe as a hub for eco-friendly innovation, blending regulatory compliance with technological advancement to drive market evolution.
Asia Pacific Display Device Market Trends and Insights
Asia Pacific leads globally in display device manufacturing and consumption, holding 40% market share in 2025, thanks to giants like Samsung Display, LG Display, BOE, AUO, Innolux, and TCL CSOT dominating production. China stands as the top panel hub, with government policies accelerating advanced tech development.
Samsung's 8.6-generation OLED line, starting mass production in 2026, will yield 10 million laptop panels annually, intensifying supply competition. India's market surges via smartphone growth and initiatives like "Digital India" and "Make in India." Chinese firms BOE and Visionox shipped 364 million flexible AMOLED panels in 2024, up 120 million from 2023, meeting global smartphone demands through capacity expansions.
Japan excels in manufacturing precision, while South Korea leads in microLED and quantum dot innovations, establishing both as R&D powerhouses. This regional dominance fosters rapid technological progress, cost efficiencies, and export strength, shaping the future of global display ecosystems.
Competitive Landscape
The display market is characterized by a moderately consolidated structure, where a small group of large manufacturers controls a significant share of global production capacity, while emerging Asian suppliers are steadily increasing competitive pressure. Market leadership is reinforced through vertically integrated manufacturing, strong control over upstream materials, and extensive intellectual property portfolios spanning OLED, quantum-dot, and flexible display technologies. Competitive strategies increasingly prioritize a shift away from commoditized LCD production toward premium and differentiated display technologies that offer higher margins and longer product cycles.
State-supported capacity expansion and sustained R&D investment by new entrants are narrowing historical technology gaps, intensifying price and innovation competition. Intellectual property protection and cross-licensing agreements have become critical strategic tools, alongside rising litigation activity aimed at safeguarding technological advantages and limiting market entry. In parallel, business models are evolving beyond hardware sales, with manufacturers integrating software, AI-based calibration, content optimization, and predictive maintenance services. Strategic partnerships with device OEMs play a central role in shaping technology roadmaps, securing long-term supply agreements, and guiding capital investment decisions across the value chain.
Key Developments
- January, 2026 Titan Intech launched UltraLED displays in India, featuring advanced LED packaging including COB, SMD, and Mini/Micro-LED with optimized thermal management and power efficiency, developed in partnership with South Korean firm MIC, targeting corporate, retail, and public sectors, backed by Rs 250 crore investment in Andhra Pradesh facility.
- June, 2025 HARMAN launched the first in-vehicle display using Samsung Neo QLED technology in the Tata Harrier.ev electric SUV, featuring a 14.53-inch floating screen with cadmium-free Quantum Dots, 1200 nits brightness, 95% NTSC gamut, and energy-efficient algorithms for superior automotive visuals.
Companies Covered in Display Device Market
- Samsung Electronics Co., Ltd
- LG Electronics Inc.
- Sony Corporation
- Panasonic Corporation
- NEC Corporation
- BOE Technology Group
- China Star Optoelectronics Technology (CSOT)
- Visionox
- Innolux Corporation
- AUO (AU Optronics)
- TCL CSOT
- Leyard
- Unilumin
- Absen
- ROE Visual
Frequently Asked Questions
The market is projected to reach about US$ 164.9 billion by 2026.
Growth is driven by OLED adoption, rising automotive display demand, and rapid expansion of medical diagnostic applications.
Asia Pacific leads the market with around 40% share.
Medical diagnostic displays represent the fastest-growing and highest-margin opportunity.
The Display Device Market is dominated by Samsung Electronics, LG Electronics, Sony Corporation, BOE Technology Group, China Star Optoelectronics Technology, and Innolux.


