


- Hardware & Software IT Services
- Virtual Shopping Assistant Market
Virtual Shopping Assistant Market Size, Share, and Growth Forecast, 2025 - 2032
Virtual Shopping Assistant Market By Revenue Type (Subscription-based Model, Paid App, Per Purchase Model), Shopping Assistant Type (Product Scanners, Food Delivery Assistants), Age Group (Less than 18 Years), and Regional Analysis for 2025 - 2032
Virtual Shopping Assistant Market Size and Trends Analysis
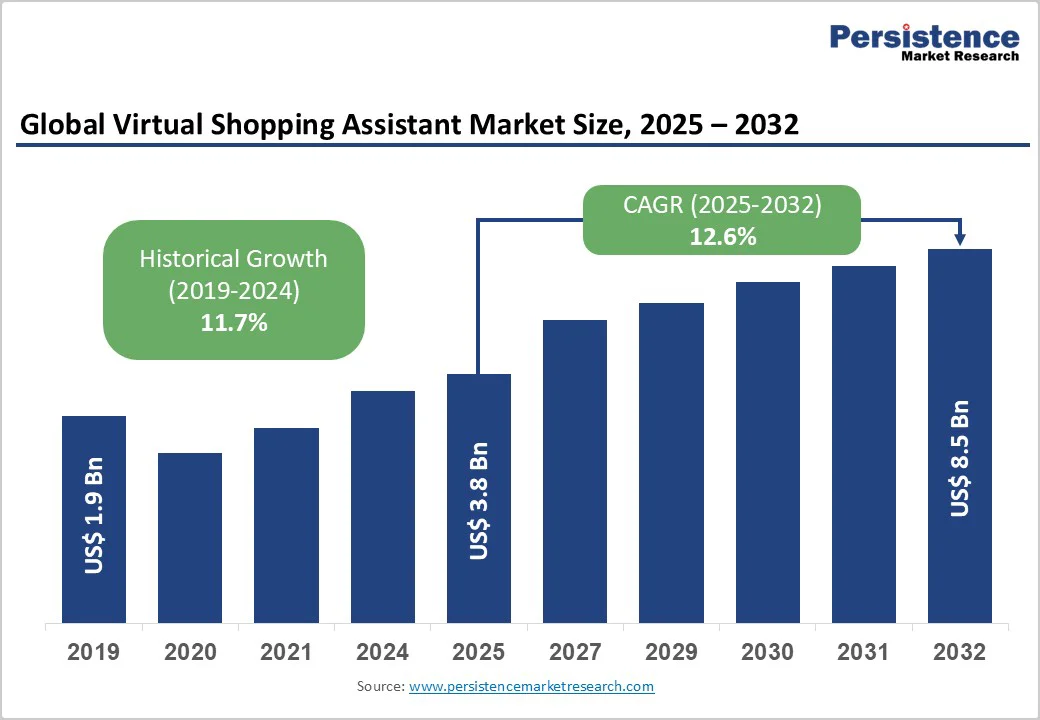
The global virtual shopping assistant market size is likely to be valued at US$3.8 billion in 2025. It is estimated to reach US$8.5 billion in 2032, growing at a CAGR of 12.6% during the forecast period 2025 - 2032, driven by the increasing shift toward mobile-first shopping.
The rising preference for personalized experiences that customize product recommendations is also spurring growth.
Key Industry Highlights
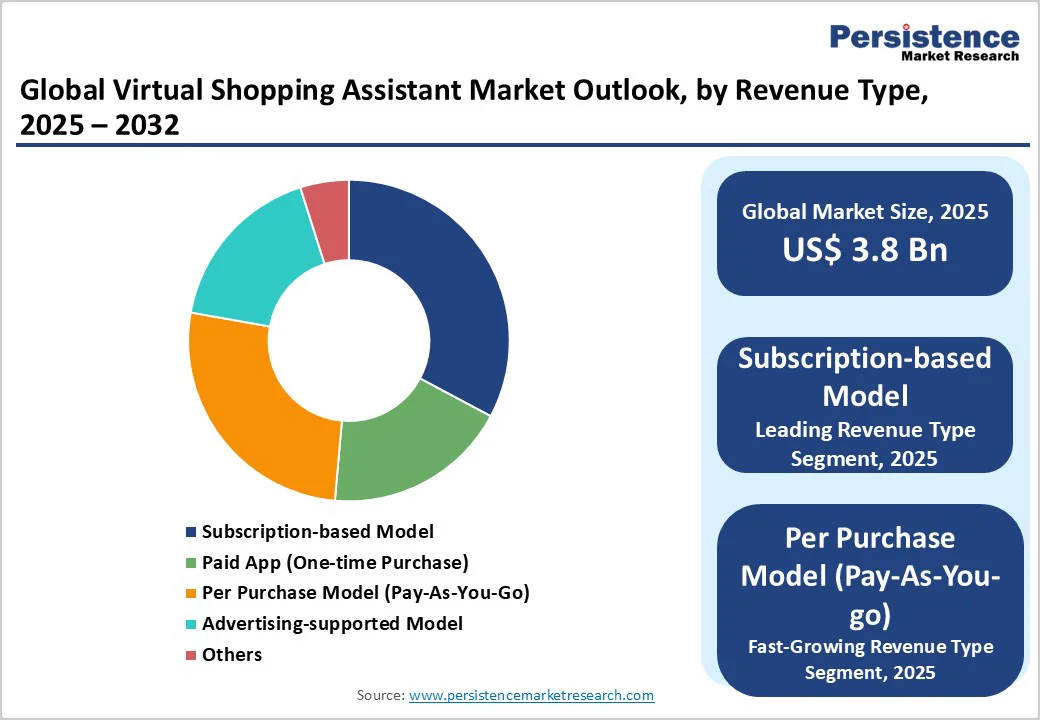
- Leading Revenue Type: Subscription-based models hold nearly 32.8% share in 2025, as they secure recurring revenue, while consumers benefit from bundled perks.
- Dominant Shopping Assistant Type: Price comparison and discount finders, approximately 28.5% of the virtual shopping assistant market share in 2025, as shoppers actively seek savings.
- Key Age Group: Young adults (18-35 years) accounted for about 38.4% in 2025, as digital-native consumers tend to embrace AI tools quickly.
- New App Launch: In June 2025, Google launched Google Doppl, a new experimental AI-based shopping assistant. It enables users to virtually try on outfits and explore styles on a digital or animated version.
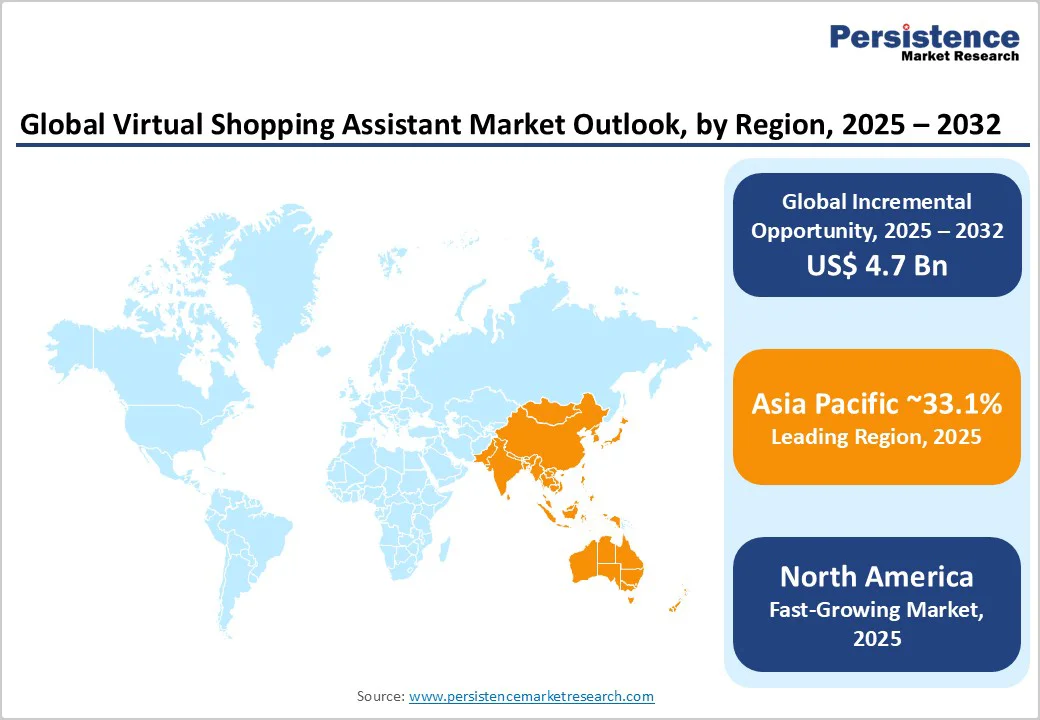
- Leading Region: Asia Pacific, with about 33.1% share in 2025, owing to super-app integration by players, including Alibaba and Meituan.
- Fastest-growing Region: North America, spurred by rising consumer trust in digital assistants and increasing AI investment.
| Key Insights | Details |
|---|---|
| Virtual Shopping Assistant Market Size (2025E) | US$3.8 Bn |
| Market Value Forecast (2032F) | US$8.5 Bn |
| Projected Growth (CAGR 2025 to 2032) | 12.6% |
| Historical Market Growth (CAGR 2019 to 2024) | 11.7% |

Market Factors - Growth, Barriers, and Opportunity Analysis
Growth Analysis - Shift toward Mobile-first Consumer Behavior
The increasing reliance on smartphones for online activities has transformed shopping habits, making mobile devices the primary access point for e-commerce. This shift necessitates that retailers optimize their platforms for mobile use, ensuring smooth navigation, quick load times, and mobile-friendly interfaces.
Features such as one-click purchases, mobile wallets, and personalized notifications have become essential to improve the shopping experience on mobile devices. Additionally, the integration of virtual shopping assistants into mobile platforms allows for real-time assistance, personalized recommendations, and efficient customer support, complying with the on-the-go nature of modern consumers.
Consumer Expectations for Personalized Shopping Experiences
Consumers now demand personalized shopping experiences that cater to their individual preferences, behaviors, and requirements. Virtual shopping assistants utilize AI, machine learning, and natural language processing to analyze user data, providing customized product recommendations, personalized discounts, and unique shopping journeys.
This personalization improves customer satisfaction, spurs brand loyalty, and refines conversion rates. For instance, AI-based personal shopping services help curate product selections based on a customer's style, budget, and past purchases, streamlining the decision-making process and reducing decision fatigue.
Barrier Analysis - Communication Challenges Limit Virtual Assistant Effectiveness
A major hurdle for virtual shopping assistants is their ability to accurately understand and respond to user queries. Despite advances in natural language processing, AI systems often struggle with ambiguous instructions, regional dialects, and slang, leading to misunderstandings or unsatisfactory recommendations.
For example, users asking for context-specific product suggestions might receive generic or irrelevant results, reducing trust in the assistant. Retailers such as Walmart and Sephora have invested in iterative AI training and multilingual support to address these issues. However, inconsistent performance across diverse user groups remains a challenge.
Privacy Concerns Restrict Adoption of Virtual Assistants
Virtual shopping assistants often require access to personal and financial information such as shopping history, location data, and payment details. It raises privacy concerns among consumers. The risk of data breaches or unauthorized use of sensitive information can deter users from fully engaging with these AI tools.
For instance, studies show that 62% of consumers hesitate to use AI shopping assistants due to concerns about data privacy. Amazon and Alibaba often implement superior encryption and anonymization techniques. However, regulatory differences across regions, especially in Europe with the General Data Protection Regulation (GDPR), complicate data management.
Opportunity Analysis - Integration of Omnichannel Retail Strategies
As retailers adopt omnichannel approaches, integrating virtual shopping assistants across various touchpoints becomes essential. This integration ensures a smooth and consistent shopping experience for consumers, whether they are browsing online or shopping in-store. For instance, retailers can utilize virtual assistants to provide personalized product recommendations, assist with inventory checks, and deliver real-time customer support across all platforms.
This cohesive interaction not only refines customer satisfaction but also drives sales and brand loyalty. The ability to collect and analyze data from multiple channels allows retailers to gain deep insights into consumer behavior, enabling targeted marketing and improved decision-making.
Developments in Voice Recognition and Conversational AI
Recent developments in voice recognition and conversational AI have improved the capabilities of virtual shopping assistants. These developments enable assistants to understand and process natural language effectively, allowing for intuitive and human-like interactions.
For example, AI-backed voice assistants can now engage in multi-turn conversations, comprehend context, and provide personalized responses based on user preferences and past behaviors. This progression not only improves user experience but also facilitates hands-free shopping, catering to consumers' demanding convenience and efficiency.
Category-wise Analysis
Revenue Type Insights
The subscription-based model will likely account for approximately 32.8% of share in 2025. This model is favored owing to its ability to fuel consistent customer relationships and provide predictable revenue streams.
By delivering personalized experiences, exclusive deals, and curated content, businesses can improve user engagement and loyalty. This model also allows for better inventory planning and demand forecasting, as businesses can anticipate customer requirements based on subscription data.
The per purchase model (pay-as-you-go) segment is estimated to be the fastest-growing in the foreseeable future, as it provides consumers with flexibility and cost-effectiveness. This model appeals to users who prefer to pay only for the services they use, without committing to long-term subscriptions. It further accommodates varying shopping behaviors and budgets, thereby making it accessible to a broad audience.
Shopping Assistant Type Insights
Price comparison and discount finders are speculated to hold a share of about 28.5% in 2025. This is because they address consumers' primary concerns, namely, cost savings and value. These assistants aggregate data from multiple retailers, enabling users to identify the best deals efficiently. This functionality is valuable for high-involvement purchases such as electronics or appliances, where price disparities can be significant.
Allergen and ingredient trackers are projected to rise considerably through 2032, backed by increasing food allergy prevalence and surging consumer awareness of dietary requirements. These tools assist consumers in understanding food product labels, detecting allergens, and searching for products that comply with their dietary restrictions. The demand for real-time and user-friendly allergen detection technologies is augmenting the development and adoption of these applications.
Age Group Insights
Young adults (18-35 years) are expected to account for nearly 38.4% of the share in 2025, spurred by their comfort with technology and high digital engagement. They frequently use voice assistants, with 80.5% of individuals aged 18 to 29 having tried using a voice assistant on their smartphone at least once. This demographic is also more likely to have used AI shopping assistants, with 24% of Gen Z consumers having tried them, compared to only 7% of Baby Boomers.
Middle-aged adults (35-55 years) are a considerably growing age group for virtual shopping assistants. This is attributed to their increasing comfort with technology, high disposable income, and a desire for convenience in shopping.
They are more likely to use voice-enabled devices for shopping, with 43% of individuals aged 45 to 60 engaging in voice shopping. Their adoption is further supported by the development of AI technologies that cater to their specific requirements, including personalized recommendations.
Regional Insights
Asia Pacific Virtual Shopping Assistant Market Trends
In 2025, Asia Pacific is estimated to account for approximately 33.1% of the market share, owing to increasing smartphone penetration, e-commerce growth, and consumer demand for personalized shopping experiences.
China and India are leading the charge, with China accounting for 30.5% of the market share in 2024 and India at 19.6%. Both countries are expected to maintain strong growth, with India anticipated to register the highest CAGR in the region during the forecast period.
In China, Alibaba is at the forefront, announcing a substantial increase in its AI investment to about US$52 Billion, surpassing its previous commitment of US$53 Billion over three years. This move includes the launch of the Qwen3-Max large language model, positioning Alibaba among the top global AI developers.
The company aims to control the full AI stack, including homegrown chip development. It is further expanding its AI infrastructure to support physical AI applications such as robotics and autonomous vehicles.
North America Virtual Shopping Assistant Market Trends
North America is speculated to witness steady growth due to developments in AI, Natural Language Processing (NLP), and voice commerce. The U.S. leads this expansion, with major retailers such as Amazon and Walmart investing heavily in AI technologies.
Amazon's AI assistant, Rufus, is set to generate over US$700 Million in operating profit in 2025, through increased customer spending and advertising revenue. Walmart has introduced Super Agents, unique AI tools developed using agentic AI technology, to improve customer experience and streamline store operations.
In the grocery segment, ShopRite has launched AI-backed Caper Carts in select stores. These enable customers to scan and weigh items as they shop, view real-time spending on interactive screens, and complete purchases directly from the cart using a secure payment system.
Similarly, Starbucks is implementing an AI-based inventory counting system across over 11,000 company-owned stores in North America. It aims to enable employees to scan inventory shelves and automatically count items, ensuring consistent product availability.
Europe Virtual Shopping Assistant Market Trends
Europe is being driven by rising consumer demand for personalized shopping experiences. Retailers across the continent are increasingly adopting AI technologies to improve customer engagement and streamline operations. In the U.K., Sainsbury's has entered a five-year partnership with Microsoft to utilize AI in refining the shopping experience and improving store productivity.
The collaboration aims to use AI to provide real-time data and improve procedures in Sainsbury's stores by incorporating technologies such as shelf-edge cameras to ensure timely restocking and maximize sales opportunities. Additionally, the partnership focuses on making online shopping interactive and improving customer search experiences.
Competitive Landscape
The global virtual shopping assistant market includes leading technology and e-commerce companies such as Amazon, Alibaba, Shopify, Salesforce, and Meta. The competitive landscape is further intensified by the ongoing expansion of instant retail services.
In China, companies such as Meituan and JD.com are competing to dominate the instant delivery market, aiming to deliver consumer goods within 30 minutes. This competition challenges traditional e-commerce models and underscores the importance of integrating AI-driven shopping assistants to improve customer experience and operational efficiency.
Key Industry Developments
- In September 2025, Ralph Lauren announced that it is bringing AI into its direct-to-consumer strategy with the launch of Ask Ralph, a new virtual shopping assistant. Shoppers can type open-ended questions about topics such as what to wear to a concert or a summer wedding.
- In August 2025, Amazon launched Rufus, an expert shopping assistant trained on the company’s product catalogue and information from across the web. It helps to answer customer questions on shopping requirements, products, and comparisons.
Companies Covered in Virtual Shopping Assistant Market
- Amazon Rufus
- AliRadar
- Digital Reality
- Deepgram
- Copilotly
- i95Dev.com
- HyperWrite
- ShopSavvy
- ModeSens
- Manifest
- Rep AI Technologies
- Xcelore
- Noom
- MyFitnessPal
- Yuka
Frequently Asked Questions
The virtual shopping assistant market is projected to reach US$3.8 Billion in 2025.
Rising demand for personalized shopping and developments in voice recognition tools are the key market drivers.
The virtual shopping assistant market is poised to witness a CAGR of 12.6% from 2025 to 2032.
Improved cross-platform personalization and growth through multilingual virtual assistants are the key market opportunities.
Amazon Rufus, AliRadar, and Digital Reality are a few key market players.


