


- Oil & Gas
- U.S. LNG Infrastructure Market
U.S. LNG Infrastructure Market Size, Share, Trends, Growth, Regional Forecasts 2026 - 2033
U.S. LNG Infrastructure Market by Infrastructure Type (Liquefaction Infrastructure, Transportation Infrastructure, Regasification Infrastructure, Storage & Distribution Infrastructure), Scale (Large‑Scale LNG, Mid‑Scale LNG, Small‑Scale LNG), Ownership Type (Private‑Owned Infrastructure, Public/State‑Owned Infrastructure, Public–Private Partnerships, Others), and Regional Analysis for 2026–2033
U.S. LNG Infrastructure Market Trends & Analysis
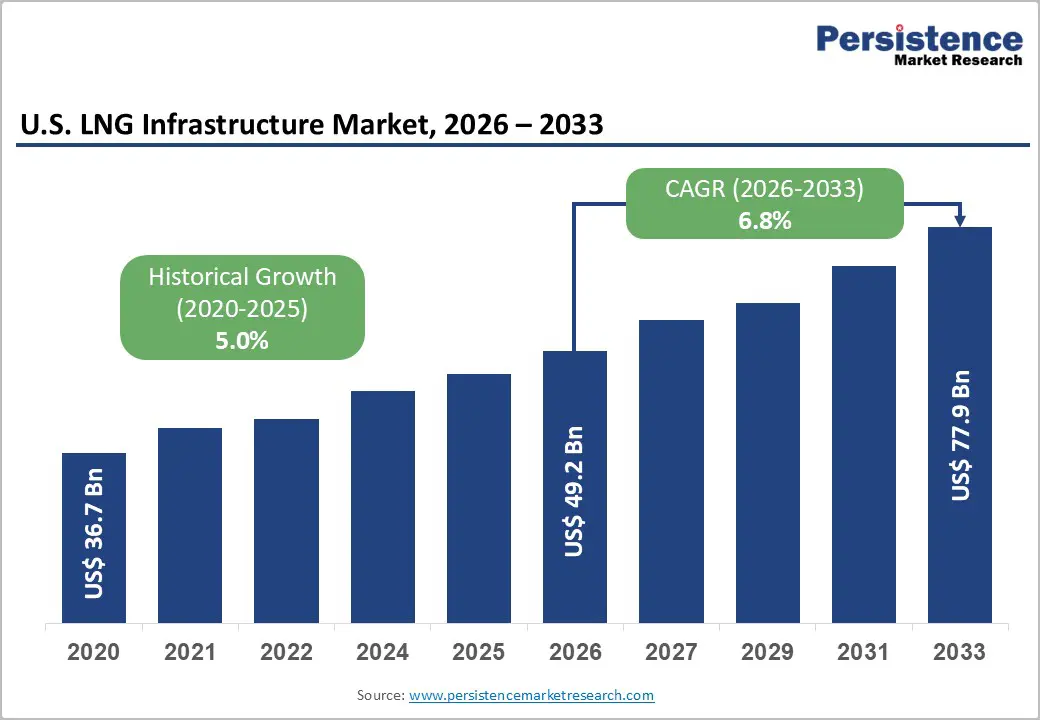
The U.S. LNG Infrastructure Market size is projected at US$ 49.2 billion in 2026 and is projected to reach US$ 77.9 billion by 2033, growing at a CAGR of 6.8% between 2026 and 2033.
Growth is supported by the United States’ status as the world’s largest LNG exporter, averaging 11.9 Bcf/d of exports in 2024, and by EIA projections that North American LNG export capacity will more than double from 11.4 Bcf/d in 2023 to 24.4 Bcf/d by 2029 as new U.S. facilities ramp up. This capacity build out is anchored in large scale Gulf Coast liquefaction projects such as Plaquemines LNG, Corpus Christi Stage 3, and Golden Pass LNG, alongside continued utilization of existing terminals.
European and Asian demand diversification away from Russian pipeline gas, combined with maritime decarbonization driving LNG bunkering and small scale distribution, underpins sustained investment in liquefaction, storage, regasification, and midstream logistics infrastructure across key U.S. basins and ports.
Key Industry Highlights:
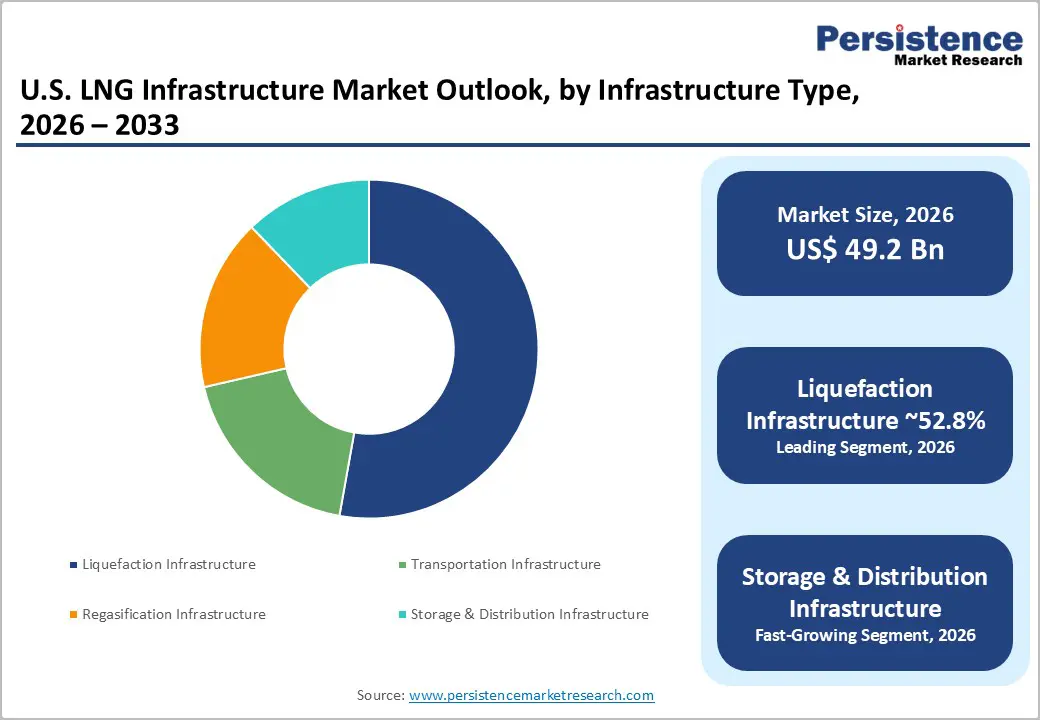
- Segment Leadership: Liquefaction infrastructure holds around 52.8% share, anchored by Gulf Coast export terminals, while large scale LNG (≥5 MTPA) accounts for about 68.5% of market value, reflecting the dominance of megaprojects such as Sabine Pass, Cameron and Calcasieu Pass.
- Fastest Growing Segments: Storage & distribution infrastructure is projected to reach roughly 7.7% CAGR, driven by bunkering and small scale logistics, and small scale LNG (<1 MTPA) is expected to expand at around 8.3% CAGR, supported by marine, industrial, and off grid applications.
- Ownership Dynamics: Private owned infrastructure commands about 72.4% share and poised to reach a positive CAGR, as private developers and investors lead the financing and delivery of liquefaction, storage, and distribution assets backed by long term offtake contracts.
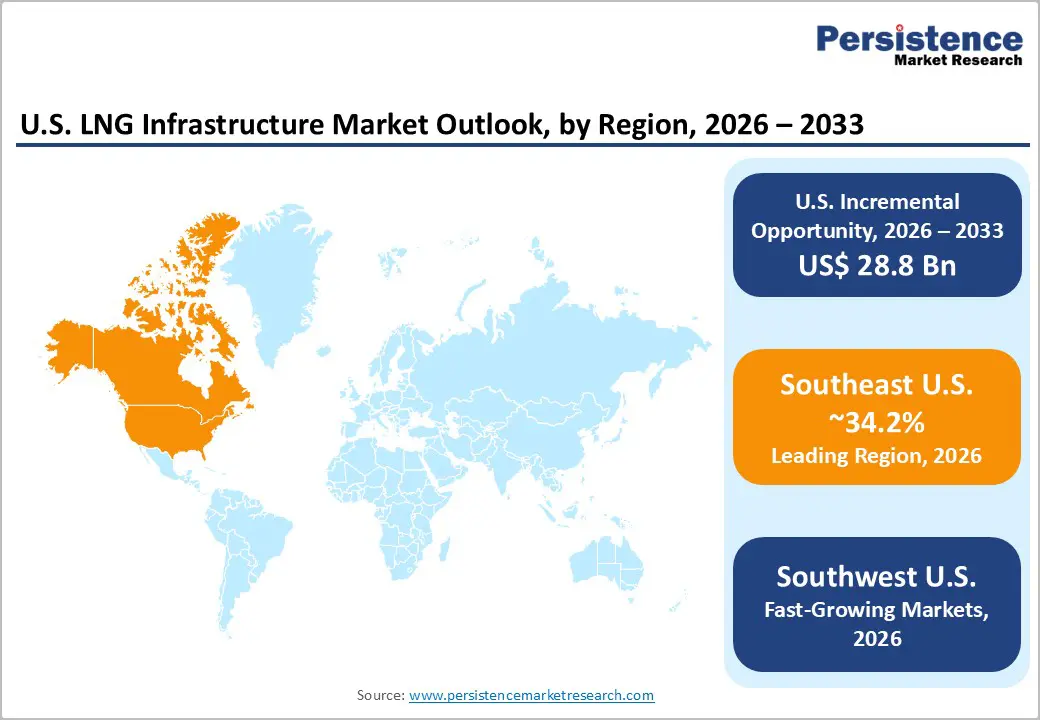
- Regional Leaders: Southeast U.S. leads with about 34.2% share, underpinned by Gulf linked and bunkering assets, while Southwest U.S. posts the fast-growth driven by Gulf Coast export terminals, and Northeast U.S. maintains a 14.1% share via import regas and peak season reliability infrastructure.
- Strategic Developments: Plaquemines LNG Phase 1, Plaquemines Phase 2, Corpus Christi Stage III, and other FID projects are collectively expected to boost U.S. export capacity by nearly 50%, while CCS enabled projects like Hackberry Carbon Sequestration signal a shift toward low carbon LNG infrastructure.
- Downstream Expansion: Growth in LNG bunkering at ports such as Jacksonville, Houston and Los Angeles/Long Beach, and rising small scale LNG usage in marine and industrial applications, creates diversified revenue streams beyond long haul exports and support higher storage and distribution infrastructure investment.
Market Dynamics Analysis
Drivers
Surging export capacity and global gas rebalancing
The United States exported an average of 11.9 Bcf/d of LNG in 2024, maintaining its position as the world’s leading LNG exporter, with Europe absorbing 53% of volumes and Asia’s share rising to 33%. EIA projects that North American LNG export capacity, dominated by the U.S., could more than double to 24.4 Bcf/d by 2029, driven by the commissioning of Plaquemines LNG, Corpus Christi Stage III, Golden Pass LNG and several other U.S. projects currently under construction. This trajectory implies a substantial expansion of liquefaction trains, storage tanks, marine berths, and pipeline feed gas infrastructure over the 2026–2033 period.
The ongoing reallocation of European and Asian gas supply away from Russian pipeline flows has increased the strategic importance of U.S. LNG, particularly for the Netherlands, France and the UK, which together imported 2.9 Bcf/d of U.S. LNG in 2024, and for major Asian buyers such as Japan, South Korea and India. This structural demand underpins long term offtake contracts and supports final investment decisions (FIDs) on new infrastructure, making liquefaction infrastructure the leading segment with around 52.8% of market value and anchoring the broader U.S. LNG infrastructure build out.
Diversification into small scale LNG, bunkering and downstream uses
While large scale export terminals dominate capacity, small scale LNG infrastructure, including satellite liquefiers, storage, trucking, and bunkering facilities, is expanding to serve marine, industrial and off grid markets. LNG bunkering infrastructure has grown significantly at U.S. ports such as Jacksonville (JAXPORT) and Houston, where terminals operated by JAX LNG and Eagle LNG offer combined storage capacities in the hundreds of thousands to over one million gallons of LNG for ship to ship and truck to ship bunkering. These facilities support LNG powered container ships and tankers, illustrating how small scale infrastructure complements export oriented megaprojects.
As International Maritime Organization (IMO) emissions regulations and regional air quality rules tighten, LNG is being used as a transition fuel for marine decarbonization, especially on the Gulf and Atlantic coasts. The growth of small scale LNG (<1 MTPA) and mid scale facilities (1–5 MTPA) supplying trucking corridors, industrial users and remote communities is expected to support the fastest growing scale segment, while also driving demand for storage and distribution infrastructure, projected as the fastest growing infrastructure type at roughly 7.7% CAGR.
Market Restraints
Permitting pauses, environmental opposition and project delays
Despite clear regulatory processes, LNG infrastructure faces opposition from environmental groups concerned about upstream methane emissions, local air quality and long term lock in of fossil assets. Litigation, public comment challenges and shifting federal policy, including recent reviews and pauses on certain new export approvals, can extend permitting timelines beyond developer expectations, elevating schedule risk. According to independent analyses, these factors have contributed to unplanned outages, slower capacity additions and flat LNG export volumes between 2023 and 2024 despite strong demand, tempering short term infrastructure growth.
Market cyclicality, utilization risk and global competition
LNG infrastructure is inherently capital intensive and exposed to global gas price volatility. The EIA notes that utilization at U.S. export terminals averaged 104% of nominal capacity and 86% of peak capacity in 2024, reflecting high but not absolute utilization. Changes in European or Asian demand, competition from Qatar, Australia and emerging exporters, and the potential acceleration of renewables and electrification could compress LNG margins or dampen long run utilization at some U.S. liquefaction projects. This introduces mid cycle risk for infrastructure investors, particularly for projects without robust long term offtake agreements.
Market Opportunities
Gulf Coast export corridor and incremental liquefaction trains
The U.S. Gulf Coast, particularly Louisiana and Texas, is the epicenter of LNG infrastructure expansion. As of mid 2020s, seven export terminals with total peak liquefaction capacity around 14 Bcf/d operate, mostly on the Gulf Coast, and an eighth facility, Plaquemines LNG Phase 1, shipped its first cargo in December 2024. EIA reports that five additional U.S. export projects have reached FID and are under construction, collectively expected to raise U.S. capacity by nearly 50% when fully online. These projects include Plaquemines LNG Phase 2, Corpus Christi Stage III, Golden Pass LNG and multiple others.
Given the U.S. LNG infrastructure market’s projected increase from US$ 49.2 Bn in 2026 to US$ 77.92 Bn by 2033, incremental liquefaction investments, new trains, debottlenecking and upstream processing expansions, could account for tens of billions of dollars of capex over the forecast period. Liquefaction infrastructure, already the leading segment with about 52.8% share, will likely maintain dominance, but investors can also benefit from associated investments in feed gas pipelines, compressor stations and marine loading infrastructure that enable higher throughput and flexibility.
Storage, distribution and small scale value chains
Beyond megaprojects, storage and distribution infrastructure offers a high growth, diversified opportunity set. EIA data indicate that underground working gas storage capacity in the Lower 48 states increased by 71 Bcf (1.7%) in 2024 under the demonstrated peak metric, underscoring the importance of storage in balancing seasonal and short term gas demand. On the LNG side, port based storage tanks and satellite facilities, such as bunkering terminals at the Ports of Houston and Los Angeles/Long Beach with individual capacities ranging from several hundred thousand to more than one million gallons, are expanding to serve marine and industrial users.
Given that storage & distribution infrastructure is expected to grow at about 7.7% CAGR, its share of the U.S. LNG infrastructure market could rise materially by 2033, potentially capturing a multi billion dollar incremental revenue pool compared with 2026. The small scale LNG (<1 MTPA) segment, with an expected CAGR of roughly 8.3%, will be central to this opportunity, supporting peak shaving, off grid power, heavy duty transport and bunkering schemes, and offering investors diversified cash flows less tightly tied to long haul export arbitrage.
Category wise Insights
Infrastructure Type Analysis
Liquefaction infrastructure (upstream processing) is the leading infrastructure type, accounting for approximately 52.8% of U.S. LNG infrastructure market value, reflecting the capital intensity of large export terminals such as Sabine Pass, Corpus Christi, Calcasieu Pass, Cameron LNG and Cove Point. With existing U.S. export capacity around 14 Bcf/d and EIA projections indicating a near?doubling of North American capacity by 2029, liquefaction plants will remain the backbone of the market. Transportation, regasification and storage assets are critical but structurally command smaller shares, suggesting liquefaction will likely retain leadership through 2033.
The fastest?growing segment is Storage & Distribution infrastructure, projected to expand at about 7.7% CAGR, underpinned by growth in LNG bunkering, peak?shaving facilities, satellite storage and small?scale distribution networks supplying marine, industrial and off?grid power customers. As export capacity grows and domestic demand for flexible gas logistics increases, incremental investments in tanks, truck?loading bays, pipelines and regional hubs should outpace more mature liquefaction and regasification segments on a percentage basis.
Scale Analysis
Large?scale LNG (≥5 MTPA) dominates the U.S. LNG infrastructure market with an estimated 68.5% share, anchored by megaprojects such as Sabine Pass (30 MTPA), Cameron LNG (13.5 MTPA), Freeport LNG, Elba Island and Cove Point, along with new trains at Plaquemines, Golden Pass and Corpus Christi Stage III. These facilities capture economies of scale, attracting long?term offtake contracts from European and Asian utilities and traders, and represent the bulk of the US$ 49.17–77.92 Bn market value across the forecast horizon.
Small?scale LNG (<1 MTPA) is the fastest?growing scale segment, with anticipated 8.3% CAGR, supported by distributed liquefaction units, satellite storage, trucking and bunkering infrastructure serving marine fuel, industrial customers and remote power markets. As IMO and regional emission regimes encourage cleaner marine fuels and as heavy?duty transport and off?grid users seek lower?carbon options, small?scale facilities and associated infrastructure are expected to capture rising capital allocation from both private and public–private sponsors.
Ownership Type Analysis
Private?owned infrastructure leads the U.S. LNG infrastructure market with an estimated 72.4% share, reflecting the dominance of listed and private sponsors such as Cheniere Energy, Venture Global LNG, Freeport LNG, Sempra Infrastructure and NextDecade in financing and operating liquefaction, storage and pipeline assets. While public and state?linked entities participate, e.g., through joint ventures and port authorities, the bulk of capital comes from private balance sheets and project finance, supported by long?term sales and purchase agreements (SPAs) with global buyers. Public–private partnerships and consortia play targeted roles, especially in import and regasification assets or pipeline connections.
Private?owned infrastructure is also the fastest?growing ownership segment, with an expected CAGR around 7.1%, driven by strong investor appetite for dollar?denominated, contracted midstream cash flows and by the speed at which private developers can advance projects once approvals and offtakes are secured. While PPPs and consortia remain important, particularly in import or regasification facilities and certain storage projects, private sponsors are likely to continue leading FIDs in liquefaction, storage and small?scale LNG infrastructure through 2033, reinforcing their dominant share.
Regional Market Insights
Southeast U.S. leads the U.S. LNG infrastructure market at about 34.2% share in 2025, while Southwest U.S. grows fast at approximately 7.3% CAGR.
Northeast U.S. LNG Infrastructure Market
The Northeast U.S. holds around 14.1% share of U.S. LNG infrastructure, reflecting legacy import regas terminals such as Everett (MA) and Cove Point (MD), plus regional pipeline and storage systems that ensure winter reliability for New England and Mid Atlantic gas markets. Regasification capacity at facilities like Everett (1.035 Bcf/d) and Cove Point (1.8 Bcf/d) positions the Northeast as a critical gateway for supplemental LNG supply, supporting a regional infrastructure market valued in the multi billion dollar range with steady outlook based on peak season demand.
Beyond Massachusetts and Maryland, states such as New York, New Jersey and Pennsylvania rely on interconnected pipeline and underground storage assets regulated by FERC and EIA to manage seasonal swings and support power generation, with investment opportunities in modernization, reliability upgrades and potential small scale LNG peak shaving facilities.
Southwest U.S. LNG Infrastructure Market
The Southwest U.S. (notably Texas and Louisiana) holds a prominent 28.4% share and is the fastest growing region at about 7.3% CAGR, driven by dense clusters of liquefaction, storage and marine export infrastructure on the Gulf Coast and related feed gas pipeline networks. Export terminals such as Sabine Pass, Corpus Christi, Freeport, Cameron, Calcasieu Pass, Golden Pass and Rio Grande LNG underpin a regional infrastructure market worth tens of billions of dollars, with additional value coming from pipelines, storage and port facilities supporting LNG exports and bunkering.
Texas and Louisiana benefit from abundant shale gas supplies, deep water access and supportive state policies, while sponsors such as Cheniere, Sempra Infrastructure, Venture Global, ExxonMobil, QatarEnergy and NextDecade continue to sanction new capacity and expansions, reinforcing the Southwest’s role as the core export hub for U.S. LNG.
Southeast U.S. LNG Infrastructure Market
The Southeast U.S. is the dominant region with about 34.2% share, reflecting both Gulf adjacent infrastructure and rapidly growing LNG bunkering and small scale distribution activities in states such as Florida, Georgia and the Carolinas. LNG bunkering at JAXPORT in Jacksonville, where JAX LNG and TOTE Maritime have pioneered truck to ship and ship to ship operations, alongside facilities in Port Canaveral and Savannah, supports an infrastructure market measured in the several billion dollar range across storage, trucking, bunkering and small scale liquefaction.
States including Florida, Georgia and Alabama leverage access to Gulf Coast LNG supply, growing container and cruise traffic, and favorable regulations to expand LNG bunkering, industrial distribution and peak shaving assets, with opportunities for private developers, utilities and port authorities to deploy capital into storage, pipelines and small scale liquefiers through 2033.
Competitive Landscape
The U.S. LNG infrastructure market is moderately concentrated at the liquefaction level and more fragmented in downstream storage and small scale distribution, with strong competition among Gulf Coast export developers. Key differentiators include scale, liquefaction technology, feed gas access, contract portfolios, credit quality, low carbon features and ability to deliver projects on time and budget.
Dominant strategic themes are innovation in low carbon and CCS enabled LNG, cost leadership through modular trains and standardized designs, and market expansion via additional trains, small scale LNG networks and enhanced bunkering and storage services to serve diversified marine, industrial and power markets.
Strategic Developments
- In December 2024, Plaquemines LNG Phase 1 shipped its first LNG cargo, marking the United States’ eighth export facility and initiating commercial ramp up that will significantly expand Gulf Coast liquefaction capacity and associated midstream and marine infrastructure.
- In early 2025, Plaquemines LNG Phase 2 and Corpus Christi Stage III began shipping cargoes, adding substantial incremental liquefaction capacity, with full commercial operations expected after testing, supporting EIA’s forecast of a near doubling of North American LNG export capacity by 2029.
- In 2025, Sempra Infrastructure’s Cameron LNG celebrated its 1,000th cargo and advanced the Port Arthur Pipeline Louisiana Connector, underscoring the integrated expansion of liquefaction, pipeline and export infrastructure and highlighting the company’s progress on carbon management initiatives such as Hackberry Carbon Sequestration.
Companies Covered in U.S. LNG Infrastructure Market
- Cheniere Energy, Inc.
- Sempra Infrastructure
- Venture Global LNG
- Freeport LNG Development, L.P.
- Tellurian Inc.
- ExxonMobil / QatarEnergy (Golden Pass LNG)
- TotalEnergies SE (Cameron LNG partner)
- NextDecade Corporation
- Eagle LNG Partners
- JAX LNG LLC
- Pivotal LNG / Southern Company Gas
- Other U.S. LNG storage, peak-shaving, and pipeline asset owners
Frequently Asked Questions
The U.S. LNG Infrastructure Market is expected to reach about US$ 49.2 billion in 2026 and rise to around US$ 77.9 billion by 2033, reflecting substantial ongoing investment in liquefaction, storage and distribution assets.
Market growth is driven by the United States’ position as the world’s top LNG exporter, projected doubling of North American export capacity by 2029, supportive DOE/FERC regulatory frameworks and rising demand for LNG in Europe, Asia and marine transport.
From 2026 to 2033, the U.S. LNG Infrastructure Market is projected to grow at around 6.8% CAGR, aligning with EIA’s outlook for significant capacity additions and high utilization of export terminals.
Key opportunities include new Gulf Coast liquefaction trains, expanding storage and distribution (including bunkering and small‑scale LNG), and low‑carbon, CCS‑enabled LNG infrastructure, each representing multi‑billion‑dollar investment potential over the forecast period.
Key players include Cheniere Energy, Sempra Infrastructure, Venture Global LNG, Freeport LNG, Tellurian, ExxonMobil/QatarEnergy (Golden Pass), TotalEnergies (Cameron), NextDecade, Eagle LNG, JAX LNG and other storage, pipeline and small‑scale LNG operators active across U.S. LNG infrastructure value chains.


