Process Oil Market

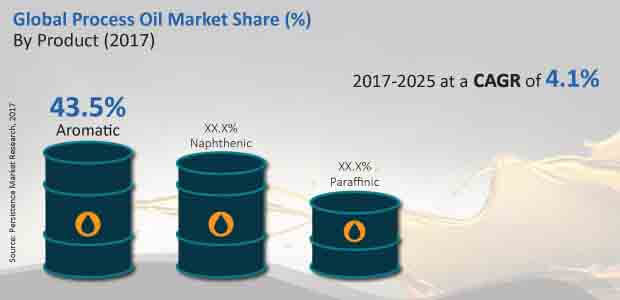
Global Market Study on Process Oil: Aromatic Product Type Segment to Hold Maximum Market Share During 2017-2025

ID: PMRREP17248
Calendar

August 2017

203 Pages

Author : Satender Singh

Paraffinic and Naphthenic segments are anticipated to incline towards high growth and high value during the period of forecast

The naphthenic segment by product type is expected to expand at a CAGR of 3.2% in terms of value over the forecast period. In terms of market attractiveness, the aromatic process oil segment has an attractiveness index of 1.0, which indicates an incline towards high growth – high value between 2017 and 2025. Developed economies such as North America account for nearly 70% of naphthenic oil production. These economies are likely to play a vital role in the process oil market in the naphthenic segment over the forecast period.

The paraffinic segment is expected to expand at a CAGR of 4.3% in terms of value over the forecast period. In terms of market attractiveness analysis, this segment is expected to record a market attractiveness index of 0.5 over the forecast period, which indicates an incline toward medium value – high growth between 2017 and 2025.

global process oil market

Global Process Oil Market: Estimated Worldwide Cumulative Consumption

The market volume of process oil is expected to grow 1.3X over the forecast period. In terms of volume, the global process oil market is estimated to reach 1,058,598 Metric Tons by 2017 end and is expected to increase to 1,314,570 Metric Tons by 2025, exhibiting a CAGR of 3.7% over the forecast period.

Market Taxonomy

Attribute Details

By Application

  • Rubber Processing
  • Adhesives & Sealants
  • Consumer Products
  • Paints & Coatings
  • Pharmaceuticals
  • Polymers
  • Others

By Product Type

  • Aromatic
  • Paraffinic
  • Naphthenic

By Region

  • North America
  • Latin America
  • Europe
  • APAC
  • MEA

Companies Covered in Process Oil Market

  • Behran Oil Co
  • Ergon Inc.
  • San Joaquin Refining Co., Inc.
  • Chevron Corp
  • Meiwa Corporation
  • Exxon Mobil Corporation
  • Nynas AB
  • Idemitsu Kosan Co., Ltd.
  • Calumet Specialty Products Partners, L.P.
  • Total S.A.
  • Hindustan Petroleum Corporation Limited
  • Royal Dutch Shell plc.
  • Petroliam Nasional Berhad (PETRONAS)
  • ORGKHIM BIOCHEMICAL HOLDING
  • Lubline
  • Avista Oil AG
  • Savita Oil Technologies Ltd.
  • Panama Petrochem Ltd
  • Apar Industries Limited
  • Raj Petro Specialties P. LTD.
  • Others.

Related Reports

1. Executive Summary

    1.1. Market Overview

    1.2. Market Analysis

    1.3. PMR Analysis and Recommendations

    1.4. Wheel of Fortune

2. Market Introduction

    2.1. Market Taxonomy

    2.2. Market Definition

    2.3. Lubricants Market Overview

3. Market View Point

    3.1. Macro-Economic Factors

        3.1.1. Global Urbanization Growth

        3.1.2. Global Construction Industry Growth

        3.1.3. Global GDP Growth Outlook

    3.2. Opportunity Analysis

4. Global Process Oil Market Analysis 2012–2016 and Forecast 2017–2025

    4.1. Introduction

        4.1.1. Market Volume Projections

        4.1.2. Market Size and Y-o-Y Growth

        4.1.3. Absolute $ Opportunity

    4.2. Value Chain

    4.3. Supply Demand Scenario

5. Forecast Factors: Relevance and Impact

6. Global Process Oil Market Analysis 2012–2016 and Forecast 2017–2025 By Product Type

    6.1. Introduction / Key Findings

    6.2. Historical Market Size and Volume Analysis by Product Type, 2012 – 2016

    6.3. Market Size (US$ Mn) and Volume Forecast By Product Type, 2017 – 2025

        6.3.1. Aromatic

        6.3.2. Paraffinic

        6.3.3. Naphthenic

    6.4. Key Trends/Developments

    6.5. Market Attractiveness Analysis By Product Type

7. Global Process Oil Market Analysis 2012–2016 and Forecast 2017–2025 By Application

    7.1. Introduction

    7.2. Historical Market Size and Volume Analysis By Application, 2012 – 2016

    7.3. Market Size (US$ Mn) and Volume Forecast By Application, 2017 – 2025

        7.3.1. Rubber Processing

        7.3.2. Adhesives & Sealants

        7.3.3. Polymers

        7.3.4. Consumer Products

        7.3.5. Paints & Coatings

        7.3.6. Pharmaceuticals

        7.3.7. Others

    7.4. Key Trends/Developments

    7.5. Market Attractiveness Analysis By Application

8. Global Process Oil Market Analysis 2012–2016 and Forecast 2017–2025 By Region

    8.1. Introduction

    8.2. Historical Market Size and Volume Analysis by Region, 2012 – 2016

    8.3. Market Size and Volume Forecast By Region, 2017–2025

        8.3.1. North America

        8.3.2. Latin America

        8.3.3. Asia Pacific

        8.3.4. Europe

        8.3.5. Middle East and Africa

    8.4. Market Attractiveness Analysis By Region

9. North America Process Oil Market Analysis 2012–2016 and Forecast 2017–2025

    9.1. Introduction

    9.2. Market Value and Volume

    9.3. Pricing Analysis

    9.4. Regional Market Dynamics

        9.4.1. Drivers

        9.4.2. Restraints

        9.4.3. Trends

    9.5. Historical Market Size (US$ Mn) and Volume Analysis By Market Taxonomy, 2012 - 2016

        9.5.1. By Country

        9.5.2. By Product Type

        9.5.3. By Application

    9.6. Current Market Size (US$ Mn) and Volume Forecast By Country 2017 - 2025

        9.6.1. U.S.

        9.6.2. Canada

    9.7. Current Market Size (US$ Mn) and Volume Forecast By Product Type 2017 - 2025

        9.7.1. Aromatic

        9.7.2. Paraffinic

        9.7.3. Naphthenic

    9.8. Current Market Size (US$ Mn) and Volume Forecast By Application 2017 - 2025

        9.8.1. Rubber Processing

        9.8.2. Adhesives & Sealants

        9.8.3. Polymers

        9.8.4. Consumer Products

        9.8.5. Paints & Coatings

        9.8.6. Pharmaceuticals

        9.8.7. Others

    9.9. Drivers and Restraints: Impact Analysis

    9.10. Market Attractiveness Analysis

        9.10.1. By Country

        9.10.2. By Product Type

        9.10.3. By Application

    9.11. Key Representative Market Participants

    9.12. Market Presence (Intensity Map)

10. Latin America Process Oil Market Analysis 2012–2016 and Forecast 2017–2025

    10.1. Introduction

    10.2. Key Regulations

    10.3. Pricing Analysis

    10.4. Regional Market Dynamics

        10.4.1. Drivers

        10.4.2. Restraints

        10.4.3. Trends

    10.5. Historical Market Size (US$ Mn) and Volume Analysis By Market Taxonomy, 2012 - 2016

        10.5.1. By Country

        10.5.2. By Product Type

        10.5.3. By Application

    10.6. Current Market Size (US$ Mn) and Volume Forecast By Country 2017 - 2025

        10.6.1. Brazil

        10.6.2. Mexico

        10.6.3. Rest of Latin America

    10.7. Current Market Size (US$ Mn) and Volume Forecast By Product Type 2017 - 2025

        10.7.1. Aromatic

        10.7.2. Paraffinic

        10.7.3. Naphthenic

    10.8. Current Market Size (US$ Mn) and Volume Forecast By Application 2017 - 2025

        10.8.1. Rubber Processing

        10.8.2. Adhesives & Sealants

        10.8.3. Polymers

        10.8.4. Consumer Products

        10.8.5. Paints & Coatings

        10.8.6. Pharmaceuticals

        10.8.7. Others

    10.9. Drivers and Restraints: Impact Analysis

    10.10. Market Attractiveness Analysis

        10.10.1. By Country

        10.10.2. By Product Type

        10.10.3. By Application

    10.11. Key Representative Market Participants

    10.12. Market Presence (Intensity Map)

11. Europe Process Oil Market Analysis 2012–2016 and Forecast 2017–2025

    11.1. Introduction

    11.2. Market Value and Volume

    11.3. Pricing Analysis

    11.4. Regional Market Dynamics

        11.4.1. Drivers

        11.4.2. Restraints

        11.4.3. Trends

    11.5. Historical Market Size (US$ Mn) and Volume Analysis By Market Taxonomy, 2012 - 2016

        11.5.1. By Country

        11.5.2. By Product Type

        11.5.3. By Application

    11.6. Current Market Size (US$ Mn) and Volume Forecast By Country 2017 - 2025

        11.6.1. Germany

        11.6.2. France

        11.6.3. Italy

        11.6.4. Spain

        11.6.5. U.K.

        11.6.6. Russia

        11.6.7. Poland

        11.6.8. Rest of Europe

    11.7. Current Market Size (US$ Mn) and Volume Forecast By Product Type 2017 - 2025

        11.7.1. Aromatic

        11.7.2. Paraffinic

        11.7.3. Naphthenic

    11.8. Current Market Size (US$ Mn) and Volume Forecast By Application 2017 - 2025

        11.8.1. Rubber Processing

        11.8.2. Adhesives & Sealants

        11.8.3. Polymers

        11.8.4. Consumer Products

        11.8.5. Paints & Coatings

        11.8.6. Pharmaceuticals

        11.8.7. Others

    11.9. Drivers and Restraints: Impact Analysis

    11.10. Market Attractiveness Analysis

        11.10.1. By Country

        11.10.2. By Product Type

        11.10.3. By Application

    11.11. Key Representative Market Participants

    11.12. Market Presence (Intensity Map)

12. Asia Pacific Process Oil Market Analysis 2012–2016 and Forecast 2017–2025

    12.1. Introduction

    12.2. Market Value and Volume

    12.3. Pricing Analysis

    12.4. Regional Market Dynamics

        12.4.1. Drivers

        12.4.2. Restraints

        12.4.3. Trends

    12.5. Historical Market Size (US$ Mn) and Volume Analysis By Market Taxonomy, 2012 - 2016

        12.5.1. By Country

        12.5.2. By Product Type

        12.5.3. By Application

    12.6. Current Market Size (US$ Mn) and Volume Forecast By Country 2017 - 2025

        12.6.1. China

        12.6.2. India

        12.6.3. Japan

        12.6.4. ASEAN

        12.6.5. Australia & New Zealand

        12.6.6. Rest of APAC

    12.7. Current Market Size (US$ Mn) and Volume Forecast By Product Type 2017 - 2025

        12.7.1. Aromatic

        12.7.2. Paraffinic

        12.7.3. Naphthenic

    12.8. Current Market Size (US$ Mn) and Volume Forecast By Application 2017 - 2025

        12.8.1. Rubber Processing

        12.8.2. Adhesives & Sealants

        12.8.3. Polymers

        12.8.4. Consumer Products

        12.8.5. Paints & Coatings

        12.8.6. Pharmaceuticals

        12.8.7. Others

    12.9. Drivers and Restraints: Impact Analysis

    12.10. Market Attractiveness Analysis

        12.10.1. By Country

        12.10.2. By Product Type

        12.10.3. By Application

    12.11. Key Representative Market Participants

    12.12. Market Presence (Intensity Map)

13. Middle East & Africa Process Oil Market Analysis 2012–2016 and Forecast 2017–2025

    13.1. Introduction

    13.2. Market Value and Volume

    13.3. Pricing Analysis

    13.4. Regional Market Dynamics

        13.4.1. Drivers

        13.4.2. Restraints

        13.4.3. Trends

    13.5. Historical Market Size (US$ Mn) and Volume Analysis By Market Taxonomy, 2012 - 2016

        13.5.1. By Country

        13.5.2. By Product Type

        13.5.3. By Application

    13.6. Current Market Size (US$ Mn) and Volume Forecast By Country 2017 - 2025

        13.6.1. Gulf Co-Operation Council (GCC) Countries

        13.6.2. Turkey

        13.6.3. South Africa

        13.6.4. North Africa

        13.6.5. Rest of MEA

    13.7. Current Market Size (US$ Mn) and Volume Forecast By Product Type 2017 - 2025

        13.7.1. Aromatic

        13.7.2. Paraffinic

        13.7.3. Naphthenic

    13.8. Current Market Size (US$ Mn) and Volume Forecast By Application 2017 - 2025

        13.8.1. Rubber Processing

        13.8.2. Adhesives & Sealants

        13.8.3. Polymers

        13.8.4. Consumer Products

        13.8.5. Paints & Coatings

        13.8.6. Pharmaceuticals

        13.8.7. Others

    13.9. Drivers and Restraints: Impact Analysis

    13.10. Market Attractiveness Analysis

        13.10.1. By Country

        13.10.2. By Product Type

        13.10.3. By Application

    13.11. Key Representative Market Participants

    13.12. Market Presence (Intensity Map)

14. Competition Landscape

    14.1. Market Structure

    14.2. Competition Intensity Mapping By Market Taxonomy

    14.3. Competition Dashboard

    14.4. Company Profiles (Details – Overview, Financials, Strategy, Recent Developments)

        14.4.1. Behran Oil Co

        14.4.2. Ergon Inc.

        14.4.3. San Joaquin Refining Co., Inc.

        14.4.4. Chevron Corp

        14.4.5. Meiwa Corporation

        14.4.6. Exxon Mobil Corporation

        14.4.7. Nynas AB

        14.4.8. Idemitsu Kosan Co., Ltd.

        14.4.9. Calumet Specialty Products Partners, L.P.

        14.4.10. Total S.A.

        14.4.11. Hindustan Petroleum Corporation Limited

        14.4.12. Royal Dutch Shell plc.

        14.4.13. Petroliam Nasional Berhad (PETRONAS)

        14.4.14. ORGKHIM BIOCHEMICAL HOLDING

        14.4.15. Lubline

        14.4.16. Avista Oil AG

        14.4.17. Savita Oil Technologies Ltd.

        14.4.18. Panama Petrochem Ltd

        14.4.19. Apar Industries Limited

        14.4.20. Raj Petro Specialties P. LTD.

15. Research Methodology

Research Methodology Framework for Market Research Excellence

At Persistence Market Research, we implement a comprehensive, validated, and multi-dimensional approachto market analysis that delivers actionable insights across complex market landscapes. Our methodology combines the analytical rigor of leading consulting firms with innovative research techniques, ensuring robust market assessments that guide strategic decision-making with confidence.

Core Research Philosophy

Our methodology is built on four foundational pillars:

Research Philosophy Image

At Persistence Market Research, our methodology is designed to transcend conventional market studies by combining analytical rigor, multi-source validation, and future-focused insights.

We integrate advanced research frameworks, robust data collection strategies, cutting-edge analytics, and innovative technologies to deliver a 360-degree view of complex markets.

We integrate advanced research frameworks, robust data collection strategies, cutting-edge analytics, and innovative technologies to deliver a 360-degree view of complex markets.

Each stage spanning from strategic scoping and hypothesis-building to competitive intelligence, quality validation, and actionable recommendations is engineered to provide clients with unmatched clarity, precision, and confidence in decision-making.

By embedding innovation and technology at the core, our approach ensures that insights are not only comprehensive but also predictive, empowering businesses to seize opportunities, mitigate risks, and achieve sustainable growth

Research Philosophy Image

Capturing Key Information and Events

During this phase, key research objectives focus on essential information and data points for assessing the market, including:

Research Philosophy Image

TAM-SAM-SOM Framework Implementation

We employ both top-down and bottom-up approaches to ensure accurate market sizing.

Top-Down Market SizingBottom-Up Market Sizing
Universe Definition: Total global/regional market identificationUnit Economics: Average transaction values, purchase frequencies, customer lifecycle
Segmentation Filters: Geographic, demographic, and behavioral constraintsCustomer Segmentation: Detailed buyer persona development and sizing
Market Share Analysis: Competitive landscape assessment and share allocationPenetration Analysis: Market penetration rates by segment and geography
Growth Rate Application: Historical trends and forward-looking growth assumptionsScaling Methodology: Extrapolation techniques with confidence intervals

Validation & Cross-Verification

  • Triangulation: Comparing top-down and bottom-up results for consistency
  • Sensitivity Analysis: Testing key assumptions and parameter variations
  • Peer Benchmarking: Comparison with analogous markets and industry benchmarks
  • Expert Review: External validation through industry specialist consultation

Research Philosophy Image

Forecasting & Projection Modeling

Our proprietary forecasting models incorporate multiple variables and scenarios.

Forecasting Components

  • Historical Trend Analysis: 10-year historical growth patterns and cyclical variations
  • Driver-Based Modeling: Economic indicators, demographic shifts, technology adoption
  • Scenario Planning: Base case, optimistic, and conservative projections
  • Monte Carlo Simulations: Probability-weighted outcomes and risk assessments

Model Validation

  • Back-Testing: Historical accuracy assessment over 3–5-year periods
  • Cross-Validation: Multiple modeling approaches for result comparison
  • External Benchmarking: Comparison with established market forecasts
  • Continuous Calibration: Quarterly model updates based on new data

Comprehensive Data Collection Strategy

Our secondary research phase establishes a robust knowledge base utilizing diverse, credible sources.

Secondary Data Sourcess

  • Industry Publications & Reports
  • Government & Regulatory Data
  • Financial Intelligence (filings & reports)
  • Academic Research & Digital Intelligence

Quality Assurance Protocol

  • Source credibility assessment and publication date validation
  • Data consistency checks across multiple sources
  • Bias identification and neutralization techniques
  • Information gap tracking for primary research prioritization

Research Philosophy Image

Primary Research Excellence

Our primary research methodology employs best-in-class techniques to capture unique market insights.

Quantitative Research Methods

  • Large-Scale Surveys: Statistically representative samples with 95% confidence intervals
  • Survey Methodology: Multi-channel deployment (online, telephone, in-person)
  • Question Architecture and Response Optimization

Qualitative Research Methods

  • Executive Interviews
  • Focus Groups
  • Expert Consultations

Quality Assurance & Validation Framework

Multi-Stage Validation Process

  • Source Verification and Consistency Testing
  • Outlier Detection and Bias Assessment
  • Peer Review Process and External Validation
  • Sensitivity Analysis and Confidence Intervals

Research Philosophy Image

Methodology Validation & Credibility

Our research methodology has been extensively validated through:

  • Academic Partnerships: Collaborations with top-tier business schools and research institutions
  • Client Success Stories: Documented case studies demonstrating research impact and ROI
  • Continuous Benchmarking: Performance comparison with leading global research firms

This comprehensive methodology framework positions Persistence Market Research at the forefront of market intelligence, combining the analytical sophistication of top-tier consulting firms with innovative research techniques. Our approach ensures that every market assessment delivers precise, actionable, and strategically valuable insights that drive business success in competitive market environments.

Ready to unlock your market potential? Contact our research experts to discuss how our validated methodology can transform your strategic decision-making with data-driven market intelligence.

Copyright © 2026 Persistence Market Research. All Rights Reserved

Connect With Us -