


- Automotive
- North America Recreational Vehicles Market
North America Recreational Vehicles Market Size, Share, and Growth Forecast 2026 - 2033
North America Recreational Vehicles Market by Vehicle Type (Motorhomes, Travel Trailers & Campers, and Camping Trailers), Application (Personal and Commercial), and Country Analysis 2026 - 2033
North America Recreational Vehicles Market Size and Share Analysis
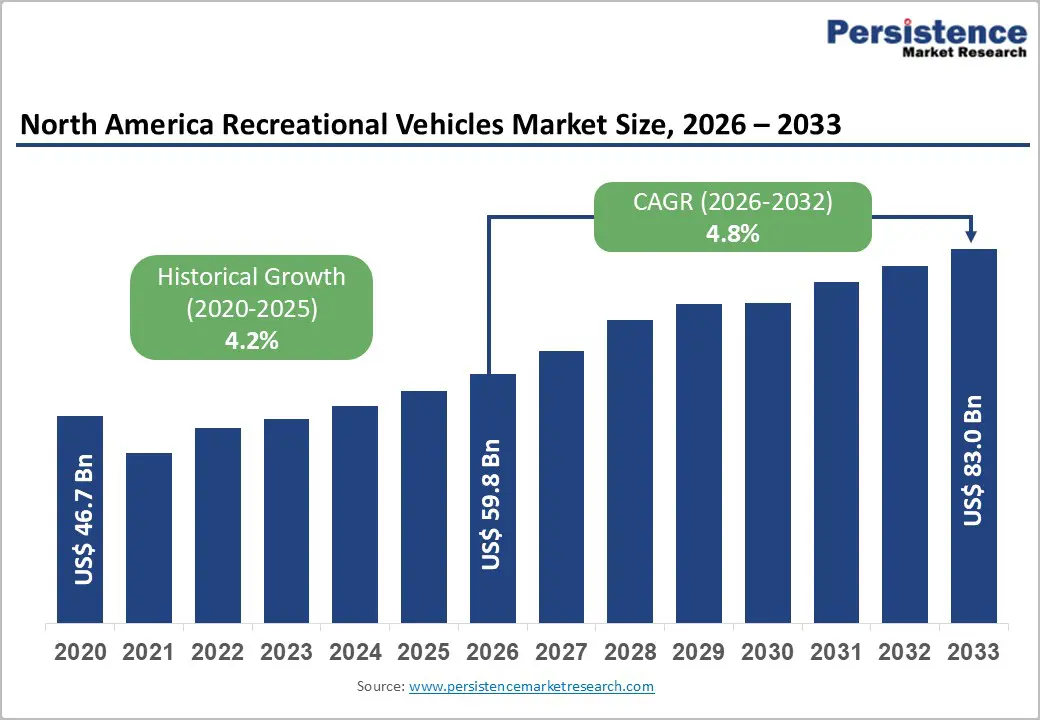
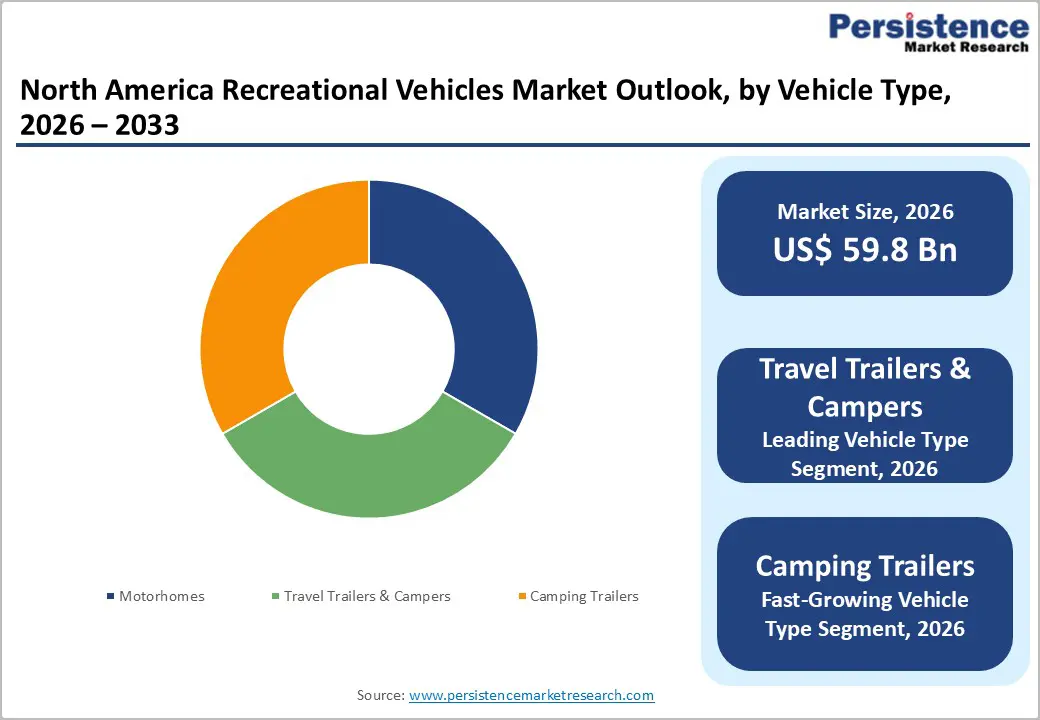
The North America Recreational Vehicles Market size was valued at US$ 59.8 Bn in 2026 and is projected to reach US$ 83.0 Bn by 2033, growing at a CAGR of 4.8% between 2026 and 2033.
The market is experiencing robust expansion driven by significant demographic shifts with Millennials and Gen Z now representing 22% of RV owners and demonstrating higher usage patterns averaging 32 days per year compared to the overall average of 30 days, while exhibiting exceptionally strong brand loyalty with 83% of Millennials and 72% of Gen Z planning to purchase another RV.
Key Market Highlights
- Leading Country: United States dominates the North America Recreational Vehicles Market driven by 11.2 million RV-owning households, Indiana's production of 84% of all U.S. and Canadian RVs, and RVIA reporting 2024 shipments increased 6.6% to 333,733 units despite economic challenges, supported by over 13,000 campgrounds and 50+ million Americans camping annually.
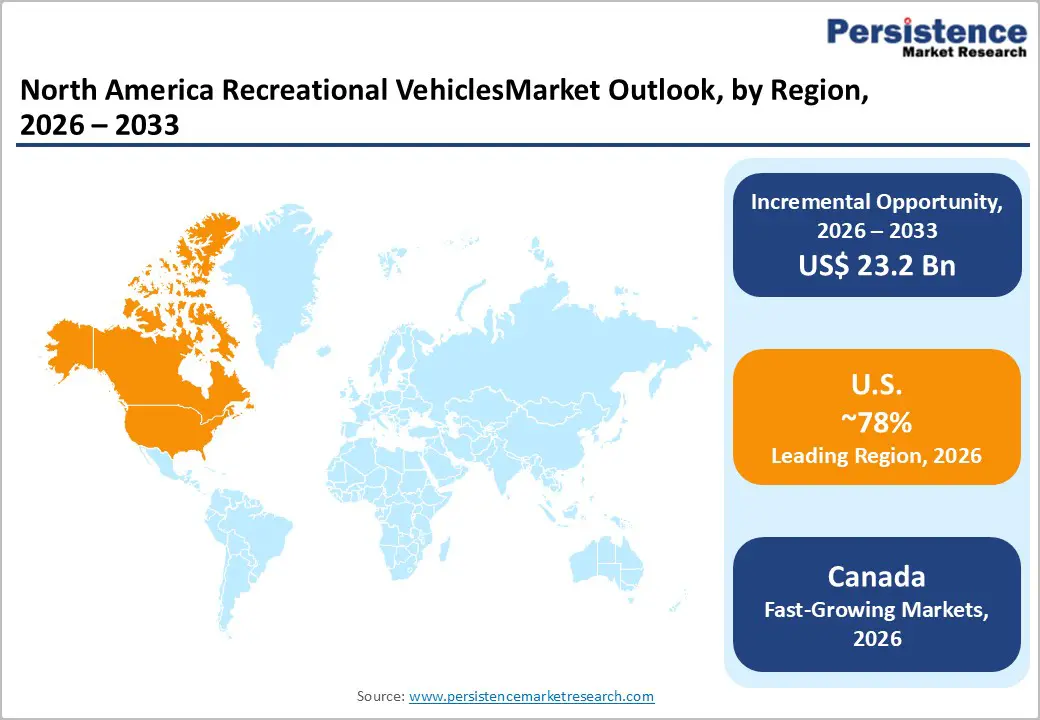
- Growing Country: Canada represents the fastest-growing market by rising interest in nature-based travel, domestic tourism expansion, and expanding participation in outdoor recreational activities such as camping, hiking, fishing, and wildlife exploration.
- Dominant Vehicle Type: Travel Trailers & Campers dominate the Vehicle Type category with 58% market share driven by lower price points averaging $20,000-$40,000 compared to motorhomes, towing flexibility with existing vehicles, and appeal to Millennial/Gen Z buyers with 22% preferring conventional travel trailers, supported by 273,700 U.S. retail sales in 2019 demonstrating sustained popularity.
- Growing Vehicle Type: Class B motorhomes represent the fastest-growing vehicle segment with approximately 5% annual growth through 2030 driven by urban dwelling Millennials seeking compact, fuel-efficient options averaging 20-25 MPG, with Winnebago's electric eRV2 and Forest River's Coachmen RVEX demonstrating innovation leadership addressing environmental concerns with 250+ mile ranges and seven-day boondocking capabilities.
- Key Market Opportunity: Peer-to-peer RV rental platforms represent key market opportunity with Outdoorsy and RVshare creating $1.17 billion industry in 2025, unlocking dormant inventory from 11.2 million RV-owning households to serve 708 million annual rental searches, with 15,000 Pro Hosts building fleets generating recurring revenue while converting renters into future buyers expanding total addressable market.
| Key Insights | Details |
|---|---|
|
North America Recreational Vehicles Market Size (2026E) |
US$ 59.8 Bn |
|
Market Value Forecast (2033F) |
US$ 83.0 Bn |
|
Projected Growth CAGR(2026-2033) |
4.8% |
|
Historical Market Growth (2020-2025) |
4.2% |
Market Dynamics
Market Growth Drivers
Demographic Transformation with Millennials and Gen Z Embracing RV Lifestyle
The Recreational Vehicles Market is experiencing a fundamental demographic transformation as Millennials and Gen Z consumers rapidly adopt RV ownership, creating sustained long-term growth potential driven by younger generations' preference for experiential travel over traditional vacations. According to Go RVing's RV Owner Demographic Profile, Millennials and Gen Z now represent 22% of RV owners with this percentage continuing to grow rapidly, achieving near-parity with baby boomers who now comprise 22% of the market, marking a historic inflection point in the industry's evolution. These younger owners demonstrate higher engagement levels, using their RVs for a median of 30 days per year with 32% of Gen Z owners using their vehicles more than 90 days annually, while showing strong participation in camping (57%), fishing (45%), and swimming (43%) activities.
This generational transition is particularly impactful because younger RV owners exhibit higher usage intensity and lifestyle integration. They report a median RV usage of around 30 days per year, with nearly one-third of Gen Z owners using their vehicles for more than 90 days annually. Their strong participation in outdoor recreational activities such as camping, fishing, and swimming further reinforces consistent vehicle utilization. This sustained engagement not only drives new unit sales but also supports aftermarket services, accessories, rentals, and campground infrastructure expansion, thereby strengthening the overall North American RV ecosystem and ensuring resilient, multi-year market growth.
Rising Participation in Outdoor Recreation and Domestic Tourism Expansion
Sustained growth in outdoor recreation participation and domestic tourism is driving robust demand for recreational vehicles as Americans increasingly prioritize outdoor experiences and road trip adventures over international travel. The 2023 North American Camping Report reveals that camping accounted for 32% of leisure travel in 2022, with 92 million households identifying as campers, while camping continues to attract approximately 1.5 million additional households annually demonstrating market stabilization and growth. Growth in high-frequency camping has been particularly dramatic, with households camping 3+ times per year increasing 174% from 2014 to 2022, indicating deeper lifestyle integration rather than occasional participation. To match the demand of the booming RV travel market, vast camping infrastructure has developed with over 13,000 privately owned campgrounds in the United States supporting the ecosystem.
The RV Industry Association forecasts continued optimism about long-term market prospects given demographic trends toward younger and more diverse buyers, increased usage of RVs by owners, and America's continued passion for outdoor travel and camping. States including Texas, California, Florida, Ohio, and Michigan represent the nation's largest RV buyers receiving approximately 22% of all shipments, while Indiana produces 84% of all U.S. and Canadian RVs as the unofficial RV capital of the world, demonstrating concentrated manufacturing expertise supporting efficient supply chains.
Market Restraints
Elevated Borrowing Costs and Constrained Consumer Spending Dynamics
High interest rates and constrained consumer finances represent significant headwinds limiting recreational vehicle purchases, with elevated borrowing costs particularly impacting discretionary big-ticket items requiring financing. According to the RV Industry Association President and CEO Craig Kirby, wholesale shipments have edged up only slightly in the face of stubborn interest rates and stretched consumer finances, with economic uncertainty around tariffs, borrowing costs, and constrained consumer spending expected to moderate shipments through the remainder of the year.
The Summer 2025 edition of RV RoadSigns prepared by ITR Economics projects wholesale RV shipments to slow through 2025 finishing slightly above 2024 levels at a median of 337,000 units representing just 1% increase, demonstrating market sensitivity to macroeconomic conditions. While dealer inventories have returned to healthy levels and consumer interest in RV ownership remains strong, financing accessibility and affordability concerns limit conversion of interest into purchases. The industry experienced a significant correction from pandemic-era highs, with wholesale shipments declining 36.5% from 2022 to 2023, though 2024 saw recovery with 6.6% growth demonstrating market resilience.
Limited RV Park Infrastructure and Seasonal Demand Fluctuations
Despite growth in RV ownership and camping participation, infrastructure constraints including limited RV parks, campgrounds, and service facilities create friction for RV users, while pronounced seasonal demand patterns create business challenges for manufacturers and dealers. According to Google Trends analysis, search interest for Class B motorhomes shows clear seasonal patterns with significant peaks during summer months of July and August, declining substantially in winter months, requiring businesses to align marketing and inventory management with these cycles. While the United States has developed over 13,000 privately owned campgrounds, capacity constraints at popular destinations during peak seasons limit accessibility and diminish user experience.
Infrastructure development including creation of dedicated motorhome parks and improved road connectivity, along with vehicle maintenance facilities and service centers, remain crucial for supporting continued market growth. Forest River Inc. announced closure of its California-based manufacturing facilities in Hemet and Rialto in October 2024, impacting approximately 400 employees due to rising costs of doing business in the state, though one Hemet facility will be converted into a dedicated Forest River Service Center demonstrating commitment to aftermarket support despite manufacturing exit.
Market Opportunities
Integration of Smart Technologies and Sustainable Innovations in Recreational Vehicles
The robust integration of smart technology, connectivity solutions, and eco-friendly innovations tailored to younger, tech-savvy consumers is one of the key opportunities in the North America Recreational Vehicles (RV) Market. As Millennials and Gen Z increasingly enter the RV ownership base, demand is rising for vehicles equipped with advanced digital features such as integrated Wi-Fi, smart energy management systems, app-controlled appliances, GPS-enabled telematics, and remote monitoring capabilities. Additionally, growing environmental awareness among these generations is accelerating interest in electric and hybrid RVs, solar-powered systems, lightweight materials, and fuel-efficient designs.
Manufacturers that invest in sustainable product development and connected mobility solutions can differentiate themselves in a competitive market while capturing premium pricing opportunities. Furthermore, the expansion of remote work culture across North America enables RVs to serve as mobile living and working spaces, creating demand for enhanced interior layouts, workspace integration, and off-grid capabilities. By aligning product innovation with lifestyle trends centered on flexibility, sustainability, and digital convenience, RV manufacturers and service providers can unlock new revenue streams and expand their addressable customer base, positioning the industry for long-term, technology-driven growth.
Commercial RV Rental Platforms and Peer-to-Peer Sharing Economy Expansion
The emergence of peer-to-peer RV rental platforms represents substantial market opportunity by unlocking dormant inventory from the 11.2 million RV-owning households and enabling new consumers to experience RV travel before purchasing. Outdoorsy, operating as the Airbnb of RVs, has netted $81 million in funding since its 2015 launch and expanded to 14 countries including Croatia, Italy, Netherlands, and Belgium, with the platform having booked 840,000 travel days among 620,000 users generating $325 million in revenue as of April 2019. The peer-to-peer rental industry reached $1.17 billion in 2025, fundamentally challenging traditional ownership paradigms and corporate rental fleet models through virtually unlimited supply potential. Outdoorsy estimates 708 million people search for RVs and other vehicles to rent annually yet only 18 million privately owned idle RVs are available, with this number swelling to 54 million when campers, vans, and trucks are counted, revealing massive supply-demand imbalance.
The platform offers turnkey approach including roadside assistance, park guides, fleet management software, ratings and reviews, and special Liberty Mutual insurance coverage allowing owners to convert RVs into business assets, with 15,000 Pro Hosts building rental fleets. This sharing economy model enables RV manufacturers to expand total addressable market by lowering barriers to entry for first-time users, with rental experiences driving future purchases as conversion mechanism, while providing owners monetization opportunities offsetting ownership costs and driving new RV sales for investment purposes.
Category-wise Insights
Vehicle Type Analysis
Travel Trailers & Campers dominate the Vehicle Type category with an estimated market share of 58%, driven by lower price points compared to motorhomes, no requirement for separate towing vehicle depreciation, and flexibility to detach at campsites enabling vehicle use for local exploration. According to the Recreation Vehicle Dealers Association (RVDA), travel trailer retail sales in the United States reached 273,700 units in 2019, representing 32% higher volume than five years earlier despite a 5.6% decline from 2018's 290,000 units, demonstrating sustained popularity and market maturity. Conventional travel trailers lead the segment attracting 22% of Millennial and Gen Z buyers planning their next RV purchase, with these younger demographics showing strong affinity for towable options compatible with existing pickup trucks and SUVs they already own.
Fifth-wheel travel trailers follow a similar pattern with 77,000 units retailed in 2019, 15.9% higher than 2015 levels, offering spacious layouts with residential-style amenities appealing to full-time RVers and extended trip users. The segment benefits from established dealer networks, extensive aftermarket accessories, and wide range of floor plans accommodating varying family sizes and budgets. Manufacturing concentration in Indiana where 84% of all U.S. and Canadian RVs are produced provides supply chain efficiencies and specialized labor force expertise supporting competitive pricing and quality standards for travel trailer producers.
Application Analysis
The personal application segment commands the leading position with approximately 87% market share, reflecting that recreational vehicles are predominantly purchased by individuals and families for leisure travel, camping, and vacation purposes rather than commercial fleet operations. According to Go RVing, a record 11.2 million American households now own an RV as of 2024, up 26% from ten years ago, with RV ownership increasing 62% since 2001, demonstrating strong personal ownership growth trends. Personal RV owners use their vehicles for a median of 30 days per year, with Millennial and Gen Z owners averaging 32 days annually, traveling with spouses (82%), children under 18 (67%), and pets (26%), engaging in camping (57%), fishing (45%), swimming (43%), and bringing recreational equipment including bicycles (40%), ATVs/4 Wheelers (23%), and motorcycles (22%).
The personal segment demonstrates exceptional brand loyalty with 89% of Millennials and 91% of Gen Z likely to purchase the same brand again, while 77% of younger RV owners live with children indicating multi-generational family usage patterns. A further 9.6 million households aspire to buy RV by 2026 according to the RV Industry Association, representing substantial pipeline for personal ownership growth. The commercial segment, while smaller, is experiencing growth through peer-to-peer rental platforms like Outdoorsy and RVshare with 15,000 Pro Hosts building rental fleets, mobile businesses, and adventure tour operators, though these applications remain minority relative to dominant personal leisure usage driving the market.
Country Trends
U.S. Recreational Vehicle Market Trend
The United States dominates the North America Recreational Vehicles (RV) Market and is projected to account for approximately 78% of the regional market share in 2026. The country’s leadership is supported by a deeply established RV culture, extensive highway infrastructure, and a vast network of campgrounds and national parks that encourage road-based travel. Strong consumer preference for outdoor recreation, coupled with high disposable income levels and favorable financing availability, continues to sustain demand across motorhomes, travel trailers, and fifth wheels.
The U.S. also benefits from the presence of major RV manufacturers, suppliers, and rental platforms, creating a well-integrated value chain that supports innovation and product availability. The, rising participation from Millennials and Gen Z consumers, along with the sustained popularity of flexible travel and remote work lifestyles, is reinforcing ownership growth. Technological advancements, including smart connectivity features and energy-efficient designs, further strengthen replacement demand and premium segment expansion.
Canada Recreational Vehicles Market Trends
Canada represents the fastest-growing market in the North America Recreational Vehicles (RV) sector, projected to expand at a CAGR of 6.1% over the forecast period. Growth is driven by increasing domestic tourism, rising interest in nature-based travel, and expanding participation in outdoor recreational activities such as camping, hiking, fishing, and wildlife exploration. Canada’s vast natural landscapes and well-developed provincial and national park systems create a favorable environment for RV adoption. Additionally, a growing middle-class population and improving access to RV financing are supporting first-time ownership.
The shift toward flexible and cost-effective travel alternatives, particularly in response to fluctuating air travel costs and cross-border uncertainties, has further strengthened domestic RV demand. Rental platforms and peer-to-peer RV sharing models are also gaining traction, enabling younger consumers to experience RV travel before committing to ownership. Furthermore, increasing awareness of eco-friendly travel is encouraging demand for lightweight and fuel-efficient RV models. These factors collectively position Canada as the region’s most dynamic growth market.
Competitive Landscape
The Recreational Vehicles Market demonstrates moderate concentration with Thor Industries, Forest River Inc. (subsidiary of Berkshire Hathaway), and Winnebago Industries dominating market share through extensive brand portfolios spanning multiple RV categories and price points. Market leaders pursue expansion strategies through strategic acquisitions such as Thor Industries' €2.1 billion acquisition of Erwin Hymer Group in February 2019 establishing European leadership, brand portfolio optimization including March 2025 integration of Heartland Recreational Vehicles under Jayco, and geographic diversification balancing North American and European operations.
Key differentiators include vertically integrated manufacturing models with Tiffin Motorhomes strengthening operations through dedicated production lines for each motorhome segment at Red Bay, Alabama campus, dealer network density supporting aftermarket service, and innovation in electric powertrains with Winnebago's eRV2 and Forest River's Coachmen RVEX. Emerging business model trends focus on peer-to-peer rental platform partnerships with Outdoorsy and RVshare creating new revenue streams, subscription-based ownership models, and direct-to-consumer sales channels complementing traditional dealer networks.
Key Market Developments
- In February 2026, Tiffin Motorhomes announced plans to relocate Class C motorhome production to its primary manufacturing campus in Red Bay, Alabama effective May 2026, establishing dedicated production lines for each motorhome segment including Class A, Class B van, and standalone Class C lines to increase efficiency, consistency, and quality.
- In March 2025, Thor Industries announced strategic realignment integrating Heartland Recreational Vehicles under Jayco, Inc. to enhance operational efficiencies and streamline business processes, demonstrating portfolio optimization strategy following $400 million share buyback re-authorization in June 2025.
- In October 2024, Forest River Inc. announced closure of California-based manufacturing facilities in Hemet and Rialto impacting approximately 400 employees due to rising costs of doing business in the state, with one Hemet facility being converted into dedicated Forest River Service Center ensuring continued dealer and customer support while relocating production to Indiana facilities.
Companies Covered in North America Recreational Vehicles Market
- ALINER (Columbia Northwest, Inc.)
- Dethleffs GmbH & Co. KG
- Forest River Inc.
- Gulf Stream Coach, Inc.
- Hymer GmbH & Co. KG
- Northwood Manufacturing
- REV Recreation Group
- Swift Group Limited
- Thor Industries Inc.
- Trigona SA
- Winnebago Industries Inc.
- Triple E Recreational
- Pleasure-Way Industries
- Nexus RV LLC
- Tiffin Motorhomes Inc.
Frequently Asked Questions
The North America Recreational Vehicles Market is projected to reach US$ 83.0 Bn by 2033, growing from US$ 59.8 Bn in 2026 at a compound annual growth rate of 4.8% during the forecast period, driven by demographic transformation with Millennials and Gen Z representing 22% of owners, record 11.2 million U.S. households owning RVs, and RVIA reporting 2024 shipments increased 6.6% to 333,733 units.
Demographic transformation with Millennials and Gen Z embracing RV lifestyle is primary driver, with these groups now representing 22% of owners using RVs for median 30-32 days annually and showing 83-91% brand loyalty, while over 50 million Americans participate in camping activities annually supported by 13,000+ campgrounds, with 9.6 million additional households aspiring to buy RVs by 2026 according to RV Industry Association.
Travel Trailers & Campers hold the leading position with approximately 58% market share driven by lower price points compared to motorhomes, towing flexibility with existing vehicles, and strong appeal to younger demographics with 22% of Millennial/Gen Z buyers preferring conventional travel trailers, supported by RVDA reporting 273,700 U.S. retail travel trailer sales in 2019 demonstrating sustained segment popularity.
North America led by the United States maintains dominant global position with record 11.2 million RV-owning households as of 2024 up 26% from ten years ago, Indiana producing 84% of all U.S. and Canadian RVs, and RVIA reporting 2024 shipments increased 6.6% to 333,733 units concentrated in New York, New Jersey, California, and Pennsylvania dealer networks.
Peer-to-peer RV rental platforms including Outdoorsy and RVshare represent transformative opportunity creating $1.17 billion industry in 2025 by unlocking dormant inventory from 11.2 million RV-owning households to serve 708 million annual rental searches, with 15,000 Pro Hosts building commercial fleets while converting renters into future buyers through try-before-buy experiences expanding total addressable market.
Leading companies include Thor Industries Inc. with fiscal 2025 net sales of $2.5 billion following €2.1 billion Erwin Hymer Group acquisition establishing European leadership, Forest River Inc. (a Berkshire Hathaway subsidiary) showcasing 440+ floor plans including electric Coachmen RVEX at Expo 2025, and Winnebago Industries Inc. pioneering electrification with eRV2 prototype featuring seven-day boondocking capability through 900-watt solar and lithium battery integration.


