


- Executive Summary
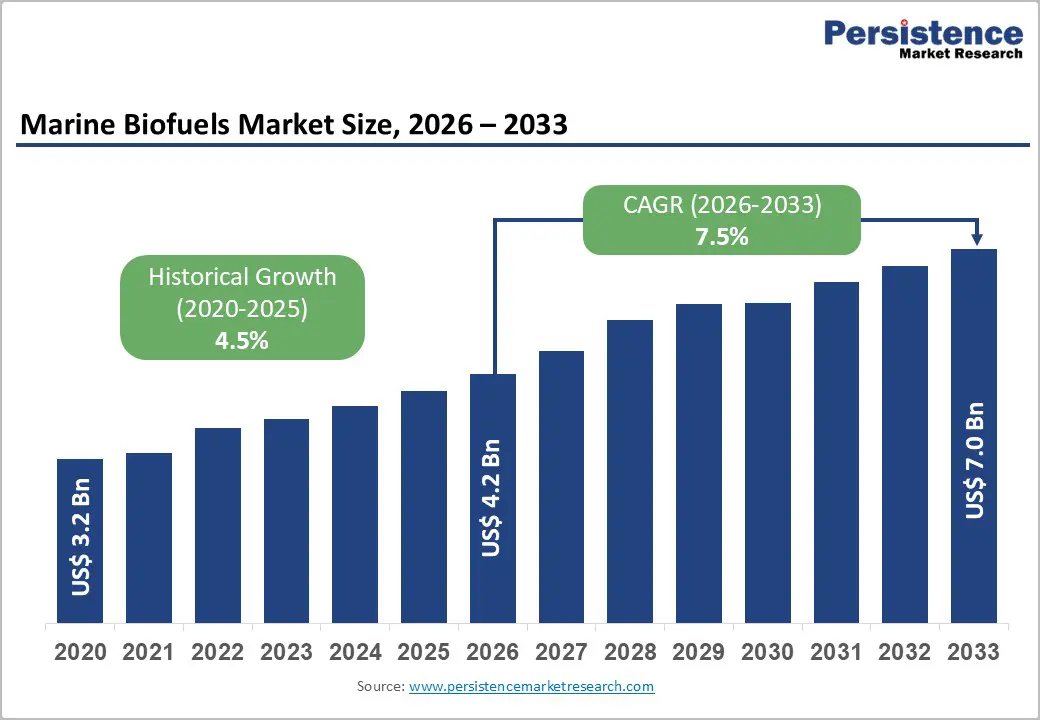
- Global Marine Biofuels Market Snapshot 2026 and 2033
- Market Opportunity Assessment, 2026-2033, US$ Mn
- Key Market Trends
- Industry Developments and Key Market Events
- Demand Side and Supply Side Analysis
- PMR Analysis and Recommendations
- Market Overview
- Market Scope and Definitions
- Value Chain Analysis
- Macro-Economic Factors
- Global GDP Outlook
- Global Biofuels Consumption Overview
- World Feedstock Crops for Biofuel Production
- World Marine Fleet Overview
- Biofuel Production by Key Countries
- Other Macro-economic Factors
- Forecast Factors - Relevance and Impact
- COVID-19 Impact Assessment
- PESTLE Analysis
- Porter's Five Forces Analysis
- Geopolitical Tensions: Market Impact
- Regulatory and Technology Landscape
- Market Dynamics
- Drivers
- Restraints
- Opportunities
- Trends
- Price Trend Analysis, 2020 - 2033
- Region-wise Price Analysis
- Price by Segments
- Price Impact Factors
- Global Marine Biofuels Market Outlook: Historical (2020 - 2025) and Forecast (2026 - 2033)
- Key Highlights
- Global Marine Biofuels Market Outlook: Fuel Type
- Introduction/Key Findings
- Historical Market Size (US$ Mn) and Volume (Tons) Analysis by Fuel Type, 2020-2025
- Current Market Size (US$ Mn) and Volume (Tons) Forecast, by Fuel Type, 2026-2033
- FAME/Biodiesel
- HVO (Renewable Diesel)
- Ethanol
- Biomethanol
- BioLNG
- Others
- Others
- Market Attractiveness Analysis: Fuel Type
- Global Marine Biofuels Market Outlook: Feedstock
- Introduction/Key Findings
- Historical Market Size (US$ Mn) and Volume (Tons) Analysis by Feedstock, 2020-2025
- Current Market Size (US$ Mn) and Volume (Tons) Forecast, by Feedstock, 2026-2033
- Sugarcane
- Corn
- Vegetable Oil
- Castor Oil
- Biomass
- Others
- Market Attractiveness Analysis: Feedstock
- Global Marine Biofuels Market Outlook: Form
- Introduction/Key Findings
- Historical Market Size (US$ Mn) and Volume (Tons) Analysis by Form, 2020-2025
- Current Market Size (US$ Mn) and Volume (Tons) Forecast, by Form, 2026-2033
- Liquid
- Gas
- Market Attractiveness Analysis: Form
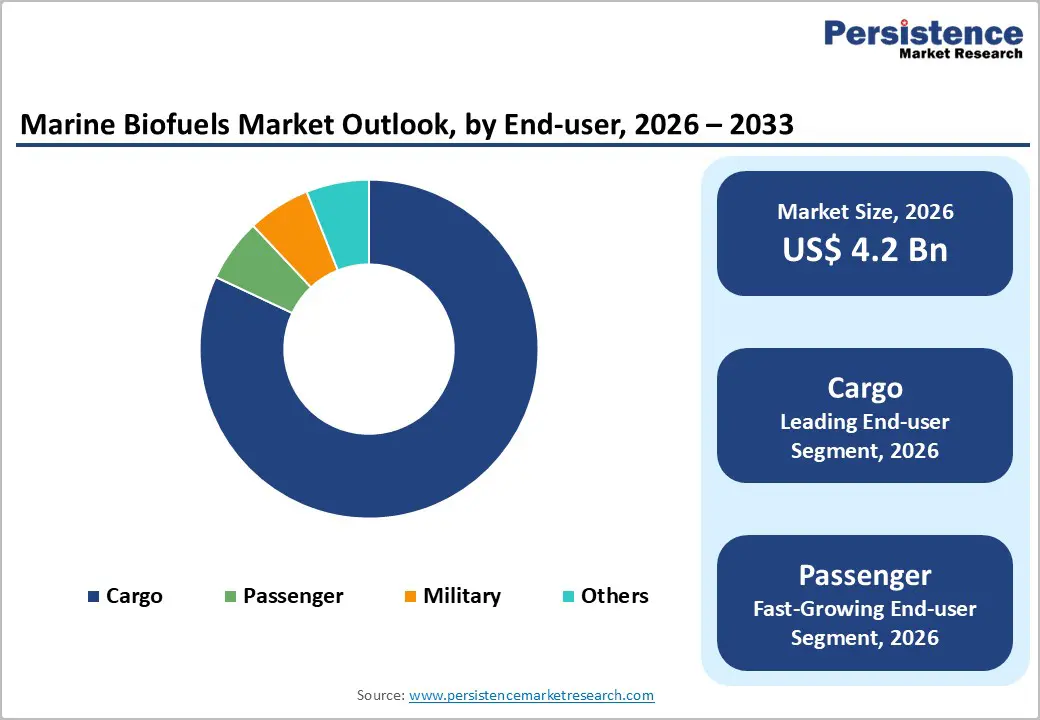
- Global Marine Biofuels Market Outlook: Vessel Type
- Introduction/Key Findings
- Historical Market Size (US$ Mn) and Volume (Tons) Analysis by Vessel Type, 2020-2025
- Current Market Size (US$ Mn) and Volume (Tons) Forecast, by Vessel Type, 2026-2033
- Passenger
- Cargo
- Military
- Others
- Market Attractiveness Analysis: Vessel Type
- Global Marine Biofuels Market Outlook: Region
- Key Highlights
- Historical Market Size (US$ Mn) and Volume (Tons) Analysis by Region, 2020-2025
- Current Market Size (US$ Mn) and Volume (Tons) Forecast, by Region, 2026-2033
- North America
- Europe
- East Asia
- South Asia & Oceania
- Latin America
- Middle East & Africa
- Market Attractiveness Analysis: Region
- North America Marine Biofuels Market Outlook: Historical (2020 - 2025) and Forecast (2026 - 2033)
- Key Highlights
- Pricing Analysis
- North America Market Size (US$ Mn) and Volume (Tons) Forecast, by Country, 2026-2033
- U.S.
- Canada
- North America Market Size (US$ Mn) and Volume (Tons) Forecast, by Fuel Type, 2026-2033
- FAME/Biodiesel
- HVO (Renewable Diesel)
- Ethanol
- Biomethanol
- BioLNG
- Others
- Others
- North America Market Size (US$ Mn) and Volume (Tons) Forecast, by Feedstock, 2026-2033
- Sugarcane
- Corn
- Vegetable Oil
- Castor Oil
- Biomass
- Others
- North America Market Size (US$ Mn) and Volume (Tons) Forecast, by Form, 2026-2033
- Liquid
- Gas
- North America Market Size (US$ Mn) and Volume (Tons) Forecast, by Vessel Type, 2026-2033
- Passenger
- Cargo
- Military
- Others
- Europe Marine Biofuels Market Outlook: Historical (2020 - 2025) and Forecast (2026 - 2033)
- Key Highlights
- Pricing Analysis
- Europe Market Size (US$ Mn) and Volume (Tons) Forecast, by Country, 2026-2033
- Germany
- Italy
- France
- U.K.
- Spain
- Russia
- Rest of Europe
- Europe Market Size (US$ Mn) and Volume (Tons) Forecast, by Fuel Type, 2026-2033
- FAME/Biodiesel
- HVO (Renewable Diesel)
- Ethanol
- Biomethanol
- BioLNG
- Others
- Others
- Europe Market Size (US$ Mn) and Volume (Tons) Forecast, by Feedstock, 2026-2033
- Sugarcane
- Corn
- Vegetable Oil
- Castor Oil
- Biomass
- Others
- Europe Market Size (US$ Mn) and Volume (Tons) Forecast, by Form, 2026-2033
- Liquid
- Gas
- Europe Market Size (US$ Mn) and Volume (Tons) Forecast, by Vessel Type, 2026-2033
- Passenger
- Cargo
- Military
- Others
- East Asia Marine Biofuels Market Outlook: Historical (2020 - 2025) and Forecast (2026 - 2033)
- Key Highlights
- Pricing Analysis
- East Asia Market Size (US$ Mn) and Volume (Tons) Forecast, by Country, 2026-2033
- China
- Japan
- South Korea
- East Asia Market Size (US$ Mn) and Volume (Tons) Forecast, by Fuel Type, 2026-2033
- FAME/Biodiesel
- HVO (Renewable Diesel)
- Ethanol
- Biomethanol
- BioLNG
- Others
- Others
- East Asia Market Size (US$ Mn) and Volume (Tons) Forecast, by Feedstock, 2026-2033
- Sugarcane
- Corn
- Vegetable Oil
- Castor Oil
- Biomass
- Others
- East Asia Market Size (US$ Mn) and Volume (Tons) Forecast, by Form, 2026-2033
- Liquid
- Gas
- East Asia Market Size (US$ Mn) and Volume (Tons) Forecast, by Vessel Type, 2026-2033
- Passenger
- Cargo
- Military
- Others
- South Asia & Oceania Marine Biofuels Market Outlook: Historical (2020 - 2025) and Forecast (2026 - 2033)
- Key Highlights
- Pricing Analysis
- South Asia & Oceania Market Size (US$ Mn) and Volume (Tons) Forecast, by Country, 2026-2033
- India
- Southeast Asia
- ANZ
- Rest of SAO
- South Asia & Oceania Market Size (US$ Mn) and Volume (Tons) Forecast, by Fuel Type, 2026-2033
- FAME/Biodiesel
- HVO (Renewable Diesel)
- Ethanol
- Biomethanol
- BioLNG
- Others
- Others
- South Asia & Oceania Market Size (US$ Mn) and Volume (Tons) Forecast, by Feedstock, 2026-2033
- Sugarcane
- Corn
- Vegetable Oil
- Castor Oil
- Biomass
- Others
- South Asia & Oceania Market Size (US$ Mn) and Volume (Tons) Forecast, by Form, 2026-2033
- Liquid
- Gas
- South Asia & Oceania Market Size (US$ Mn) and Volume (Tons) Forecast, by Vessel Type, 2026-2033
- Passenger
- Cargo
- Military
- Others
- Latin America Marine Biofuels Market Outlook: Historical (2020 - 2025) and Forecast (2026 - 2033)
- Key Highlights
- Pricing Analysis
- Latin America Market Size (US$ Mn) and Volume (Tons) Forecast, by Country, 2026-2033
- Brazil
- Mexico
- Rest of LATAM
- Latin America Market Size (US$ Mn) and Volume (Tons) Forecast, by Fuel Type, 2026-2033
- FAME/Biodiesel
- HVO (Renewable Diesel)
- Ethanol
- Biomethanol
- BioLNG
- Others
- Others
- Latin America Market Size (US$ Mn) and Volume (Tons) Forecast, by Feedstock, 2026-2033
- Sugarcane
- Corn
- Vegetable Oil
- Castor Oil
- Biomass
- Others
- Latin America Market Size (US$ Mn) and Volume (Tons) Forecast, by Form, 2026-2033
- Liquid
- Gas
- Latin America Market Size (US$ Mn) and Volume (Tons) Forecast, by Vessel Type, 2026-2033
- Passenger
- Cargo
- Military
- Others
- Middle East & Africa Marine Biofuels Market Outlook: Historical (2020 - 2025) and Forecast (2026 - 2033)
- Key Highlights
- Pricing Analysis
- Middle East & Africa Market Size (US$ Mn) and Volume (Tons) Forecast, by Country, 2026-2033
- GCC Countries
- South Africa
- Northern Africa
- Rest of MEA
- Middle East & Africa Market Size (US$ Mn) and Volume (Tons) Forecast, by Fuel Type, 2026-2033
- FAME/Biodiesel
- HVO (Renewable Diesel)
- Ethanol
- Biomethanol
- BioLNG
- Others
- Others
- Middle East & Africa Market Size (US$ Mn) and Volume (Tons) Forecast, by Feedstock, 2026-2033
- Sugarcane
- Corn
- Vegetable Oil
- Castor Oil
- Biomass
- Others
- Middle East & Africa Market Size (US$ Mn) and Volume (Tons) Forecast, by Form, 2026-2033
- Liquid
- Gas
- Middle East & Africa Market Size (US$ Mn) and Volume (Tons) Forecast, by Vessel Type, 2026-2033
- Passenger
- Cargo
- Military
- Others
- Competition Landscape
- Market Share Analysis, 2025
- Market Structure
- Competition Intensity Mapping
- Competition Dashboard
- Company Profiles
- ExxonMobil
- Company Overview
- Product Portfolio/Offerings
- Key Financials
- SWOT Analysis
- Company Strategy and Key Developments
- BP plc
- Cargill
- Neste Oil
- Chevron Corporation
- World Energy
- GoodFuels
- Uniper Energy
- Dansuk Industrial
- Cepsa
- Gevo
- TotalEnergies
- UPM
- Emami Group
- ExxonMobil
- Appendix
- Research Methodology
- Research Assumptions
- Acronyms and Abbreviations

Loading page data
Please wait a moment


