


- Specialty & Fine Chemicals
- Food Grade Ethanol Market
Food Grade Ethanol Market Size, Share, and Growth Forecast, 2026 - 2033
Food Grade Ethanol Market by Source Type (Sugarcane-based Ethanol, Grain-based Ethanol, Fruit-based Ethanol, Others), Application (Flavoring Agent, Food Coloring, Plum Pudding, Fruitcake, Candies, Brandied Fruits, Food Preservatives) and Regional Analysis for 2026 - 2033
Food Grade Coloring Market Size and Trends Analysis
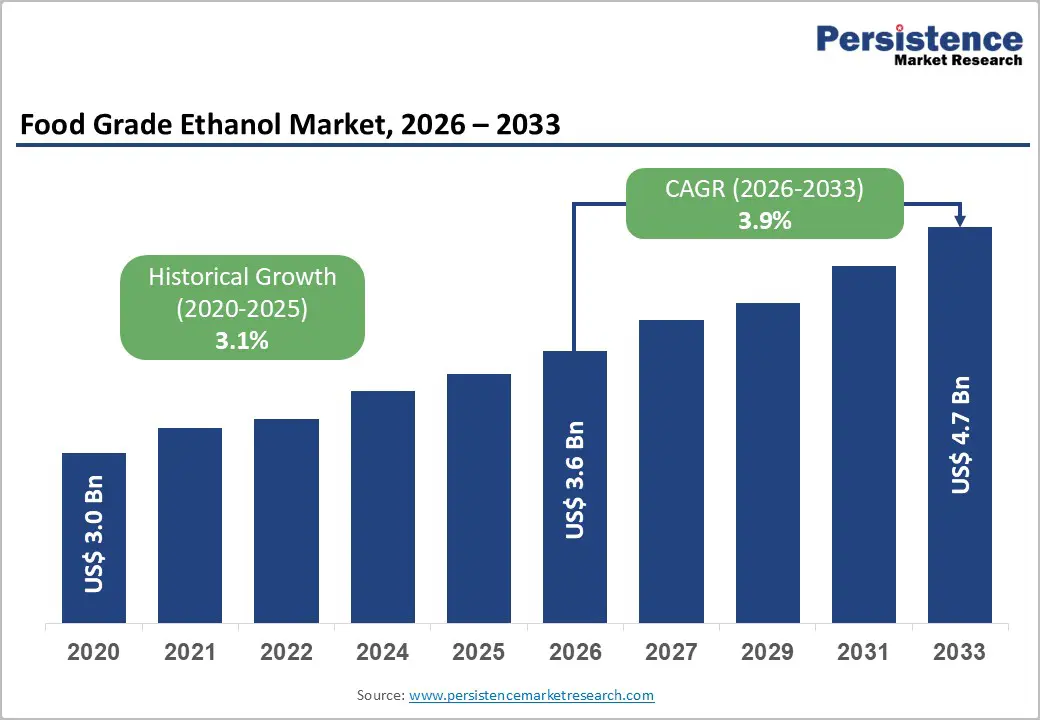
The global food-grade ethanol market size is likely to be valued at US$ 3.6 billion in 2026, and is projected to reach US$ 4.7 billion by 2033, growing at a CAGR of 3.9% during the forecast period of 2026–2033. Demand has been rising as manufacturers shift toward natural ingredient systems and brands increasingly use ethanol as a preservative and flavor carrier in packaged formats.
Emerging economies have been contributing steadily because processed food consumption is expanding and because producers are scaling formulations that need stable, food-compliant solvents. Regulatory harmonization has reduced complexity for multi-country product launches, and improved fermentation efficiency has lowered production variability, supporting predictable sourcing programs for food processors. Premium food categories continue to grow, creating room for suppliers who can document traceability, deliver consistent organoleptic performance, and meet tighter customer specifications. Procurement leaders will have strengthened supply resilience by qualifying multiple compliant sources and by aligning contracts with quality metrics that match end-use risk, especially for export-oriented products.
Key Industry Highlights
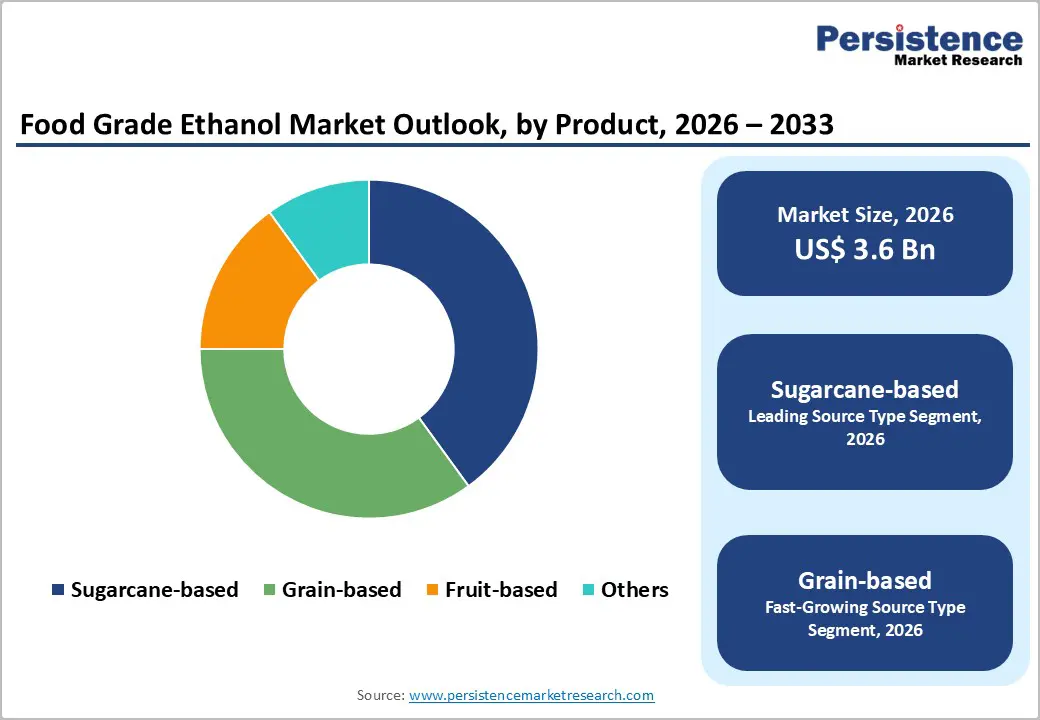
- Dominant Source: Sugarcane-based ethanol is expected to lead the market with an estimated 40% revenue share in 2026, supported by high fermentation efficiency and established production bases.
- Fastest-growing Source: Grain-based ethanol is projected to grow at the fastest rate, a 4.4% CAGR through 2033, driven by feedstock availability and process optimization.
- Leading Application: Flavoring agents are anticipated to dominate with approximately 30% share in 2026, driven by their widespread use in confectionery and bakery products
- Fastest-growing Application: Food preservatives are likely to post the highest 2026-2033 CAGR of 4.6%, reflecting rising clean-label and shelf-life extension requirements.
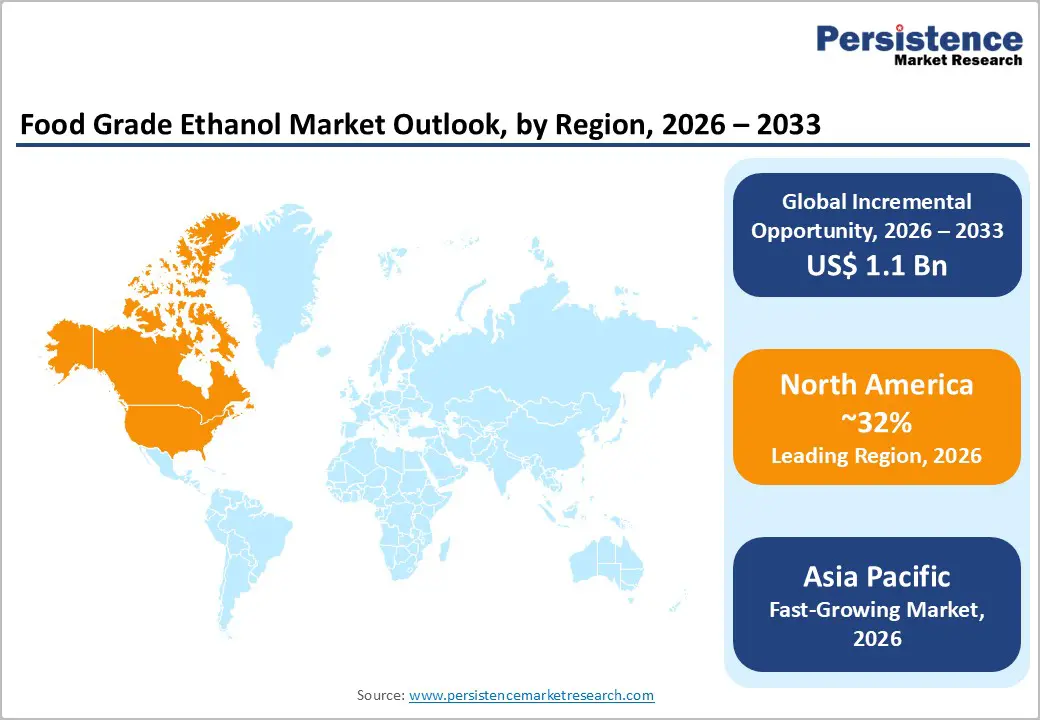
- Regional Leadership: North America is projected to capture an estimated 32% share in 2026, while Asia Pacific is forecast to be the fastest-growing market at a CAGR of 4.5% during 2026–2033, led by expanding food manufacturing capacity.
- Technology and Cost Dynamics: Advancements in fermentation efficiency and high-purity distillation technologies are improving yield consistency and reducing per-unit production costs.
| Key Insights | Details |
|---|---|
|
Food Grade Ethanol Market Size (2026E) |
US$ 3.6 Bn |
|
Market Value Forecast (2033F) |
US$ 4.7 Bn |
|
Projected Growth (CAGR 2026 to 2033) |
3.9% |
|
Historical Market Growth (CAGR 2020 to 2025) |
3.1% |
Market Factors - Growth, Barriers, and Opportunity Analysis
Rising Adoption of Food-Grade Ethanol in Processed Foods
The growing dominance of processed and ultra-processed foods in urban diets is directly increasing the use of food-grade ethanol as a functional ingredient in food manufacturing. As per a 2025 public health assessment by the U.S. Centers for Disease Control and Prevention (CDC), based on 2021–2023 consumption data, ultra-processed foods account for around 55% of total daily caloric intake globally, with adult consumption exceeding 53% and youth intake approaching 62%. This high reliance on processed foods intensifies demand for ingredients that support flavor solubility, microbial control, and shelf-life stability. Food-grade ethanol is therefore increasingly used in candies, fruitcakes, plum puddings, and brandied fruits, where it acts as both a flavor carrier and a natural preservative, particularly in urban and export-oriented food categories.
This demand trend is reinforced by urbanization-driven dietary shifts across both high-income and middle-income economies, where processed foods frequently account for more than half of dietary energy intake. In 2025, food regulators in major consuming regions continued to permit ethanol under clearly defined purity and usage thresholds, enabling manufacturers to replace synthetic solvents and preservatives in processed food formulations. The ethanol producers, particularly in Asia, upgraded fermentation and high-precision distillation systems to meet stricter food-grade purity requirements imposed by developed import markets. These upgrades allowed exporters of confectionery and fruit-based products to comply with tightening quality norms, translating into more consistent, long-term procurement of food-grade ethanol by processed food manufacturers.
Feedstock Cost Imbalance and Policy-Driven Allocation Challenges
The economics of food-grade ethanol production are significantly constrained by the structure and allocation of feedstock prices, especially when sugarcane and grain inputs compete with broader food markets. Despite India’s position as a leading global ethanol producer, policy allocations in the 2025–26 ethanol supply year limited sugarcane-based ethanol to roughly 28% of total procurement, with grain-based routes dominating at 72%, reshaping feedstock economics for ethanol producers. This disproportionate allocation has arisen despite sugar mills investing over INR 40,000 crore (around US$ 4.8 billion) in ethanol capacity, compressing margins for sugarcane ethanol producers and threatening timely cane payments to farmers.
The unchanged ethanol procurement prices from sugarcane pathways have not kept pace with rising cane production costs, with sugarcane fair and remunerative prices increasing by over 16% since 2022–23, while ethanol prices remained flat. This mismatch reduces economic incentives for sugar-based producers to supply ethanol, pushing producers toward grain and alternative feedstock sources whose pricing frameworks differ, and elevating overall input uncertainty for food-grade ethanol processors.
Growth through Strategic Production and Integration
The food-grade ethanol market is benefiting from strategic production models and co-product optimization. In 2025, audited data from ePURE and European Union (EU) renewable ethanol producers based on 2024 operations revealed that approximately 5.4 million tons (6.8 billion liters) of renewable ethanol were produced, alongside 6.9 million tons of food and feed co-products, including high-protein animal feed. This highlights that co-product outputs now exceed fuel volumes from the same feedstock. At the same time, ePURE members collectively represent ~85% of the EU’s installed renewable ethanol capacity, suitable for flavoring, preservation, and other functional applications. These facilities also delivered average GHG savings of 79% compared to fossil fuels, supporting sustainability goals that are increasingly important to food manufacturers. Advanced purification and distillation processes in these plants further ensure compliance with stringent food-grade quality standards, enhancing adoption in premium and clean-label products.
The strategic acquisitions and integration of ethanol processing are creating parallel opportunities. Cargill completed the acquisition of the remaining stake in Brazil’s SJC Bioenergia, strengthening its integrated processing footprint and raw material control. This allows for more reliable production of high-purity ethanol that meets food-grade requirements, alongside fuel ethanol. The integration also facilitates better feedstock management and economies of scale, lowering operational risks for food-grade applications such as flavoring agents and preservatives. These developments highlight that investments in capacity expansion and supply chain integration are directly enabling the availability of consistent, high-quality ethanol for processed foods. As global demand for clean-label and shelf-stable products grows, such strategic initiatives position producers to capture a greater share of both domestic and export-oriented food markets.
Category-wise Analysis
Source Type Insights
Sugarcane-based ethanol is expected to be the leading source type, estimated to hold 40% of the food-grade ethanol market revenue share in 2026, driven by its efficient conversion profile and high sucrose content that yields consistent ethanol quality. This source benefits from well-integrated production ecosystems, particularly in Brazil and India, where sugar mills have co-located distillation facilities that produce food-grade streams alongside sugar and feed outputs. The relatively lower impurity profile of sugarcane ethanol makes it attractive for flavor-sensitive food applications, where solvent quality directly impacts organoleptic properties. In Brazil, ongoing investments in sugarcane processing upgrades are enabling higher-purity ethanol streams, reinforcing a stable supply for domestic and export food processors. Governments in sugarcane-rich regions continue to link ethanol procurement with agricultural support programs, incentivizing crop diversion into food-grade supply chains.
Grain-based ethanol is projected to be the fastest-growing source segment, growing at a 4.4% CAGR from 2026 to 2033, supported by abundant cereal supplies in the United States, Europe, and China. Proximity to major food processing hubs and well-established dry-mill technologies reduces logistical costs and accelerates integration into large-volume uses such as preservation solutions and confectionery coatings. In the U.S. Midwest, capacity expansions announced in 2025 by major mill operators are explicitly allocating incremental output to food-grade lines, reflecting broadening end-use diversification beyond fuel markets. These facilities benefit from robust grain logistics networks and reliable quality control, enabling faster turnaround and regulatory compliance for food applications. The growth of grain-based ethanol is also buoyed by feedstock policy adjustments in key markets that stabilize cereal prices, making procurement more predictable for food processors.
Application Insights
Flavoring applications are set to dominate, accounting for an estimated 30% of the total product demand in 2026. Ethanol’s excellent solvent properties enable efficient extraction and stabilization of natural flavors from botanicals, spice extracts, and fruit essences, which are then incorporated into beverages, confectionery, and bakery products. This segment’s leadership reflects both consumer preference shifts toward natural and authentic flavor profiles and a broad base of formulation requirements in mainstream food products globally. Fast-moving consumer goods manufacturers across North America and Europe have publicly expanded their flavor lines to include ethanol-extracted ingredients, underscoring the strategic importance of this application.
Food preservative applications are projected to be the fastest-growing segment, with a CAGR of approximately 4.6% through 2033, reflecting the rapid adoption of ethanol’s antimicrobial properties in shelf-stable products. Food-grade ethanol is increasingly deployed in fruit preservation, candies, baked goods, and ready-to-eat lines, where it serves as an effective alternative to synthetic preservatives in clean-label formulations. Demand is particularly strong in export-oriented food sectors where extended shelf life and regulatory compliance are critical for access to developed markets. In 2025, regional food authorities updated acceptable use thresholds, broadening ethanol’s applicability as a preservative in packaged fruit products, thereby supporting its rising utilization.
Regional Insights
North America Food Grade Ethanol Market Trends
North America is expected to dominate with an estimated 32% of the food-grade ethanol market share in 2026, with the United States as the primary contributor. The region’s mature food processing ecosystem, large beverage industry, and strong regulatory clarity from the U.S. Food and Drug Administration (FDA) ensure steady demand for ethanol in flavor extraction, clean-label preservatives, and natural solvent applications. Advanced fermentation and distillation infrastructure in the Midwest and Gulf Coast supports a reliable supply of high-purity ethanol directly to food manufacturing clusters, reinforcing North America’s leadership position.
The regional market has seen continued investment in production efficiency and purification upgrades across ethanol facilities to meet stricter food-grade quality standards. These initiatives enhance batch consistency, reduce impurity levels, and improve turnaround times, enabling processors to supply premium confectionery, beverages, and other processed foods with dependable high-purity ethanol. The focus on technology-driven optimization rather than large-scale capacity expansion highlights North America’s strategic approach to maintaining a stable, high-quality supply for the food and beverage industry.
Europe Food Grade Ethanol Market Trends
Europe has emerged as a pivotal hub in the food-grade ethanol market, with Germany, the United Kingdom, France, and Spain leading production and consumption efforts. Unified regulatory frameworks under the EU food additive standards have facilitated seamless cross-border commerce for ethanol-based products. Shoppers across bakery, confectionery, and beverage sectors have increasingly sought clean-label alternatives, which has elevated food-grade ethanol as an indispensable component in both luxury and everyday formulations. Processors who emphasize supply chain transparency and eco-friendly sourcing have gained stronger market positioning, particularly when targeting export channels that demand rigorous certification.
One example is CropEnergies, which recently launched a specialized purification facility for food-grade ethanol in the Rhine-Ruhr area to address surging needs from regional manufacturers. This expansion has bolstered local availability of ultra-pure supplies while integrating advanced tracking mechanisms compliant with EU safety protocols. Government support for low-emission processes and emissions disclosure has spurred further capital commitments, bridging food applications with biofuel initiatives. Leaders evaluating regional investments will have maximized advantages by aligning operations with these sustainability mandates, ensuring resilience amid evolving consumer and compliance landscapes.
Asia Pacific Food Grade Ethanol Market Trends
Asia Pacific is projected to be the fastest-growing regional market for food-grade ethanol, expanding at a CAGR exceeding 4.5% through 2033, driven by rapid growth in processed food manufacturing and rising export volumes. China and India are key volume drivers, with expanding bakery, confectionery, and fruit processing industries, while Japan and ASEAN economies emphasize high-purity applications for premium beverages and botanical extractions. Lower feedstock costs and broad agricultural bases enable competitive production economics relative to other regions.
In 2025, the Government of Maharashtra, India, announced a food-grade ethanol incentives scheme, offering enhanced procurement pricing and logistics support for distilleries allocating a portion of output to food-grade specification. This policy initiative aims to link local sugarcane production with value-added ethanol applications, encouraging producers to invest in purification upgrades. Separately, a major Chinese fermentation firm completed a new distillation and quality control facility in Shandong Province, expanding its ability to supply food-grade ethanol to domestic beverages and confectionery manufacturers. These developments demonstrate a strong regional commitment to developing reliable, high-purity ethanol supply chains to support the rapid growth trajectory of the Asia-Pacific market.
Competitive Landscape
The global food-grade ethanol market has maintained a moderately consolidated structure, spearheaded by key producers such as Cargill, Archer Daniels Midland (ADM), Green Plains Inc., and Wilmar International. These organizations have secured their dominance through seamless integration of raw material procurement, expansive distillation facilities, and enduring partnerships with beverage and processed food entities. Operators have prioritized ultra-pure output, adherence to stringent safety norms, and uninterrupted delivery, bolstered by ongoing upgrades to fermentation and purification systems. Strategic planners have recognized that such vertical control not only stabilizes costs but also fortifies resilience against feedstock volatility in competitive landscapes.
Regional specialists across Europe, North America, and the Asia Pacific have carved niches in targeted uses such as aroma recovery and preservation for international markets. Formidable obstacles, including rigorous hygiene certifications, heavy capital outlays for refining equipment, and comprehensive origin tracking, have deterred fresh competitors. Larger firms will pursue accelerated mergers and expand regional footholds, while smaller suppliers forge alliances with processors to lock in enduring agreements. Entities pursuing expansion will have sharpened their edge by blending scale efficiencies with bespoke service models that anticipate evolving demands in premium formulations.
Key Industry Developments
- In October 2025, the United States finalized new trade agreements and frameworks with Malaysia, Cambodia, Thailand, and Vietnam to expand market access for U.S. goods, including ethanol and agricultural feedstocks. Malaysia and Cambodia signed reciprocal agreements opening their markets to U.S. fuel ethanol, while Thailand and Vietnam entered framework pacts to reduce trade barriers and increase imports. These agreements are expected to strengthen U.S. ethanol exports to Southeast Asia, supporting demand across fuel, industrial, and downstream food-grade supply chains.
- In September 2025, India inaugurated its first bamboo-based ethanol plant in Golaghat, Assam, processing five lakh tons of bamboo annually to produce 48,900 MT ethanol plus co-products such as acetic acid, furfural, and liquid CO2. The facility promotes energy self-sufficiency, rural development with INR 200 crore annual boost to Assam's economy, and sustainability using non-food biomass.
- In June 2025, Grainspan Nutrients invested INR 520 crore in two grain-based ethanol plants in Ahmedabad, raising its total capacity to 350 kiloliters per day and aligning with India’s Ethanol Blending Programme. Both units are supplying fuel-grade ethanol to Oil Marketing Companies at INR 72 per liter, with expected deliveries of about eight crore liters in ESY 2024–25 and a targeted topline above INR 800 crore, reinforcing Grainspan’s role in Gujarat’s green fuel push.
Companies Covered in Food Grade Ethanol Market
- Cargill Incorporated
- Archer Daniels Midland
- Wilmar International
- Green Plains Inc.
- Raízen
- COFCO Group
- Cristal Union
- Tereos Group
- MGP Ingredients
- Manildra Group
- Balrampur Chini Mills
- Godavari Biorefineries
Frequently Asked Questions
The global food grade ethanol market is projected to reach US$ 3.6 billion by 2026.
Key growth drivers include rising demand for clean-label ingredients, increasing use of ethanol as a natural solvent and preservative, expanding food exports, and stricter quality and safety standards across global food supply chains.
The market is poised to witness a CAGR of 3.9% from 2026 to 2033.
Opportunities lie in high-purity ethanol applications, premium food and beverage formulations, fermentation-based ingredient innovation, and capacity expansion in cost-competitive markets aligned with export demand.
Leading participants include Archer Daniels Midland (ADM), Cargill, Wilmar International, Green Plains, and Godavari Biorefineries, alongside regional producers.


