


- Processed Food
- Fish Processing Market
Fish Processing Market Size, Share, and Growth Forecast 2026 - 2033
Fish Processing Market by Processing Type (Fresh, Frozen, Smoked, Dried, Canned), Species Type (Salmon, Tuna, Cod, Sardine), Distribution Channel (Retail Stores, Online, Foodservice), Regional Analysis, 2026 - 2033
Fish Processing Market Share and Trends Analysis
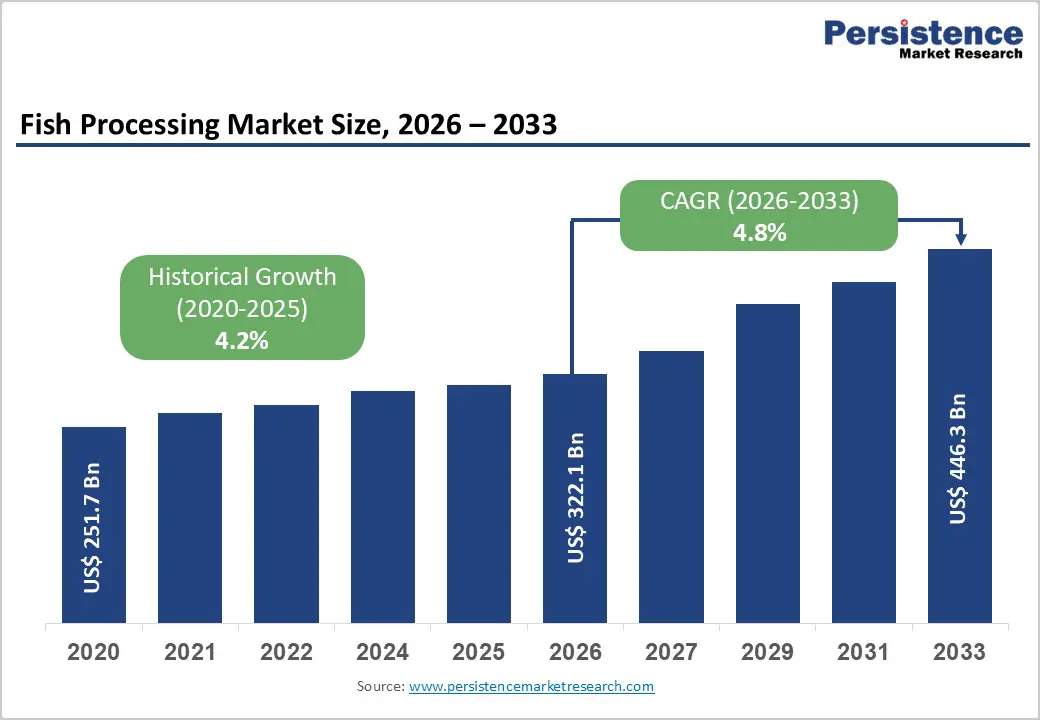
The global fish processing market size is expected to be valued at US$ 322.1 billion in 2026 and projected to reach US$ 446.3 billion by 2033, growing at a CAGR of 4.8% between 2026 and 2033.
The fish processing market covers primary processing (heading, gutting, filleting, freezing, glazing, packing) and secondary processing (portioning, smoking, drying, canning, marination, breading, and ready-to-cook preparation) that convert aquatic raw materials into safe, standardized, trade-ready products. The Food and Agriculture Organization (FAO) emphasizes that processing and storage are central to minimizing spoilage by bacteria and extending shelf life for chilled, frozen, smoked, dried, and canned products.
Key Industry Highlights:
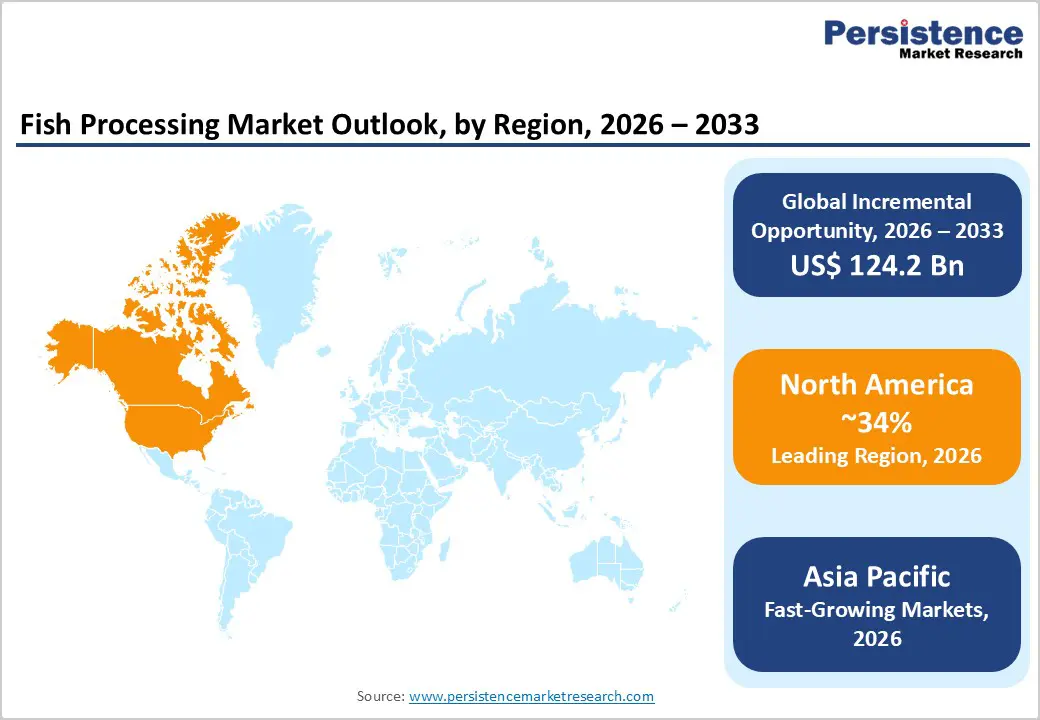
- Leading Region: North America is expected to lead in 2026, supported by high seafood consumption (around 19.7 pounds per capita in the U.S. in 2022), advanced cold-chain infrastructure, and stringent FDA Seafood HACCP enforcement under 21 CFR Part 123, favoring large processors with robust controls and traceability.
- Fastest-Growing Region: Asia Pacific is expected to grow fastest, as Asia is projected to account for approximately 88% of global aquaculture output by 2034, thereby strengthening upstream raw material availability and supporting the expansion of freezing, canning, and value-added processing clusters.
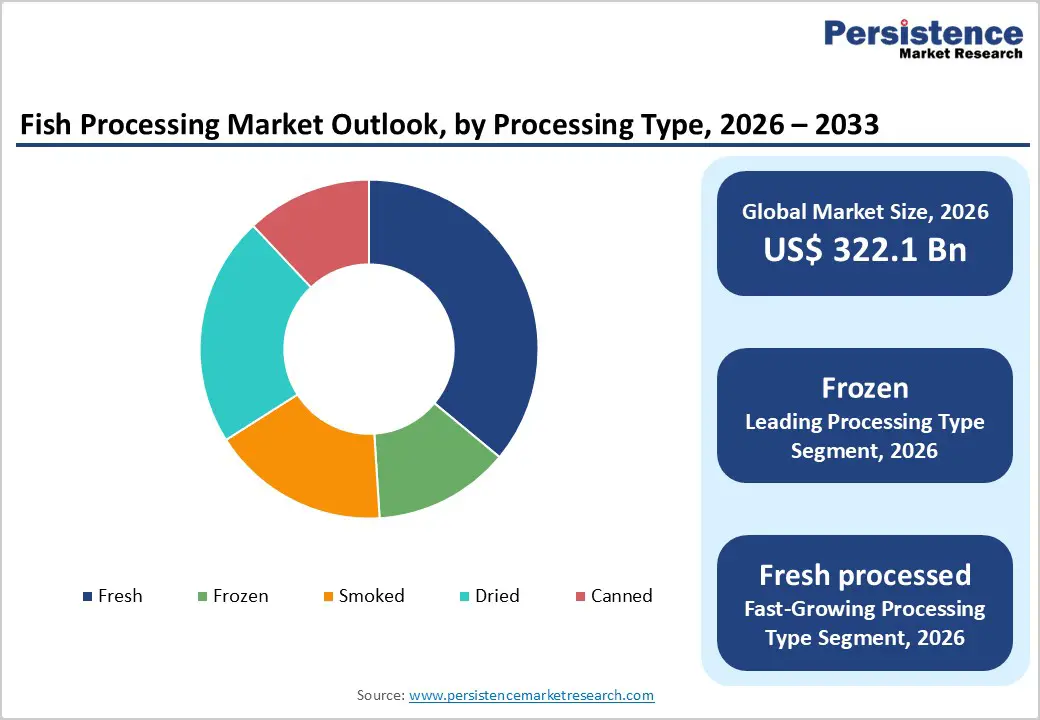
- Dominant Processing Segment: The frozen processing type remains dominant, with an estimated 36% share in 2025, consistent with FAO utilization data indicating that about 35% of aquatic animal foods for human consumption were distributed in frozen form in 2022, making freezing a core preservation and trade pathway.
- Fastest Growing Segment: Fresh processed (premium chilled, portioned, branded products) is expanding rapidly; in the U.S. retail data for 2017-2019, fresh delivered roughly 43.3% of seafood revenue while accounting for only 35.4% of volume, validating a strong price premium for tightly controlled chilled processing.
| Key Insights | Details |
|---|---|
| Fish Processing Size (2026E) | US$ 322.1 billion |
| Market Value Forecast (2033F) | US$ 446.3 billion |
| Projected Growth CAGR (2026 - 2033) | 4.8% |
| Historical Market Growth (2020 - 2025) | 4.2% |
Market Dynamics
Drivers - Aquaculture scale-up and rising “processed-for-trade” volumes
Processing growth accelerates when supply becomes scalable and standardized. In 2022, global aquatic animal production was approximately 185.4 million tonnes, of which aquaculture accounted for roughly 94.4 million tonnes, representing approximately 51% of total aquatic animal output. Farmed fish and shrimp typically exhibit more uniform size distributions and predictable harvest schedules, which significantly improve line efficiency for filleting, portioning, and freezing. FAO utilization data indicate that aquatic animal foods for human consumption were distributed in 2022 among frozen (35%), prepared/preserved (12%), and cured (10%) forms, underscoring the structural role of processing beyond strictly fresh consumption. This combination of volume and standardization supports heavy investment in automated grading, deboning, packaging, and labeling designed for large export and retail programs.
Restraints - Biological and climate-driven constraints on wild-capture supply
Processing plants that depend heavily on capture fisheries face significant utilization risk because stock health and catch limits ultimately constrain the availability of raw materials. FAO estimates indicate that only about 62.3% of assessed marine fish stocks were within biologically sustainable levels in 2021, implying tighter long-term catch ceilings and greater uncertainty for some key species. Climate variability compounds these pressures through shifting migration routes, changing seasonality, and more frequent marine heatwaves, all of which affect catch composition and timing. For processors, these dynamics can lead to underutilization of fixed assets, forced species substitution, higher procurement costs, and more complex production planning, particularly in single-species or regionally concentrated plants.
Rising cost of compliance across HACCP, hygiene approvals, and import controls
Rising costs of regulatory compliance across HACCP systems, hygiene certifications, and import-export controls act as a major restraint for the fish processing market. Processors must invest continuously in facility upgrades, sanitation infrastructure, cold-chain monitoring, traceability software, employee training, and frequent third-party audits to meet evolving food safety standards. Smaller and mid-sized processors face particular pressure, as these fixed compliance expenses significantly increase operating costs and reduce profit margins. In export-oriented operations, strict border inspections, residue testing, labeling rules, and documentation requirements further increase administrative burdens and shipment delays, thereby raising logistics costs and working capital requirements. Regulatory variations across countries also complicate cross-border trade, forcing companies to maintain multiple certifications for different destinations. Together, these factors slow capacity expansion, discourage new market entrants, and constrain overall industry growth despite rising global seafood demand.
Opportunity - Rising demand for protein-rich and healthy diets
Rising demand for protein-rich and healthy diets is a major growth driver for the fish processing market, as consumers increasingly shift toward seafood as a lean, nutritious alternative to red and processed meats. Fish is widely recognized for its high-quality protein content, low levels of saturated fat, and abundance of omega-3 fatty acids, which are associated with cardiovascular health, brain development, and reduced inflammation. Growing health awareness, an aging population, and preventive-health lifestyles are encouraging households to incorporate seafood into regular meal planning. This trend is further supported by dietary guidelines from public health authorities that recommend fish consumption as part of a balanced diet. Processed fish products such as frozen fillets, canned tuna, smoked salmon, and ready-to-cook portions make seafood more accessible to time-constrained consumers while preserving nutritional value. As urbanization rises and modern retail expands, demand for hygienically processed, portion-controlled, and traceable fish products is expected to strengthen steadily across both developed and emerging markets.
Category-wise Analysis
Processing Type Insights
The frozen segment is the leading processing type, with an estimated market share of approximately 36% in 2025, as it optimally balances safety, shelf life, quality retention, and logistics efficiency. In major markets such as the United States, frozen seafood accounted for approximately 42.0% of retail seafood sales volume during 2017-2019, surpassing fresh in volume terms and reflecting consumers’ preference for easy storage and year-round availability. At the global level, FAO utilization data indicate that frozen products accounted for around 35% of aquatic animal foods for human consumption in 2022, making freezing one of the most important preservation pathways worldwide. Frozen processing also facilitates export-grade standardization, including uniform portion sizes, controlled glazing, and robust labeling, supporting long-distance trade in salmon portions, whitefish blocks, shrimp, and coated value-added products.
Distribution Channel Insights
Among distribution channels, Retail Stores remain the leading route for processed seafood, because most seafood by weight is still consumed at home, even in high-income markets with vibrant restaurant sectors. A consumption analysis based on NOAA data showed that seafood consumed at home in the United States accounts for approximately 56% of total seafood consumption by weight, compared with roughly 31% at restaurants and 13% at other outlets. This dominance of at-home consumption is highly consequential for processors: retail supply chains typically require standardized specifications, predictable shelf-life, and consistent packaging performance. Retailers also drive innovation in private-label programs, branding, and sustainability communication. The same Nielsen dataset indicates that private label already accounts for approximately 54.4% of frozen seafood revenue, consolidating purchasing power in the hands of large chains and raising expectations regarding quality, traceability, and value for money.
Regional Insights
North America Fish Processing Market Trends and Insights
North America has emerged as a leading region in the fish processing market due to strong consumer demand for high-quality, nutritious seafood and advanced processing infrastructure. The United States dominates regional activity, driven by robust retail and foodservice channels and a growing preference for convenience-oriented products like frozen fillets and ready-to-eat meals. Consumers increasingly seek products that align with health and sustainability values, boosting demand for traceable, eco-certified seafood. Canada’s market is also gaining momentum, supported by investments in sustainable practices and value-added processing technologies. Technological innovations such as automation and improved cold chains are enhancing efficiency and product quality. Furthermore, North American processors benefit from stringent food safety regulations, which foster consumer confidence in processed seafood. The region’s established distribution networks, coupled with rising consumer awareness of seafood’s nutritional benefits, continue to shape positive market trends and support steady growth.
Asia Pacific Fish Processing Market Trends and Insights
Asia Pacific is rapidly emerging as a key growth region in the fish processing market, driven by rising seafood demand, expanding aquaculture production, and evolving consumer preferences. The region accounts for a large share of global fish output, with countries such as China, Japan, India, Vietnam, and Thailand leading in both production and processing. Urbanization and rising disposable incomes are increasing demand for convenient, processed seafood products, such as frozen fillets and ready-to-eat meals. Government support through infrastructure investment, aquaculture development programs, and export-oriented policies is strengthening processing capabilities and cold-chain networks. Technological advances, including automation and efficiency improvements in freezing and packaging, are enhancing product quality and ensuring compliance with international food safety standards. Additionally, Asia-Pacific’s role as a major seafood exporter is expanding access to global markets, further propelling regional growth and attracting investment from domestic and international players.
Competitive Landscape
Competition in the fish processing market increasingly hinges on the ability to deliver consistent quality at scale while meeting tightening environmental, social, and governance expectations. Multinational players compete on multi-species sourcing, global distribution networks, and brand and private-label portfolios, while regional processors differentiate through local raw material access, responsiveness, and specialization in niches such as smoked, cured, or premium chilled products. Across the board, investments in automation, digital traceability, and by-product recovery are becoming critical for margin protection and long-term customer relationships.
Key Market Developments
- In January 2026, India and Israel signed a Joint Ministerial Declaration of Intent to deepen collaboration in the fisheries and aquaculture sectors. The agreement establishes a framework for joint research, technology sharing, and capacity building across areas including advanced aquaculture systems, high-yield breeding, mariculture (including seaweed cultivation), and water management.
Companies Covered in Fish Processing Market
- Maruha Nichiro Corporation
- Mowi ASA
- Thai Union Group
- Nippon Suisan Kaisha (Nissui)
- Royal Greenland
- Lerøy Seafood Group
- Pescanova
- Charoen Pokphand Foods
- Austevoll Seafood
- High Liner Foods
- Trident Seafoods
- Pacific Seafood Group
- Cooke Inc
- Silver Bay Seafoods
- Dongwon Industries
- SalMar ASA
- Bakkafrost
Frequently Asked Questions
The global fish processing market is expected to be valued at approximately US$ 322.1 billion in 2026, supported by rising aquaculture output, growing per-capita seafood consumption, and increased reliance on frozen, canned, and value-added products across both developed and emerging markets.
A major demand driver is the rapid scale-up of aquaculture and the increasing share of output routed into frozen and prepared forms. In 2022, aquaculture produced about 94.4 million tonnes of aquatic animals, representing roughly 51% of global aquatic animal production and providing more predictable, uniform raw material for filleting, freezing, and value-added processing.
North America leads the fish processing market, driven by strong consumer demand, high per-capita seafood consumption, and stringent preventive-control regulation under FDA Seafood HACCP aligned with 21 CFR Part 123, which rewards processors that maintain rigorous hazard controls, traceability, and supplier verification.
Consumers worldwide are increasingly seeking convenient, nutritious, and easy-to-prepare meal options that fit modern lifestyles. Value-added offerings such as seasoned fillets, marinated products, pre-cooked and ready-to-heat seafood, and grab-and-go packs allow processors to capture higher margins compared with basic raw products.
Key players in the global fish processing market include Maruha Nichiro Corporation, Mowi ASA, Thai Union Group, Nippon Suisan Kaisha (Nissui), Royal Greenland, Lerøy Seafood Group, High Liner Foods, Trident Seafoods, and Pacific Seafood Group, alongside several other multinational and regional processors with strong positions in specific species, formats, or regions.


