


- Processed Food
- Tinned Fish Market
Tinned Fish Market Size, Share, and Growth Forecast 2026 - 2033
Tinned Fish Market by Fish Type (Mackerel, Salmon, Sardines, Tuna, Others), Distribution Channel (Supermarkets & Hypermarkets, Convenience Stores, Online Retail / E-commerce, Specialty Stores, Others), and Regional Analysis, 2026 - 2033
Tinned Fish Market Share and Trends Analysis
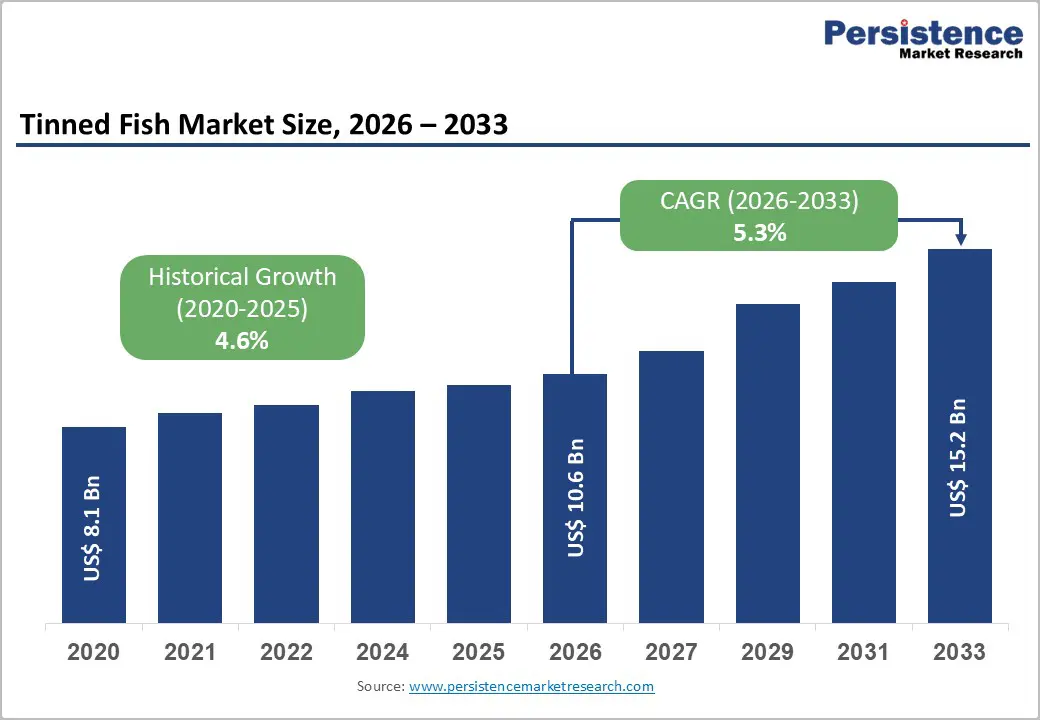
The global tinned fish market size is expected to be valued at US$ 10.6 billion in 2026 and projected to reach US$ 15.2 billion by 2033, growing at a CAGR of 5.3% between 2026 and 2033.
The demand is supported by the combination of convenience, affordability, and nutrition, as tinned fish offers a shelf-stable protein source that fits busy lifestyles and pantry stocking patterns. Growing interest in sustainable seafood, premium canned products, and ready-to-eat meals is also widening consumer adoption across developed and emerging markets.
Key Industry Highlights:
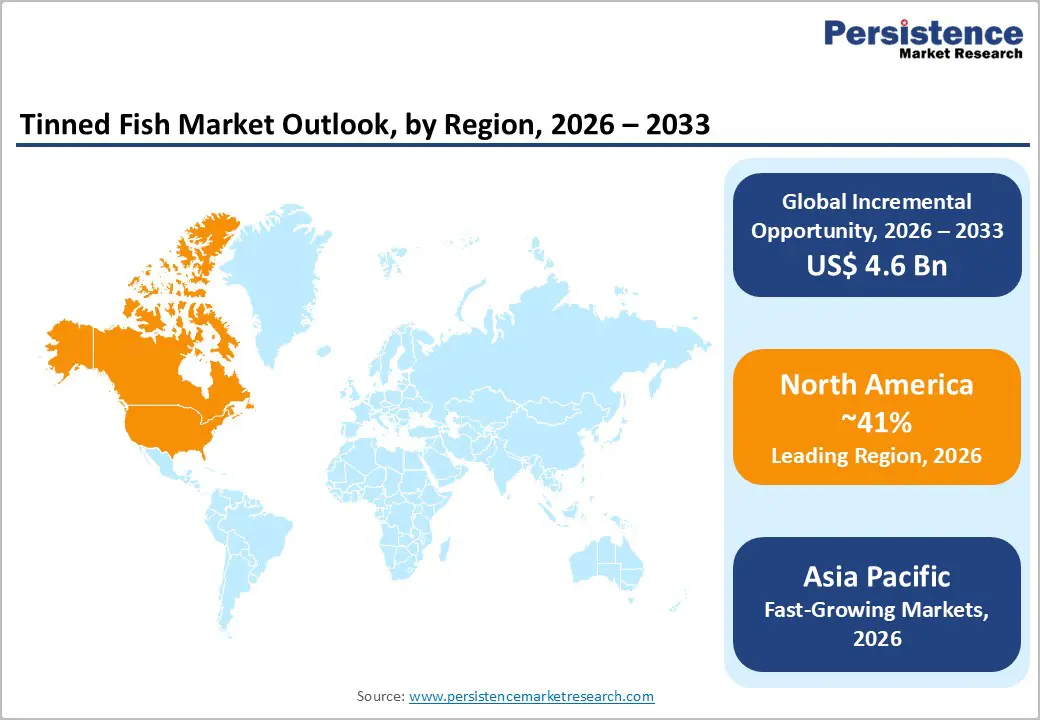
- Regional Leadership: North America is the leading regional market because consumers in the U.S. and Canada continue to favor shelf-stable seafood for convenience, affordability, and healthy protein intake.
- Fast-growing Market: Asia Pacific is the fastest-growing regional market due to urbanization, rising incomes, and greater access to packaged seafood through supermarkets and e-commerce.
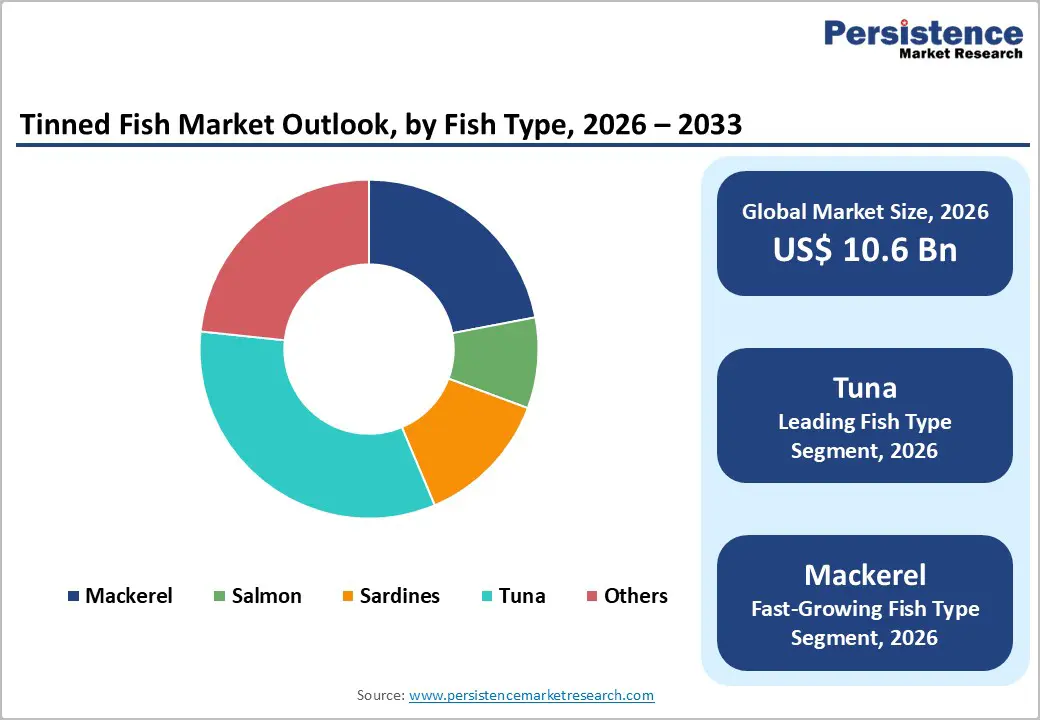
- Leading Fish Type: Tuna remains the dominant fish type, supported by its broad consumer acceptance, strong retail presence, and versatility in sandwiches, salads, and ready meals.
- Fast-growing Fish Type: Mackerel is the fastest-growing fish type because health-conscious buyers are increasingly seeking oily fish with stronger nutritional positioning and richer flavor appeal.
- Opportunity: A major opportunity lies in premium, sustainable, and digitally marketed tinned fish products that target convenience-driven consumers while improving margins through differentiation.
| Key Insights | Details |
|---|---|
|
Tinned Fish Market Size (2026E) |
US$ 10.6 billion |
|
Market Value Forecast (2033F) |
US$ 15.2 billion |
|
Projected Growth CAGR (2026-2033) |
5.3% |
|
Historical Market Growth (2020-2025) |
4.6% |
Market Dynamics
Drivers - Convenience-led demand for shelf-stable protein
The strongest growth driver for the tinned fish market is the rising demand for convenient, shelf-stable, protein-rich foods that require little or no preparation. Consumers increasingly look for products that support quick meal assembly, lunch solutions, and pantry resilience, especially in urban households where time pressure is high. Tinned fish also works well for meal prep, snacking, and on-the-go consumption, which broadens its use beyond traditional dinner applications. Tuna, sardines, and mackerel remain especially attractive because they combine long shelf life with high protein density and familiar taste profiles. This convenience proposition is powerful because it meets daily consumer needs while also supporting retailers that want stable, low-waste inventory formats.
Health, sustainability, and premiumization trends
Another major driver is the shift toward healthier and more sustainable protein consumption. Tinned fish is increasingly viewed as a practical source of omega-3 fatty acids, lean protein, and micronutrients, while also being more affordable than many fresh seafood alternatives. Sustainability messaging is strengthening this position, especially when brands emphasize responsible sourcing, traceability, and environmentally conscious packaging. Premiumization is also expanding the market as consumers trade up to artisanal, skinless-boneless, olive-oil-packed, and MSC-style certified offerings. That premium tier is important because it lifts margins and supports category value growth. As a result, tinned fish is evolving from a basic pantry staple into a lifestyle food category with health, quality, and ethical positioning.
Restraints - Raw material volatility and supply constraints
The market faces a significant restraint from volatility in fish supply, especially for tuna, which is the leading fish type. Wild catch dependence makes the industry vulnerable to weather conditions, seasonal fluctuations, fishing quotas, and geopolitical disruptions across major sourcing regions. These factors can pressure costs, limit availability, and complicate long-term pricing contracts for processors and retailers. Mackerel and sardines can also be affected by ecosystem shifts and quota changes, which adds uncertainty to inventory planning. For brands that compete heavily on price, raw material volatility can compress margins and slow expansion into lower-income markets where consumers are more sensitive to shelf price changes.
Sustainability scrutiny and consumer skepticism
A second restraint is the increasing scrutiny around overfishing, labor practices, and sustainable sourcing in seafood supply chains. Consumers and retailers are demanding stronger proof of traceability, which raises compliance costs and may exclude smaller suppliers that cannot document sourcing to the same standard. At the same time, some consumers still perceive canned seafood as highly processed or less fresh than refrigerated alternatives. That perception can limit penetration in premium fresh-food occasions and in markets where canned foods are associated mainly with budget purchasing. Together, sustainability pressure and image barriers mean brands must invest more heavily in certifications, packaging innovation, and transparent communication.
Opportunities - Growth in premium and flavored tinned fish products
One of the most attractive opportunities is the expansion of premium, flavored, and chef-style tinned fish offerings. Consumers are increasingly willing to pay more for products packed in olive oil, chili oil, tomato sauce, lemon herb marinades, and gourmet recipe formats that elevate everyday meals. This premiumization trend creates room for brands to target food enthusiasts, gift buyers, and high-income shoppers who want both convenience and a more elevated eating experience. Retailers and direct-to-consumer brands can also use small-batch storytelling, origin labeling, and sustainability claims to differentiate products. Because tinned fish is already shelf-stable, premium innovation can scale relatively efficiently without requiring cold-chain investment.
Digital commerce and direct-to-consumer expansion
A second major opportunity lies in online retail and direct-to-consumer growth. E-commerce allows brands to reach consumers who actively search for niche seafood products, subscription boxes, and imported specialty items that may not be widely available in physical stores. This channel is particularly useful for premium and sustainable brands because it supports education, storytelling, and bundle sales. It also gives smaller producers a path to market without relying entirely on large retail listings. As food discovery increasingly happens online, tinned fish companies can use social media, recipe content, and creator-driven marketing to expand awareness. This is especially promising for younger consumers who view canned seafood as both practical and trendy.
Category-wise Analysis
Fish Type Insights
Within fish type segmentation, tuna is the leading category and accounts for around 33% of the market share in 2025. Its dominance comes from its wide familiarity, versatility in sandwiches and salads, and strong global retail presence. Tuna is also one of the most recognized tinned fish products in both developed and emerging markets, making it a default choice for household shoppers. It benefits from strong brand recognition and extensive distribution across mass retail channels. At the same time, mackerel is expected to be the fastest-growing fish type because it offers strong nutritional value, a rich flavor profile, and increasing appeal among health-conscious consumers seeking alternatives to tuna. Demand for mackerel is also supported by growing interest in oily fish with omega-3 content.
Distribution Channel Insights
Among distribution channels, supermarkets & hypermarkets are the leading segment because they remain the primary point of purchase for mainstream household buyers. These outlets offer high visibility, shelf variety, promotional pricing, and easy comparison across brands and fish types. They are especially important for purchase frequency and household pantry replenishment. Consumers often choose tinned fish during regular grocery trips, which supports strong volume turnover in this channel. Online retail / e-commerce is the fastest-growing channel because it gives consumers access to specialty, premium, and imported tinned fish products that may not be stocked locally. Online platforms also support recurring subscriptions, gifting, and discovery-led purchases, which are all important for category expansion.
Regional Insights
North America Tinned Fish Market Trends and Insights
North America holds the leading position and accounted for 41% share in 2025. The U.S. tinned fish market is supported by strong consumer demand for convenient protein, growing interest in pantry-ready foods, and rising awareness of seafood’s nutritional benefits. Premium tinned fish has also gained visibility through social media, specialty retail, and the growing appeal of Mediterranean-inspired eating patterns. Regulatory oversight around seafood safety, labeling, and sustainability is helping strengthen consumer confidence and encouraging brands to improve traceability.
The region also benefits from a mature innovation ecosystem. Large branded seafood companies continue to invest in new flavors, sustainable sourcing, and upgraded packaging formats such as BPA-free cans and recyclable materials. Retailers are increasingly giving shelf space to artisanal and premium products, which is lifting category value. Strong private-label competition also keeps the market dynamic, especially in the mass supermarket channel.
Asia Pacific Tinned Fish Market Trends and Insights
Asia Pacific is the fastest-growing regional market for tinned fish, driven by rising urbanization, higher disposable incomes, and expanding packaged food consumption in China, Japan, India, and ASEAN economies. The region is seeing stronger adoption of tinned seafood as consumers look for affordable protein, quick meal options, and products that do not require refrigeration. Modern retail expansion and e-commerce are also making premium and imported tinned fish more accessible to middle-class consumers.
Manufacturing advantages further support regional growth. Many Asia Pacific markets have strong seafood processing bases, competitive labor costs, and proximity to raw material sources, which helps brands improve supply chain efficiency. Japan and parts of Southeast Asia also have high consumer familiarity with seafood products, making tinned fish easier to position in everyday eating habits. As younger consumers increasingly seek convenience and health-led food options, the region is likely to remain a major growth engine.
Competitive Landscape
The tinned fish market is highly competitive, characterized by a mix of large-scale processors and regional manufacturers competing on pricing, product quality, and distribution reach. Companies are focusing on product diversification, including flavored variants and ready-to-eat formats, to attract evolving consumer preferences. Sustainability and traceability have become key differentiators, with increasing emphasis on responsibly sourced seafood and eco-friendly packaging. Private label offerings from retailers are intensifying price competition, while premiumization trends are driving demand for high-quality, organic, and specialty products.
Key Developments:
- In January 2026, Mizoram marked a key development in its fisheries sector with the launch of its first-ever canned fish production unit by a local cooperative under the Integrated Cooperative Development Project. The initiative established a fully integrated value chain covering fish farming, processing, and canning, enabling local farmers to shift from selling raw fish to value-added products.
- In April 2025, Bon Iver partnered with an artisanal tinned fish producer to release a limited-edition smoked salmon tin as part of the promotional campaign for the SABLE, fABLE album. The collaboration featured distinctive, high-quality packaging with salmon-coloured design and bespoke fish illustrations that referenced the album’s aesthetic, transforming a humble pantry item into a collectible, visually striking product tied to the artist’s creative narrative.
Companies Covered in Tinned Fish Market
- Thai Union Group
- Bolton Group
- Century Pacific Food Inc.
- Bumble Bee Seafoods
- Dongwon Industries
- Maruha Nichiro Corporation
- Nissui Corporation
- Grupo Calvo
- Trident Seafoods
- Wild Planet Foods
- Crown Prince Inc.
- Roland Foods LLC
- Safe Catch
- NewPrinces S.p.A.
Frequently Asked Questions
The global tinned fish market is estimated at US$ 10.6 billion in 2026.
The demand is driven by the growing consumer preference for convenient, shelf-stable, protein-rich seafood that fits modern meal routines.
North America is the leading region, holding about 41% market share in 2025.
Asia Pacific is the fastest-growing region, supported by urbanization, retail expansion, and higher seafood consumption.
Major players include Thai Union Group, Bolton Group, Century Pacific Food Inc., Bumble Bee Seafoods, Dongwon Industries, Maruha Nichiro Corporation, Nissui Corporation, and Grupo Calvo.


