


- Bulk Chemicals
- Ethylene Oxide Market
Ethylene Oxide Market Size, Trends, Share, and Growth Forecast, 2025- 2032
Ethylene Oxide Market by Derivatives (Ethylene Glycols, Ethoxylates, Other Derivatives), by Industry (Automotive, Agrochemicals, Food and Beverage, Textile, Personal Care, Pharmaceuticals, Detergents, and Others), and Regional Analysis for 2025 - 2032
Ethylene Oxide Market Size and Trends Analysis
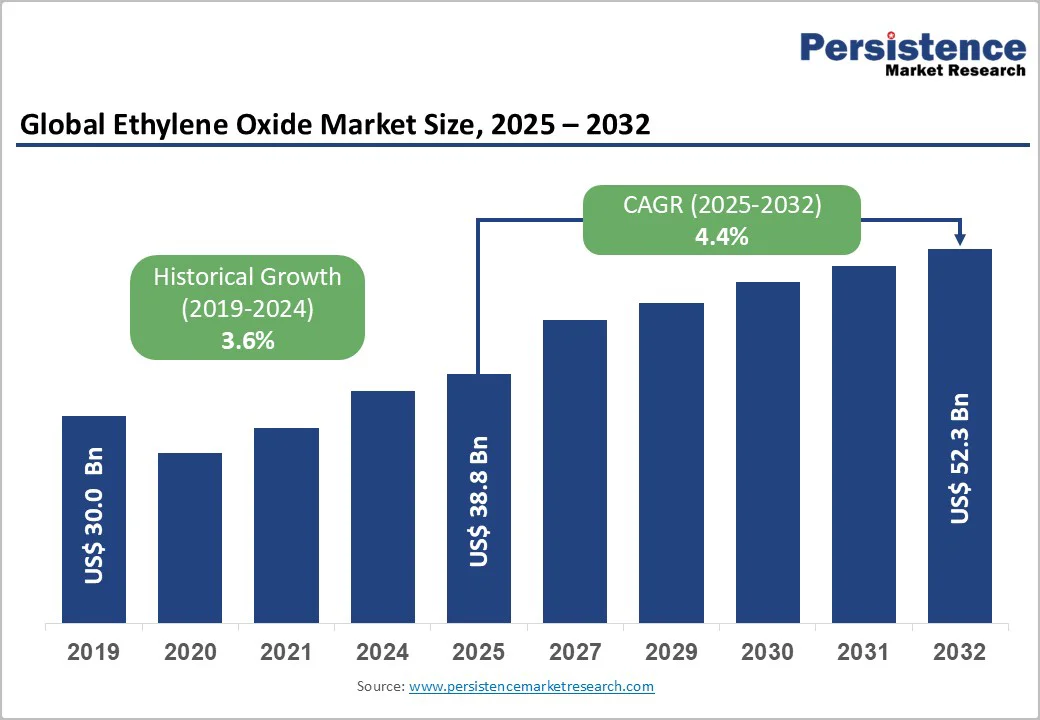
The global ethylene oxide market size was valued at US$38.8 billion in 2025 and is projected to reach US$52.3 billion by 2032, growing at a compound annual growth rate (CAGR) of 4.4% between 2025 and 2032. This market represents a critical segment within the petrochemical industry, serving as a fundamental building block for derivatives across automotive, textile, pharmaceutical, and consumer care sectors.
Key Industry Highlights:
- Derivative Leadership: Ethylene glycols command over 55% market revenue share, while ethoxylates emerge as the fastest-growing category driven by advanced surfactant and specialty chemical demand.
- End-Use Dominance: The Automotive industry maintains above 30% revenue share as the dominant sector, while the agrochemicals sector accelerates with a projected 6.1-6.8% CAGR, driven by agricultural productivity requirements and developing market adoption.
- Regional Growth Leaders: Asia Pacific dominates with 45%+ global market share and fastest growth trajectories; North America maintains above 15% to 20% revenue share with mature market characteristics; Europe represents 10% to 15% market share with sustainability-focused dynamics.
- Strategic Market Developments: BASF-SINOPEC Nanjing expansion enhances Asian capacity; ExxonMobil-SABIC 1.1-million metric ton Texas facility strengthens North American supply; industry-wide sustainability initiatives reshape competitive positioning toward bio-based alternatives.
- Critical Growth Catalysts: Sustained polyester fiber and PET resin demand; automotive industry resilience independent of powertrain evolution; agrochemical sector expansion in developing regions; emerging bio-based alternative opportunities; regulatory compliance driving technological differentiation and specialized product development.
|
Key Insights |
Details |
|
Ethylene Oxide Market Size (2025E) |
US$ 38.8 Bn |
|
Market Value Forecast (2032F) |
US$ 52.3 Bn |
|
Projected Growth (CAGR 2025 to 2032) |
4.4% |
|
Historical Market Growth (CAGR 2019 to 2024) |
3.6% |
Market Dynamics
Drivers - Diversified Applications in Surfactants and Industrial Chemicals
Beyond glycol applications, ethylene oxide derivatives particularly ethoxylates comprising ethanolamines, glycol ethers, and polyethylene glycols serve critical functions across detergent formulation, personal care products, pharmaceuticals, and industrial coatings. These ethoxylates are essential intermediates for surfactants and emulsifiers, addressing global demand for functional chemical solutions.
The personal care and home care industries, collectively representing a US$600+ billion global market, increasingly require advanced surfactant technology for specialized applications including high-performance cleaning agents and cosmetic formulations. Additionally, pharmaceutical manufacturing relies on ethylene oxide derivatives for sterilization processes and active pharmaceutical ingredient (API) synthesis. Industrial applications in paints, coatings, and specialty chemicals expand the addressable market considerably. This diversification of end-use applications provides structural demand insulation, protecting market growth even when individual sectors experience cyclical downturns.
Restraint - Production Cost Competitiveness and Capital Intensity Barriers
A major restraint for the global ethylene oxide (EO) market is the escalating regulatory scrutiny driven by its classification as a hazardous and potentially carcinogenic compound. Developed markets, particularly North America and Europe, continue to tighten restrictions on EO emissions and occupational exposure. In the United States, the EPA enforces strict emission controls that require significant investments in advanced oxidation technologies, high-efficiency scrubbers, and continuous monitoring systems. Likewise, the EU’s REACH framework mandates extensive safety documentation, exposure assessments, and risk characterization, creating high compliance barriers for small and mid-sized manufacturers.
Compliance-related expenses which represent an estimated 8–15% of total operating costs for EO production facilities directly impact profitability and operational viability. Adding to these challenges, the EPA has determined that reducing EO exposure risk requires implementing a maximum permissible concentration of 600 mg/L for new sterilization cycles by 2035, balancing public health protection with the sensitivity of the medical device supply chain that currently relies on EO sterilization. This regulatory shift will require substantial process modifications for sterilization service providers and could influence downstream demand patterns.
Health concerns continue to reinforce regulatory pressure. According to the U.S. EPA, short-term EO exposure can cause central nervous system depression and mucous membrane irritation, while chronic exposure is linked to respiratory irritation, neurological damage, reproductive effects, and elevated risks of lymphoid and breast cancers. These persistent safety concerns, combined with evolving regulatory frameworks and potential application-specific restrictions, contribute to long-term uncertainty and limit the growth trajectory of the ethylene oxide market.
Opportunities - Rapid Expansion of Bio-Based Ethylene Oxide Creating New High-Value Growth Pathways
The transition toward renewable and low-carbon chemicals is creating a significant opportunity for bio-based ethylene oxide within the global ethylene oxide (EO) market. As sustainability regulations tighten and downstream customers prioritize carbon-neutral supply chains, demand for renewable EO is expanding rapidly across personal care, detergents, pharmaceuticals, and specialty chemicals.
Industry developments highlight strong commercial momentum. In 2022, INEOS introduced its bio-attributed ethylene oxide, achieving 100% fossil feedstock substitution with renewable biomass on a mass-balance basis certified by RSB and ISCC+ and delivering over 100% greenhouse gas savings versus conventional EO. In November 2023, Braskem and Oxiteno entered a strategic partnership in which Oxiteno will use Braskem’s certified bio-attributed feedstock to produce sustainable EO derivatives, marking a breakthrough for the Brazilian chemical industry. Additionally, Croda International Plc operates the first U.S. bio-ethylene oxide facility at its Atlas Point site, producing 100% renewable, 100% bio-based surfactants, further validating the scalability of renewable EO production.
Companies that invest early in bio-EO technologies can secure strong competitive advantages, benefit from premium pricing opportunities, meet evolving regulatory and ESG requirements, and position themselves as preferred suppliers in sustainability-driven markets across Europe, North America, and Latin America.
Category-wise Analysis
Derivatives Insights
The derivatives segment of the ethylene oxide market is led by ethylene glycols, which account for more than 55% of overall revenue and continue to dominate global consumption patterns. Within this category, monoethylene glycol (MEG) holds the strongest position, representing nearly 70% of total glycol demand due to its indispensable use in polyester fiber manufacturing and PET resin production. Supplementary applications in automotive antifreeze and coolant formulations further reinforce MEG’s market importance. Mature market structures, standardized specifications, and established futures trading for MEG enhance price transparency and transaction efficiency, although they also intensify competitive margin pressures for producers.
In contrast, ethoxylates represent the fastest-growing ethylene oxide derivative segment, projected to expand at 5.5% CAGR through 2032, outpacing the broader market. This growth is propelled by rising demand for advanced surfactants used in detergents, industrial cleaners, specialty chemicals, and personal care formulations. With the global detergents market valued at over US$ 150 billion and expanding at 2–3% annually, consumption of ethoxylates continues to strengthen. Additional momentum stems from pharmaceutical sterilization requirements and increasing regulatory preference for biodegradable, high-performance surfactants, positioning ethoxylates as a critical growth engine within the ethylene oxide value chain.
Industry Insights
Automotive Demand Dominates While Agrochemicals Emerge as Ethylene Oxide’s Fastest-Growing Sector
The end-use landscape for ethylene oxide (EO) is shaped by two highly influential sectors automotive and agrochemicals, each contributing to structural demand in distinct ways. The automotive industry remains the dominant consumer, accounting above 30% revenue shares. This leadership is supported by consistent global vehicle production, which typically ranges between 75–80 million units annually, excluding pandemic-affected years.
Every vehicle utilizes approximately 8–12 liters of antifreeze and coolant fluids formulated with ethylene glycol. Importantly, the rapid shift toward electric vehicles does not diminish consumption, as EVs require comparable thermal management systems and fluid specifications. Additionally, the robust automotive aftermarket supplying replacement coolants, brake fluids, and maintenance products throughout a vehicle’s operational lifespan ensures recurring, non-cyclical demand. Strong manufacturing hubs in Germany, Japan, the United States, and China further reinforce geographically diversified EO consumption.
In contrast, the agrochemicals sector stands out as the fastest-growing end-use market, projected to expand at a CAGR of 6.1% through 2032. EO plays a vital role as an intermediate in producing herbicides, pesticides, fungicides, and advanced surfactant-based agricultural formulations. With the rising food production requirements and the adoption of modern farming practices, particularly across South Asia, Southeast Asia, and Africa, are accelerating. Moreover, the push toward sustainable crop protection and precision agriculture is boosting the need for high-performance EO-derived ingredients, positioning agrochemicals as a key growth engine for the EO market.
Regional Insights and Trends
Asia-Pacific Strengthens Global Leadership in Ethylene Oxide Capacity and Market Growth
The Asia-Pacific region is poised to remain the global center of ethylene oxide (EO) capacity expansion, with total regional capacity projected to increase sharply through 2028. Asia-Pacific is expected to add approximately 5.5 mtpa of new EO capacity from 14 planned and announced projects, alongside an additional 0.07 mtpa from a planned expansion, reinforcing the region’s leadership in EO production.
China will account for the overwhelming majority of these additions, contributing 5.43 mtpa through several large-scale petrochemical investments. The most significant project is the Shandong Yulong Petrochemical Longkou Ethylene Oxide Plant 1, with a capacity of 0.73 mtpa, scheduled to begin operations in 2024 in Shandong province. The second-largest project, the BASF Zhanjiang Ethylene Oxide Plant, will add 0.66 mtpa and is expected to start production in 2025. BASF retains 100% ownership and will operate the facility. Beyond China, additional capacity growth will come from Indonesia with 0.36 mtpa and India with 0.07 mtpa, highlighting a broader regional expansion trend.
North America Sustains Strong Ethylene Oxide Market Position Driven by Mature Industrial Strength
North America, led by the United States, maintains significant market position with approximately 20-22% global revenue share, though growth rates moderate relative to Asia Pacific due to market maturity. The United States' dominance as a major ethylene oxide producer leveraging abundant petrochemical feedstock infrastructure and advanced manufacturing technologies provides fundamental supply chain advantages. American producers including Dow Inc. and LyondellBasell Industries operate world-scale facilities with technological advantages and cost structures that support export markets alongside domestic consumption.
North American automotive manufacturers, concentrated in Detroit and surrounding regions, maintain steady ethylene oxide derivative demand for antifreeze, coolants, and synthetic lubricants. The region's pharmaceutical and personal care manufacturing sectors, though facing competitive pressures, continue driving specialized ethylene oxide derivative applications. Regulatory frameworks, while stringent, are mature and relatively predictable, enabling long-term capital planning compared to emerging markets.
Competitive Landscape
The global ethylene oxide market exhibits moderate-to-high concentration characteristics, with the top five manufacturers controlling approximately 60-65% of global production capacity. Major players including Dow Inc., Shell, BASF SE, China Petrochemical Corporation, and LyondellBasell Industries operate world-scale facilities (typically 100,000+ metric tons annual capacity), creating significant barriers to entry through capital requirements and technological expertise. Mid-tier manufacturers including Clariant, Huntsman, and regional Asian producers control approximately 25-30% combined market share, primarily serving regional markets or specialized applications. This market structure favors established players with capital resources, technical capabilities, and existing customer relationships. Competitive positioning increasingly depends on production cost efficiency, regulatory compliance infrastructure, and ability to develop specialized derivatives meeting customer requirements rather than commodity pricing alone
Key Industry Developments:
- In November 2023, Braskem partnered with Oxiteno to supply certified bio-attributed ethylene, enabling Oxiteno to develop new renewable chemical solutions. This collaboration marks a major step in advancing Brazil’s sustainable chemical manufacturing capabilities.
- In 2022, Croda International commissioned the United States’ first bio-ethylene oxide plant at its Atlas Point site, producing 100% renewable, bio-based ECO surfactants using Scientific Design’s technology, reinforcing Croda’s leadership in sustainable specialty chemicals.
- In 2022, INEOS introduced bio-attributed ethylene oxide, achieving full fossil-feedstock substitution with renewable biomass, certified by RSB and ISCC+. The product delivers over 100% greenhouse gas savings, positioning INEOS as a leader in sustainable EO production.
Companies Covered in Ethylene Oxide Market
- BASF SE
- China Petrochemical Corporation
- Clariant
- Dow
- India Glycols Limited
- INEOS
- LOTTE Chemical Corporation
- LyondellBasell Industries Holdings B.V.
- NIPPON SHOKUBAI CO., LTD.
- Reliance Industries Limited
Frequently Asked Questions
The Ethylene Oxide market is estimated to be valued at US$ 38.8 Bn in 2025.
The key demand driver for the Ethylene Oxide (EO) market is its widespread use as a critical chemical intermediate, particularly in the production of ethylene glycol, which is essential for polyester fibers, PET plastic packaging, and antifreeze formulations
In 2025, the Asia Pacific region will dominate the market with an exceeding 45% revenue share in the global Ethylene Oxide market.
Among applications, Automotive has the highest preference, capturing beyond 30% of the market revenue share in 2025, surpassing other end-use industries.
BASF SE, China Petrochemical Corporation, Clariant, Dow, India Glycols Limited, and INEOS are a few leading players in the Ethylene Oxide market.


