


- Specialty & Fine Chemicals
- Electronic Grade Phosphoric Acid Market
Electronic Grade Phosphoric Acid Market Size, Share, and Growth Forecast, 2025 - 2032
Electronic Grade Phosphoric Acid Market by Grade (<80% Purity and >80% Purity), By Application (Semiconductor, Liquid Crystal Display (LCD), VLSI & ULSI, and Others), and Regional Analysis for 2025 - 2032
Electronic Grade Phosphoric Acid Market Size and Trends Analysis
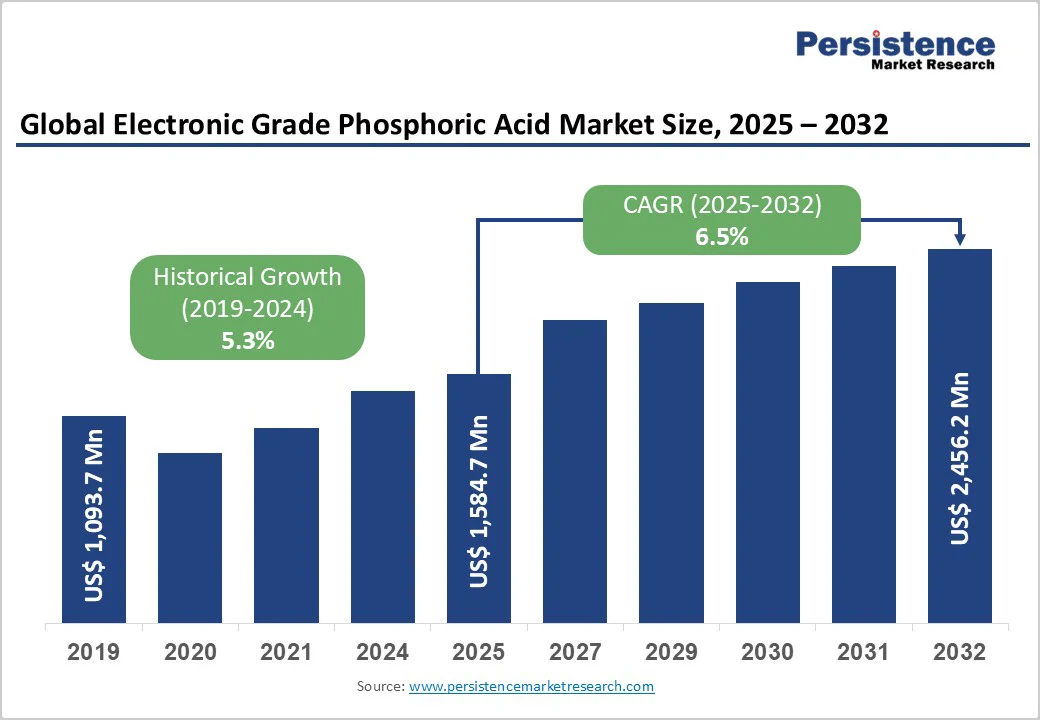
The global Electronic Grade Phosphoric Acid market is likely to value US$ 1,584.7 million in 2025, and projected to reach US$ 2,456.1 million by 2032, expanding at a CAGR of 6.5% between 2025 and 2032. This specialized high-purity phosphoric acid serves as a critical enabler in semiconductor manufacturing, liquid crystal display (LCD) panel fabrication, and advanced integrated circuit production, where stringent purity requirements exceed 80% concentration for wafer etching and cleaning applications.
The global electronic grade phosphoric acid (EGPA) market is experiencing significant growth, fueled by the rapid expansion of the semiconductor, integrated circuit, and display industries. In China, EGPA is classified into low-dust high-purity grades, MOS (metal-oxide-semiconductor) grade, and BV-I through BV-V grades, each designed for specific microelectronics applications. The BV-III grade is primarily used in very large-scale integrated circuits (VLSI) with circuit widths of 0.8–1.2 µm. MOS-grade phosphoric acid achieves a purity of 99.99% with main metal ion content around 2×10⁻⁶, while TFT-LCD grade reaches ultra-high purity of 99.9999% with main metal ion content near 5×10⁻⁷.
Key Industry Highlights:
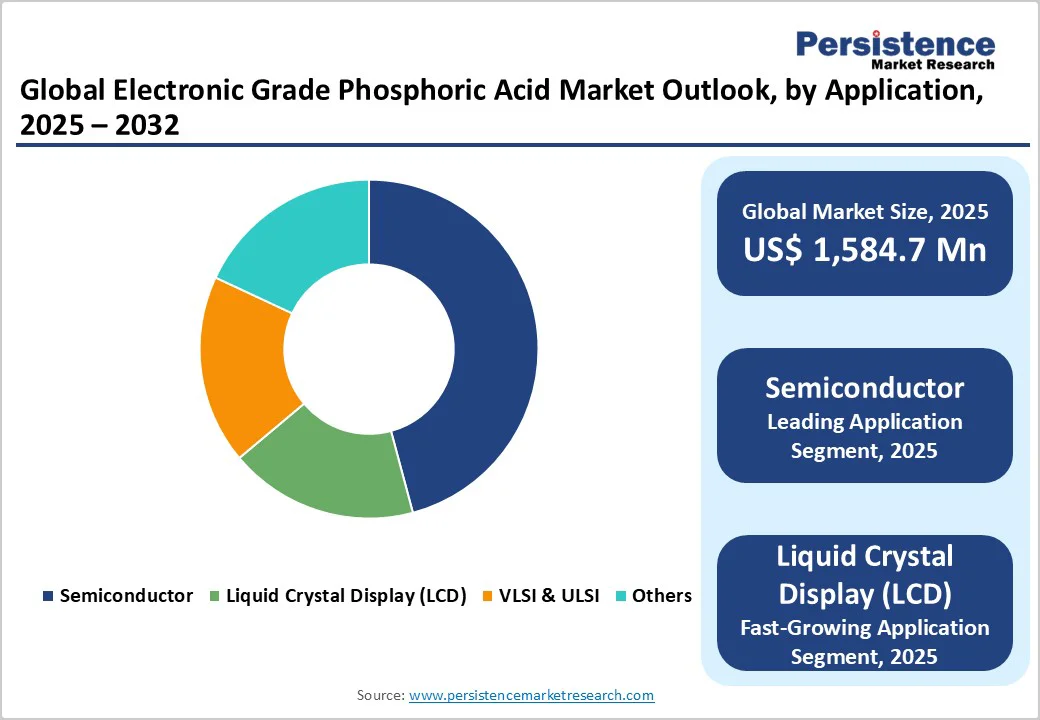
- The semiconductor application segment commands over 70% market share as the dominant end-use category, driven by global semiconductor market expansion, while the LCD application segment exhibits the fastest growth, propelled by emerging market consumer electronics penetration and automotive display integration.
- <80% purity grade maintains dominant position with above 80% revenue share serving extensive LCD manufacturing applications, while >80% purity grade represents the fastest-growing segment driven by advanced semiconductor node adoption and wide bandgap device production.
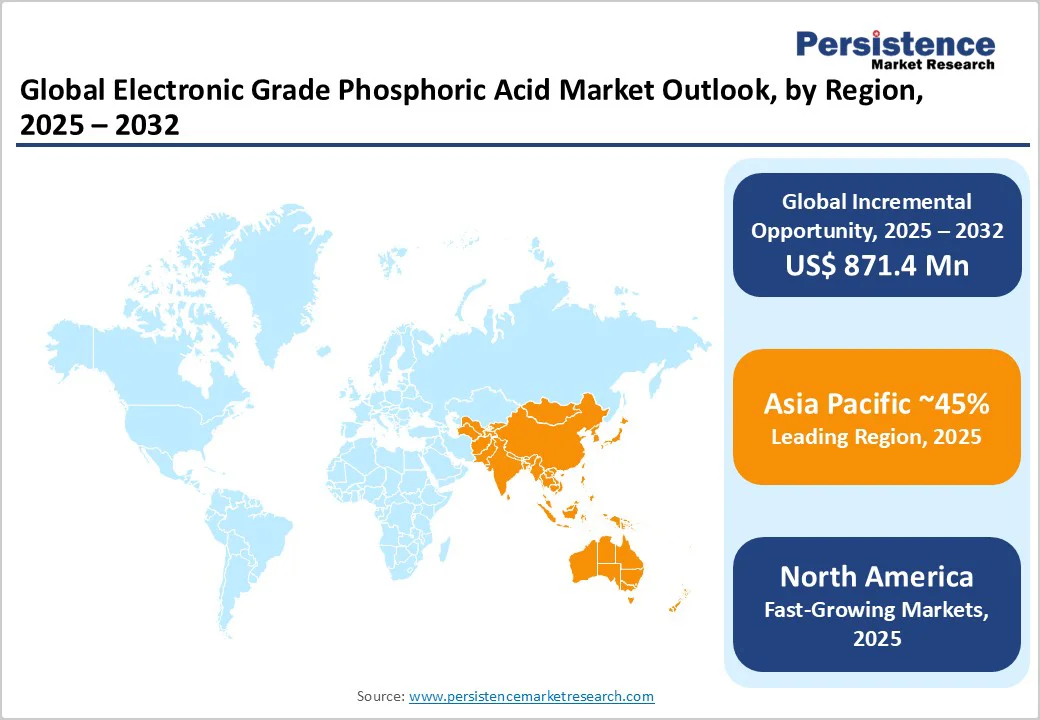
- Asia Pacific region dominates with more than 45% global revenue share, led by China's semiconductor manufacturing scale, Taiwan's foundry leadership, and India's emerging ecosystem, while North America exhibits the fastest regional growth supported by CHIPS Act reshoring initiatives and electronic chemicals market expansion.
- Top four market players control approximately 66-75% combined market share, leveraging technical expertise, backward integration, and established customer relationships to maintain competitive positions.
| Key Insights | Details |
|---|---|
|
Electronic Grade Phosphoric Acid Market Size (2025E) |
US$ 1,584.7 Mn |
|
Market Value Forecast (2032F) |
US$ 2,456.2 Mn |
|
Projected Growth (CAGR 2025 to 2032) |
6.5% |
|
Historical Market Growth (CAGR 2019 to 2024) |
5.3% |
Market Dynamics
Driver - High Production Costs and Stringent Purity Requirements Create Entry Barriers
Manufacturing electronic grade phosphoric acid demands sophisticated thermal or wet purification processes requiring advanced technology infrastructure and substantial capital expenditure, resulting in production costs significantly exceeding standard industrial-grade phosphoric acid. Achieving purity levels above 80% for semiconductor applications necessitates multiple distillation cycles, specialized filtration systems, and contamination-free manufacturing environments with Class 10,000 cleanroom standards.
These technical requirements limit market participation primarily to established chemical manufacturers with existing infrastructure, including Solvay, Arkema, and Israel Chemicals Limited. Small and medium-sized enterprises face prohibitive initial investments in precision manufacturing equipment and quality control systems required to meet semiconductor industry specifications. Additionally, stringent regulatory compliance for electronic chemicals, including ISO 9001 quality management certification and industry-specific validation protocols, imposes ongoing operational costs that constrain market entry and limit competitive intensity. The high switching costs associated with chemical supplier qualification processes, which typically require 12-18 months of rigorous testing by semiconductor manufacturers, further consolidate market share among incumbent producers with established customer relationships and proven track records of consistent purity standards.
Rising Demand from Display, 5G, and EV Semiconductor Growth Driving Electronic Grade Phosphoric Acid Market
The robust growth of global display manufacturing, 5G infrastructure deployment, and electric vehicle semiconductor content is driving strong demand for electronic grade phosphoric acid. High-purity phosphoric acid is essential for cleaning LCD and TFT panels, supporting production of millions of units monthly, while expanding display capacities in China and India further amplify consumption.
Simultaneously, the rapid rollout of 5G networks and proliferation of advanced RF, power management, and MIMO semiconductor components rely on ultra-pure phosphoric acid for fabrication processes. In the automotive sector, rising EV production and integration of ADAS, high-voltage battery management systems, and silicon carbide MOSFETs significantly increase semiconductor content per vehicle, boosting wafer-level phosphoric acid usage. These combined trends extend demand beyond traditional semiconductor and display applications into broader electronics and renewable energy sectors.
Restraint - Raw Material Supply Chain Vulnerabilities and Environmental Regulatory Pressures
Electronic grade phosphoric acid production fundamentally depends on phosphate rock mining, which faces increasing environmental scrutiny and regulatory restrictions across major producing regions. Phosphate rock and elemental phosphorus are designated as Critical Raw Materials under the EU CRM Act, requiring enhanced monitoring and circularity measures that may constrain supply availability.
China, which produces approximately 30% of global phosphoric acid output and hosts substantial phosphate ore resources in Yunnan, Guizhou, and Hubei provinces, implements stringent environmental controls on phosphorus production that periodically restrict output and create supply-demand imbalances. The European Commission's environmental regulations require phosphorus recovery from sewage sludge ash by 2033, potentially diverting feedstock from electronic grade production.
Furthermore, sulfur dioxide emissions from wet-process phosphoric acid production face tightening air quality standards globally, necessitating costly pollution control investments that increase manufacturing expenses. Geopolitical tensions affecting phosphate rock trade flows, combined with consolidation among phosphate mining operations, introduce price volatility that impacts electronic grade phosphoric acid manufacturing economics and potentially constrains market growth during periods of raw material scarcity or cost escalation.
Electronic Grade Phosphoric Acid Market Trends and Opportunities
Emerging Applications in Advanced Packaging and Wide Bandgap Semiconductors
The transition toward 3D integrated circuit packaging and chiplet architectures creates substantial new opportunities for electronic grade phosphoric acid in through-silicon via (TSV) etching and advanced interconnect cleaning processes. Advanced packaging technologies for high-bandwidth memory and AI accelerators require multiple wafer bonding and debonding cycles, each consuming high-purity phosphoric acid for surface preparation. The wide bandgap semiconductor market, particularly silicon carbide (SiC) and gallium nitride (GaN) devices for electric vehicle power electronics, demands specialized etching solutions due to harder material properties.
Silicon carbide device production is expanding rapidly, with companies like Bosch ramping SiC chip production in Germany and California targeting first output by 2027. These wide bandgap materials require phosphoric acid blends specifically formulated for their crystalline structures, commanding premium pricing and higher margins compared to traditional silicon wafer applications. Additionally, the quantum computing sector's emergence introduces new requirements for ultra-high purity chemicals in superconducting qubit fabrication, potentially opening niche high-value market segments.
Electronic Grade Phosphoric Acid Market Insights and Trends
Grade Insights
Dominance of <80% Purity in LCDs and Rapid Growth of >80% Purity in Advanced Semiconductors
The Electronic Grade Phosphoric Acid (EGPA) market is shaped by distinct dynamics across purity grades. The <80% purity segment dominates, commanding over 80% of revenue, largely driven by large-scale LCD manufacturing. This grade is widely used for cleaning liquid crystal display components, where moderate purity meets performance requirements while offering cost advantages. China’s LCD production, representing roughly 55% of global output, ensures sustained high-volume consumption, with major manufacturers like BOE, AUO, and LG Display supporting shipments of 18.5 million panels monthly. Beyond displays, <80% purity phosphoric acid serves photovoltaic cell manufacturing for surface treatment and texturization, reinforcing segment stability amid global solar installations reaching 597 GW in 2024. However, commoditization and price pressures challenge margins, emphasizing scale efficiency.
In contrast, the >80% purity segment is the fastest-growing, propelled by advanced semiconductor applications. Essential for VLSI and ULSI wafer fabrication, this grade ensures ultra-high purity etching and cleaning, supporting semiconductor miniaturization trends. North America and Europe, with high-value semiconductor production, drive adoption of >80% purity EGPA. Demand is further amplified by silicon carbide and gallium nitride device production for electric vehicles, prompting manufacturers like Solvay, Arkema, and Merck to invest in capacity and secure raw material supply chains.
Application Insights
Semiconductor Dominance and Rapid LCD Growth Propel the Electronic Grade Phosphoric Acid Market
The semiconductor segment dominates the electronic-grade phosphoric acid market, accounting for over 70% of revenue, due to its essential role in wafer cleaning, silicon nitride etching, and metal surface preparation during integrated circuit fabrication. Advanced logic and memory chip production, including 3D NAND and DRAM, requires multiple acid application cycles per wafer, with higher purity specifications for each new technology node. Strong supplier relationships are sustained through rigorous 12–18 month qualification processes, while China’s semiconductor production accounting for 52.1% of Asia Pacific revenue further reinforces consumption growth despite geopolitical constraints.
The LCD application segment is the fastest growing, propelled by rising consumer electronics adoption in emerging markets and automotive display integration. India’s TFT-LCD market is expected to grow from $5.9 billion in 2024 to $8.4 billion by 2033, while automotive panels exceed 32 million units quarterly, supporting demand for digital instrument clusters and infotainment systems. LCD production concentration in Asia Pacific, large-format TV adoption, and higher-resolution panels increase cleaning cycles and phosphoric acid use. Overall, the semiconductor and LCD segments collectively drive both revenue dominance and rapid growth in the electronic grade phosphoric acid market.
Regional Insights and Trends
Asia Pacific Leads Global Electronic Grade Phosphoric Acid Market with Diversified Semiconductor and Electronics Demand
The Asia Pacific region holds a dominant position in the global electronic grade phosphoric acid market, contributing over 45% of total revenue. China leads the region, accounting for 52.1% of Asia-Pacific semiconductor revenue in 2024, shipping 245.99 billion units, supported by government incentives, robust supply chains, and strong domestic electronics demand. China’s phosphoric acid production is substantial, with Hubei Xingfa Chemicals Group offering 591 products across 15 categories, including electronic-grade phosphates.
Taiwan’s semiconductor leadership, reinforced by TSMC’s 68.8% global foundry share and ongoing 1.4nm pilot line development, ensures sustained high-purity phosphoric acid consumption. Japan leverages materials expertise and state support through Rapidus’s 2nm initiative and TSMC consortium fabs, opening opportunities for domestic suppliers like RIN KAGAKU KOGYO. India emerges as a growth engine with a 9.7% CAGR, fueled by Tata-Powerchip’s $11 billion fab and Micron’s $2.7 billion ATMP facility, supported by Production-Linked Incentives covering up to 50% of capital expenditure. Southeast Asian nations, including Singapore and Malaysia, expand backend and specialty analog clusters. The region’s integrated electronics ecosystem from semiconductor fabrication to LCD panels and photovoltaic cells creates diversified, high-volume demand, providing scale advantages and mitigating single-application cyclicality for phosphoric acid suppliers.
North America Emerges as Fastest-Growing Hub for Electronic Grade Phosphoric Acid Driven by Semiconductor Reshoring and Advanced Technology Demand
The North American electronic grade phosphoric acid market is emerging as the fastest-growing regional segment, driven by semiconductor manufacturing reshoring, expanding electronic chemicals demand, and strong R&D capabilities supporting advanced materials innovation. U.S. government initiatives, including the CHIPS and Science Act with over $52 billion in funding, incentivize domestic semiconductor fabrication, with Intel, TSMC, and Samsung investing in major fab expansions, collectively boosting phosphoric acid demand. Advanced packaging for AI accelerators, rising automotive semiconductor content in EVs, and defense and aerospace requirements further reinforce consumption, while long-term supply agreements between chemical manufacturers and fabs ensure material security amid geopolitical uncertainties.
Environmental sustainability regulations are encouraging green production methods that maintain ultra-high purity standards. The specialty chemicals market reflecting North America’s collaborative and innovation-driven approach, positioning the region as a key growth hub for electronic-grade phosphoric acid in semiconductor, automotive, and advanced technology applications.
Competitive Landscape
The electronic grade phosphoric acid market exhibits moderate-to-high concentration with top four players holding approximately 66-75% combined market share, reflecting substantial barriers to entry from technical requirements, capital intensity, and established customer qualification processes. Arkema, Solvay, and ICL Performance Products collectively command over 75% share, leveraging technical expertise in high-purity chemical manufacturing, backward integration into phosphate rock feedstocks, and global distribution capabilities.
The competitive landscape features vertically integrated producers maintaining cost advantages through captive raw material sources, exemplified by Israel Chemicals Limited's phosphate mining operations in the Negev desert, providing feedstock security. Market positioning strategies emphasize technical service capabilities, consistent purity specifications, and supply chain reliability rather than price competition alone, given the critical nature of electronic grade chemicals in preventing multimillion-dollar semiconductor wafer contamination incidents.
Key Industry Developments:
- In 2025, Prayon has announced the launch of a new electronic-grade phosphoric acid production facility in Bex, Switzerland. This strategic investment aims to double the company’s production capacity, addressing the rising demand for ultra-pure phosphoric acid driven by the rapid expansion and reshoring of the semiconductor industry in Europe and the United States.
- In 2024, Alventa S.A. has introduced a new electronic-grade phosphoric acid (Grade 3, SEMI C36 standard), a high-purity mineral acid designed for advanced applications. This product is primarily used in the manufacture of integrated circuits, semiconductors, and liquid crystal displays, as well as serving as an additive in photovoltaic panels and fuel cells, supporting the growing demand for high-quality electronics and clean energy technologies.
Companies Covered in Electronic Grade Phosphoric Acid Market
- Arkema Group
- OCI Company Ltd
- Israel Chemicals Ltd / ICL Group Ltd.
- Cabot Microelectronics Corporation
- Merck KGaA
- RIN KAGAKU KOGYO Co., Ltd
- Taiwan Maxwave Co., Ltd.
- Asia Union Electronic Chemical Corp
- Avantor, Inc.
- Solvay SA
- Honeywell International Inc.
- Thermo Fisher Scientific Inc.
- Hubei Xingfa Chemicals Group Co., Ltd.
- Guizhou Chanhen Chemical Corporation
- Yunnan Phosphorus Group Co., Ltd.
- Wengfu Group Co., Ltd.
- Chengxing Group Co., Ltd. / Jiangyin Chengxing Industrial Group Co., Ltd.
- Innophos Holdings, Inc.
- Prayon S.A.
- Yuntianhua Group Co., Ltd.
- Aditya Birla Chemicals
- Taixing Nanlin Chemical Co., Ltd.
- Yibin Tianyuan Group Co., Ltd.
- Other Market Players
Frequently Asked Questions
The Electronic Grade Phosphoric Acid market is estimated to be valued at US$ 1,584.7 Mn in 2025.
The key demand driver for the Electronic Grade Phosphoric Acid (EGPA) market is the rapid growth of the semiconductor, display, and advanced electronics industries, which require ultra-pure phosphoric acid for critical manufacturing processes.
In 2025, the Asia Pacific region will dominate the market with an exceeding 45% revenue share in the global Electronic Grade Phosphoric Acid market.
Among applications, Semiconductors hold the highest preference, capturing beyond 70% of the market revenue share in 2025, surpassing other product types.
Hubei Xingfa Chemicals Group Co., Ltd., Arkema Group, OCI Company Ltd, Israel Chemicals Ltd / ICL Group Ltd., Cabot Microelectronics Corporation, Merck KGaA, RIN KAGAKU KOGYO Co., Ltd, and Taiwan Maxwave Co., Ltd. are some leading players.


