


- Biotechnology
- Automated Liquid Handling Systems Market
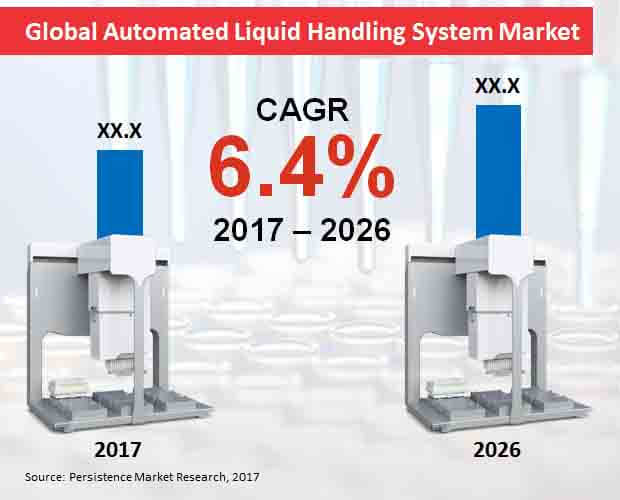
Automated Liquid Handling Systems Market
Global Market Study on Automated Liquid Handling Systems: North America to Lead the Global Market in Terms of Revenue during 2017 - 2026
Introduction
The standard issue with the traditional liquid handling system is the volume of fluid or liquid. Hence, automated liquid handling systems are being deployed on a large scale at laboratories to eliminate the errors, and minimize the processing time.
Rise in the production of vaccine is one of the major factors resulting in the increasing use of automated liquid handling system. Moreover, pharmaceutical companies are also investing in the production of vaccines due to the high presence of infectious diseases. Flexibility and adaptability, volume range capabilities, handling of samples of different viscosities, and contamination control are few important factors that are considered before purchasing automated liquid handling systems.
Automated Liquid Handling Workstation- Top-Selling Product between 2017 and 2026
Compared to the various automated liquid handling systems, automated liquid handling workstation is likely to emerge as one of the top-selling products. Automated liquid handling workstation is projected to surpass US$ 700 million in terms of value by 2026 end. Manufacturers are focusing on developing automated liquid handling workstations to perform mixing, sampling and combining of the liquid samples. Drug development labs and biology research labs are using automated liquid handling workstation to avoid sample contamination and minimize human errors while conducting a research.
Hospitals and Diagnostic Centers to be the Largest End Users of Automated Liquid Handling Systems
Hospitals and diagnostic centers are likely to emerge as the largest end users of the automated liquid handling systems. Hospitals and diagnostic centers are projected to reach over US$ 600 million revenue towards 2026 end. Increasing prevalence of new diseases is driving the demand for new treatment methods. Hence automated liquid handling systems are being used at hospitals and diagnostic centers to identify the type of disease and also results in the high potential for early detection and treatment of diseases.
Disposable Tips to Witness Strong Growth in the Global Market for Automated Liquid Handling System
Disposable tips are likely to witness strong growth in the market between 2017 and 2026. Disposable tips are projected to reach close to US$ 1000 million revenue by 2026 end. Automated liquid handling systems uses either fixed or disposable tips. However, it highly depends on the system being used, application, and volume being dispensed. Air displacement systems often use disposable tips. Moreover, disposable tips are also considered to be the best to eliminate cross-contamination between various biological samples.
North America to Witness Substantial Growth in the Global Market for Automated Liquid Handling Systems Market
North America is anticipated to witness healthy growth between 2017 and 2026. Owing to the increase in the number of life science projects, the discovery of new drugs to fight various diseases, the demand for automated liquid handling systems is increasing in the region. Meanwhile, in Europe, the U.K. and Germany are the leadingc countries in the automated liquid handling systems market due to the increasing investment by both public and private sector in the development of pharmaceutical and healthcare sector. Also, the shift from basic healthcare products to the advanced medical products such as DNA cloning and genetic engineered drugs.
Competition Tracking
Aurora Biomed, Inc., Hamilton Company, Tecan Group Ltd, Eppendorf AG, Qiagen N.V., Mettler-Toledo International Inc., Corning, Inc., Bio-Rad Laboratories Inc., PerkinElmer, Inc., Agilent Technologies, Inc., Danaher Corporation, and Thermo Fisher Scientific Inc., are some of the leading companies in the global market for automated liquid handling systems.
Global Automated Liquid Handling Systems Market- Segmentation
| Attribute | Details |
|---|---|
| Region |
|
| Product Type |
|
| End Users |
|
| Modality |
|
Companies Covered in Automated Liquid Handling Systems Market
- Thermo Fisher Scientific, Inc.
- Danaher Corporation
- Agilent Technologies
- PerkinElmer, Inc.
- Bio-Rad Laboratories, Inc.
- Corning, Inc.
- Mettler-Toledo International, Inc.
- Qiagen N.V.
- Eppendorf AG
- Tecan Group Ltd.
- Hamilton Company
- Aurora Biomed, Inc.
- Others.


