


- Automotive
- Water Truck Market
Water Truck Market Size, Share, and Growth Forecast, 2026 – 2033
Water Truck Market by Truck Type (Highway, Off Road), Tanker Capacity (Below 6,000lt, 6,000-20,000lt, Above 20,000lt), End-Use (Mining & Construction, Agriculture, Firefighting, Potable Water Supply, Household, Commercial), and Regional Analysis for 2026–2033
Water Truck Market Share and Trends Analysis
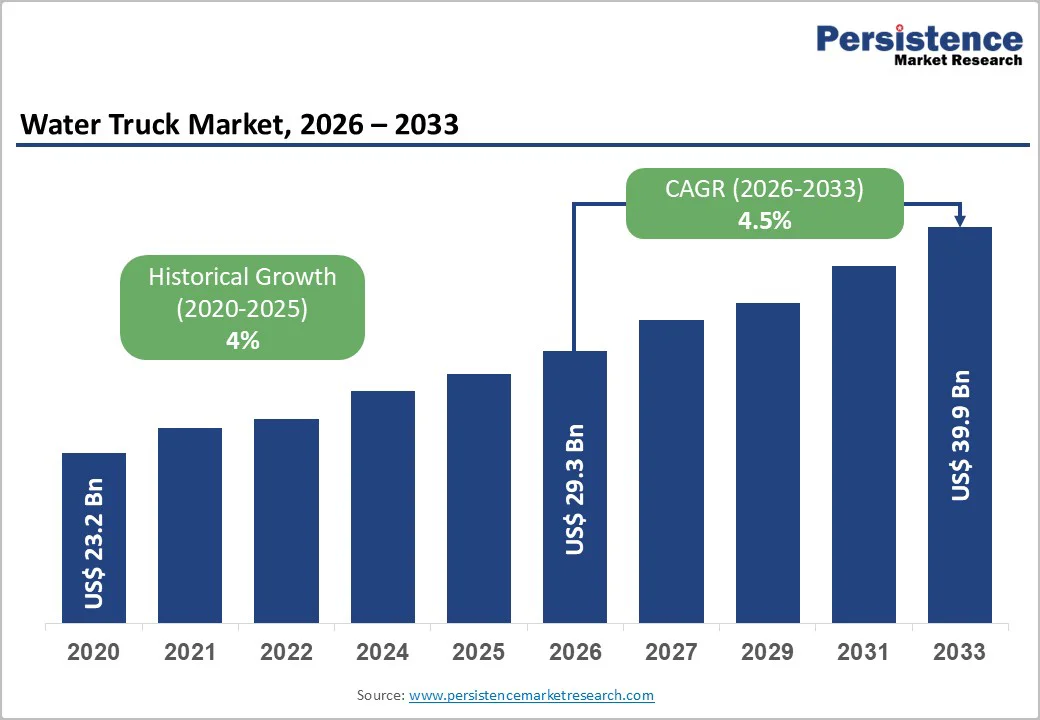
The global water truck market size is likely to be valued at US$?29.3?billion in 2026, and is projected to reach US$?39.9?billion by 2033, growing at a CAGR of 4.5% during the forecast period 2026-2033. Market growth is supported by the increasing demand for efficient water transport solutions, especially in urbanizing and water-scarce regions, rising industrial and construction activities, and expanding use cases such as municipal water supply, agriculture, and firefighting. Infrastructure development, demographic growth, and regulatory emphasis on water access and sanitation further underpin demand.
Key Industry Highlights
- Leading Truck Type: Highway trucks are expected to dominate with around 45% share in 2026, driven by strong urban and municipal demand.
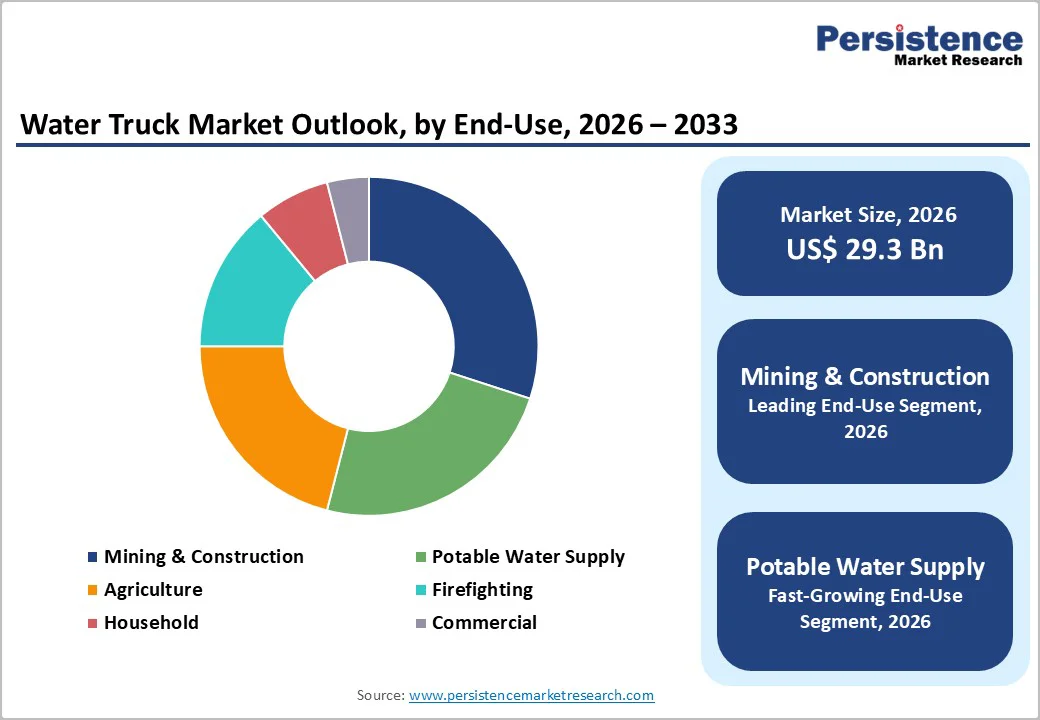
- Leading End-Use Segment: Mining & construction is likely to lead with a 30% share in 2026, supported by rapid infrastructure and industrial growth.
- Fastest-Growing End-Use: Potable water supply is projected to grow the fastest at about 11% CAGR through 2033, fueled by increasing urbanization and acute water scarcity in urban areas.
- Dominant Tanker Capacity: Medium capacity (6,000–20,000lt) trucks are likely to hold a 48% share in 2026, due to their balance of operational flexibility and volume.
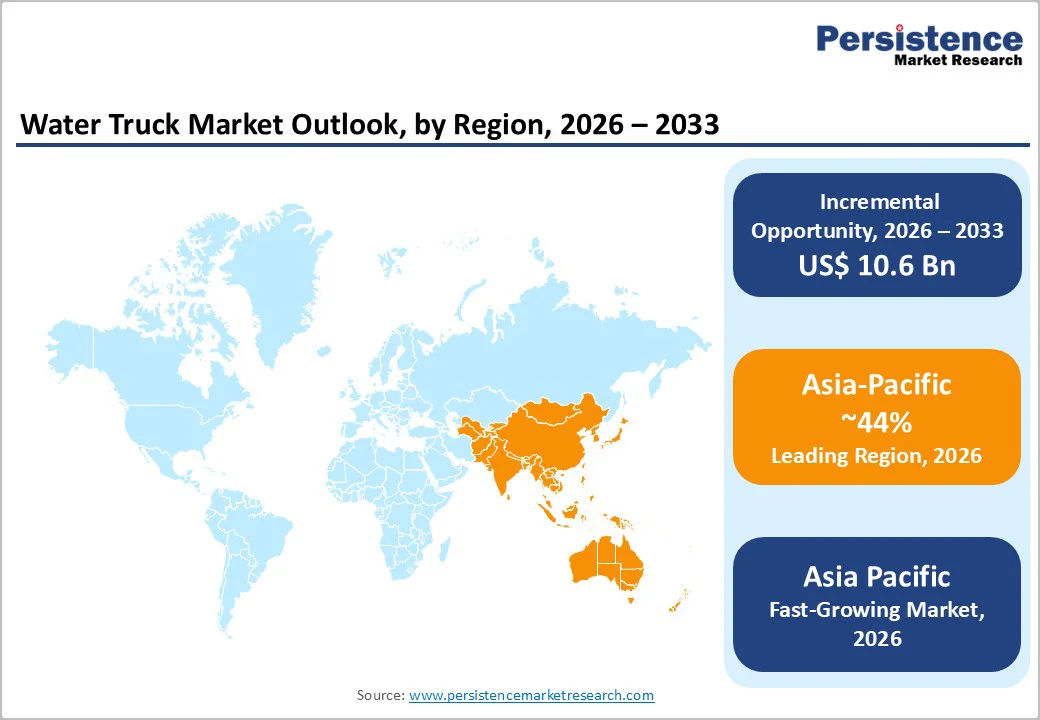
- Leading Region: Asia Pacific is projected to lead with ~44% share in 2026, owing to expanding industrial projects.
- Key Trend: The adoption of telematics-based fleet management and hybrid/fuel-efficient water trucks is enhancing operational optimization, efficiency, and sustainability.
| Report Attribute | Details |
|---|---|
|
Water Truck Market Size (2026E) |
US$ 29.3 Bn |
|
Market Value Forecast (2033F) |
US$ 39.9 Bn |
|
Projected Growth (CAGR 2026 to 2033) |
4.5% |
|
Historical Market Growth (CAGR 2020 to 2024) |
4% |
Market Factors – Growth, Barriers, and Opportunity Analysis
Mounting Water Stress, Industrial Expansion, and Shift towards Efficient Water Transport
Intensifying water scarcity, rapid urbanization, and rising infrastructure needs are collectively driving strong demand for water trucking solutions. Several regions continue to face unreliable or insufficient pipeline-based supply, pushing municipalities, industries, and agricultural users to depend on flexible tanker-based distribution for essential water delivery. As cities expand and climatic pressures worsen, water trucks provide a dependable bridge between supply gaps and rising consumption needs. This structural reliance is reinforcing market growth and strengthening the long-term role of mobile water distribution.
At the same time, accelerating construction, mining, and industrial activities, especially in developing economies, are amplifying the need for water trucks for dust suppression, soil compaction, concrete operations, and remote-site supply. Technological upgrades such as telematics, GPS-enabled fleet management, and more efficient pumping and tank systems are improving operational reliability while helping operators meet tightening sanitation and environmental standards. These advancements, combined with expanding on-ground project activity and compliance requirements, are fueling sustained adoption of modern water truck fleets across global markets.
High Operational Burden and Structural Limitations in Water Truck Deployment
Water truck operators face substantial recurring expenses that constrain market expansion, particularly for small and mid-sized fleets. Rising fuel prices, frequent maintenance needs, driver wages, and sanitation requirements for potable water transport collectively increase the cost of ownership. Compliance with evolving safety and water quality standards adds further financial pressure, making it challenging for operators to maintain profitability when demand fluctuates seasonally. These cumulative cost factors often discourage rapid fleet scaling and limit participation in regions with volatile or unpredictable water needs.
Alongside cost pressures, structural and regulatory obstacles restrict efficient deployment of water trucks in several markets. Inconsistent enforcement of water quality guidelines, fragmented licensing requirements, and limited inspection infrastructure create operational complexity for fleet owners. In many rural and remote areas, poor road conditions and challenging terrain reduce the utility of medium and large tanker trucks, limiting their reach where water shortages are often the most severe. These infrastructural gaps, combined with uneven regulatory frameworks, delay fleet modernization and hinder broader adoption of water trucking solutions.
Shift toward Sustainable Fleets and Digitalized Water Truck Operations
Growing global emphasis on sustainability, fuel efficiency, and emissions reduction is creating a strong opening for next-generation water truck solutions. Hybrid and electric drivetrains, lightweight composite tanks, and more efficient pumping systems offer operators meaningful cost savings and compliance advantages. As fuel prices rise and environmental regulations strengthen, fleet owners are increasingly evaluating cleaner alternatives. Even a modest transition toward hybrid or electric models over the coming years could translate into significant revenue potential, positioning manufacturers to capture demand for low-emission and cost-efficient water trucking systems.
Digital transformation of water distribution systems is producing novel opportunities through telematics, real-time monitoring, and predictive maintenance platforms. Integrating GPS, route optimization tools, and data-driven fleet management can reduce downtime, improve delivery accuracy, and lower operational costs for both municipal and industrial fleets. These technologies are particularly valuable in high-growth regions facing structural water supply gaps, where water trucks play a central role in municipal distribution and emergency response. As cities grow and infrastructure investment accelerates, the combined momentum of sustainable vehicle adoption and digital service integration presents a substantial long-term growth pathway for the global water truck market.
Category-wise Analysis
Truck Type Insights
Highway water trucks are expected to account for an estimated 48.6% of the market revenue share in 2026, supported by their widespread use in municipal supply, construction zones, industrial facilities, and peri-urban areas. Their maneuverability, cost-efficient operation, and suitability for paved and semi-paved routes make them the preferred choice for routine water transport. These trucks also benefit from easier maintenance and readily available spare parts, encouraging their continued dominance across developed and emerging markets. Growth in municipal water distribution and infrastructure activity further strengthens the position of highway models.
Off-road water trucks are expected to grow the fastest at an estimated 5.2% CAGR between 2026 and 2033, driven by the critical need for water supply in mining, large-scale construction, agriculture, and remote-site logistics. Expanding operations in rugged terrains and areas without reliable infrastructure make off-road units essential for high-capacity and difficult-access delivery. Increased investment in resource extraction and rural development further accelerates adoption. Their ability to transport large volumes in challenging conditions positions them as the highest-growth category over the forecast period.
Tanker Capacity Insights
Medium-capacity water trucks (6,000–20,000lt) are expected to remain the leading category, holding an estimated 37.9% revenue share in 2026, due to their versatility and ability to balance maneuverability with adequate payload. They are widely used in urban and semi-urban construction, agriculture, and municipal supply networks, allowing operators to meet frequent delivery needs without high cost. Their adaptability across varied applications ensures consistent utilization, supporting strong fleet preference among both public and private operators. Growing mid-scale infrastructure activity strengthens their continued leadership.
Large-capacity water trucks are projected to record the fastest growth at approximately 5.6% CAGR from 2026 to 2033, powered by expanding mining operations, large industrial projects, and bulk water supply requirements in water-stressed regions. Their ability to minimize refill frequency and deliver substantial water quantities per trip provides significant logistical advantages for remote and high-demand sites. As large-scale infrastructure investments expand globally, operators increasingly adopt higher-capacity models to improve efficiency and reduce operational downtime. This shift makes the segment the strongest growth performer.
End-Use Insights
The mining & construction segment is projected to lead with an estimated 30% of the water truck market revenue share in 2026, driven by heavy water usage for dust suppression, soil compaction, drilling support, concrete production, and site maintenance. These operations typically lack fixed water supply infrastructure, making mobile water trucking indispensable for daily activities. Rapid expansion of infrastructure projects, especially in emerging economies, sustains recurring demand and ensures high fleet utilization. This consistent operational role positions construction and mining as the dominant end-use category globally.
Potable water supply is likely to be the fastest-growing segment, projected to expand at approximately 11% CAGR between 2026 and 2033, supported by massive urbanization, increasingly acute water scarcity, and underserved settlements in developing regions. Many municipalities rely on tanker-based distribution to bridge gaps in pipeline systems, especially during seasonal shortages and emergency conditions. Increasing investment in water access programs and disaster-response infrastructure further accelerates demand. As climate-related supply disruptions intensify, potable water delivery continues to strengthen its growth trajectory.
Regional Insights
North America Water Truck Market Trends
North America is likely to remain one of the most established markets, holding an estimated 33% share in 2026, supported by mature municipal systems and strong regulatory oversight. The region benefits from consistent demand across construction, industrial services, and emergency response, especially in drought-affected states. Investment in water infrastructure upgrades and replacement of aging fleets further reinforces steady procurement cycles. Stringent standards for potable water transport and emissions also encourage modernization of trucks. With stable population trends and high compliance requirements, the region continues to offer predictable, long-term demand for reliable water truck fleets.
Growth in North America is moderate, projected at roughly 4.7% CAGR between 2026 and 2033, reflecting a mature but resilient market structure. Adoption of digital fleet tools, emission-compliant engines, and advanced pumping technologies is shaping competitive dynamics. Municipal authorities and large contractors prioritize efficiency, durability, and regulatory alignment, influencing fleet replacement decisions. Although operational costs such as fuel, labor, and maintenance are rising, consistent infrastructure development and emergency-readiness needs ensure ongoing fleet expansion.
Europe Water Truck Market Trends
Europe is poised to account for an estimated 21% of the water truck market share in 2026, boosted primarily by the focus on environmental compliance, public service optimization, and maintenance of aging urban infrastructure by the European Union (EU). The region uses water trucks extensively for municipal hygiene, firefighting support, temporary water distribution, and infrastructure repair activities. Emphasis on sustainable fleet operations and low-emission vehicles shapes procurement policies across major countries. Given slower population expansion, the region’s demand is centered on improving service quality rather than meeting high-volume transport requirements. Strong regulatory expectations continue to influence design, safety, and sanitation specifications for new fleets.
The Europe market is expected to grow at around 4.5% CAGR between 2026 and 2033, reflecting a modernization-centered trajectory. Municipal authorities increasingly adopt energy-efficient truck models and digital monitoring systems to improve utilization. Fleet operators also seek lightweight configurations to reduce fuel consumption and meet tightening carbon targets. Despite a mature infrastructure environment, periodic water shortages, climate events, and maintenance needs sustain procurement activity. As governments emphasize sustainability and resilience, Europe remains a consistent but moderate-growth region with a rising preference for advanced and environmentally responsible water truck technologies.
Asia Pacific Water Truck Market Trends
Asia Pacific is expected to lead the global market with an estimated 44% share in 2026, driven by high-speed urbanization, expanding construction activity, and persistent water supply gaps in rural and peri-urban areas. Several areas with the region heavily depend on water trucks to compensate for limited or unreliable pipelines, creating strong recurring demand across municipal, industrial, and agricultural sectors. Large population centers, frequent seasonal shortages, and disaster-prone zones further elevate fleet utilization. Government initiatives supporting water access, sanitation, and infrastructure expansion reinforce the region’s leadership. Competitive activity is diverse, with global and local manufacturers actively expanding their presence.
Asia Pacific is also slated to be the fastest-growing regional market, projected to exhibit an estimated 10.9% CAGR from 2026 to 2033, driven by infrastructure megaprojects and rising public investment in water distribution. Adoption of digital fleet systems and higher-capacity trucks is accelerating, particularly in countries undergoing rapid industrialization. Growing environmental awareness is pushing operators toward cleaner engines and compliant water transport solutions. As demand rises across construction, municipal supply, agriculture, and emergency response, the Asia Pacific region represents the strongest long-term opportunity for original equipment manufacturers (OEMs) and service providers. Its scale, population dynamics, and expanding infrastructure make it the most influential region for future market growth.
Competitive Landscape
The global water truck market structure remains moderately consolidated, with established companies such as Curry Supply, Ledwell, Caterpillar, and Bucher Municipal driving product innovation and fleet reliability. Major vendors focus on reinforced tank structures, efficient pumping systems, and emission-compliant powertrains suited for construction, mining, firefighting, and municipal services. Strong supply chain integration supports consistent tank fabrication, chassis availability, and rapid parts replacement. Many leaders also invest in telematics, fleet analytics, and automated spray-control technologies to improve operational efficiency. Their extensive dealer networks enable dependable after-sales support across regions. These strengths collectively help leading manufacturers maintain influence in mature, infrastructure-centric markets.
Emerging and regional manufacturers, including brands such as Foton, Tata Commercial Vehicles, and other local assemblers, are gaining momentum by targeting cost-sensitive buyers with customizable and low-maintenance models. Their flexible production processes allow quick adjustments in tanker capacity, off-road design, or pump configuration to meet varied terrain and municipal needs. Increasing demand for affordable water delivery in developing economies creates strong opportunities for smaller players to scale. Digital add-ons such as GPS tracking, remote tank monitoring, and simplified control panels are accelerating adoption among fleet operators. As price competitiveness intensifies, vendors emphasizing adaptability and value-focused engineering are rising in fast-growing segments.
Key Industry Developments
- In June 2025, Hydex converted Rokbak RA30 and RA40 articulated dump trucks into high-capacity water trucks to meet rising dust suppression needs on large jobsites across North America, particularly in quarries, mines, and infrastructure projects. These units pair powerful off-road haulers with 6,000 to 9,000 gallon tanks and advanced spray systems, offering a more versatile and stable alternative to conventional rigid-frame water trucks in demanding environments.
- In March 2025, XCMG launched fully electric water trucks in Brazil, targeting mining, agriculture, and sanitation applications. This move highlights the company’s regional focus and commitment to sustainable, zero-emission water transport solutions.
- In March 2025, Caterpillar introduced the Cat 789D, the first commercially available fully autonomous water truck for mining and haul-road operations. Integrated with the MineStar fleet-management system, it automates water delivery, monitors tank levels, and optimizes dust control.
Companies Covered in Water Truck Market
- Volvo Trucks
- Daimler Trucks
- Tata Motors
- Ashok Leyland
- Isuzu
- Hino Motors
- Kenworth
- Mack Trucks
- Freightliner Trucks
- Iveco
- MAN Truck & Bus
- Mitsubishi Fuso
Frequently Asked Questions
The global water truck market is projected to reach US$ 29.3 billion in 2026.
Expanding construction and mining activity, rising demand for dust suppression, urban water shortages, emergency relief requirements, and municipal fleet modernization with emissions-compliant and telematics-enabled trucks are driving the market.
The market is poised to witness a CAGR of 4.5% from 2026 to 2033.
Opportunities include off-road mining trucks, smart fleet telematics, high-capacity tanks, firefighting-integrated trucks, potable-water certified tankers, and growing demand in emerging markets across India, Southeast Asia, Africa, and Latin America.
Curry Supply, Ledwell, Caterpillar, Bucher Municipal, and Ahern are some of the key players in the market.


