


- Automation & Robotics
- Water Quality Monitoring Equipment Market
Water Quality Monitoring Equipment Market Size, Share, and Growth Forecast 2025 - 2032
Water Quality Monitoring Equipment Market By Product Type (Portable, Handheld, Benchtop), Application (Ground Water, Drinking Water, Wastewater, Aquaculture), Component (Sensors, Software), End-user (Government, Industrial, Others), and Regional Analysis for 2025 - 2032
Water Quality Monitoring Equipment Market Size and Trends Analysis
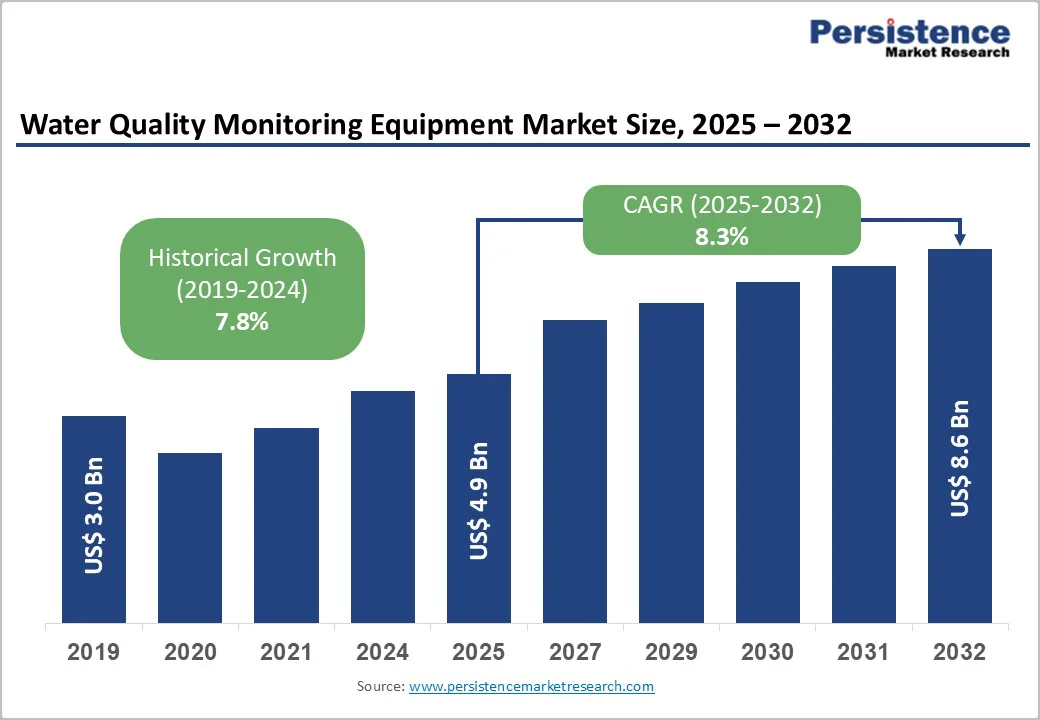
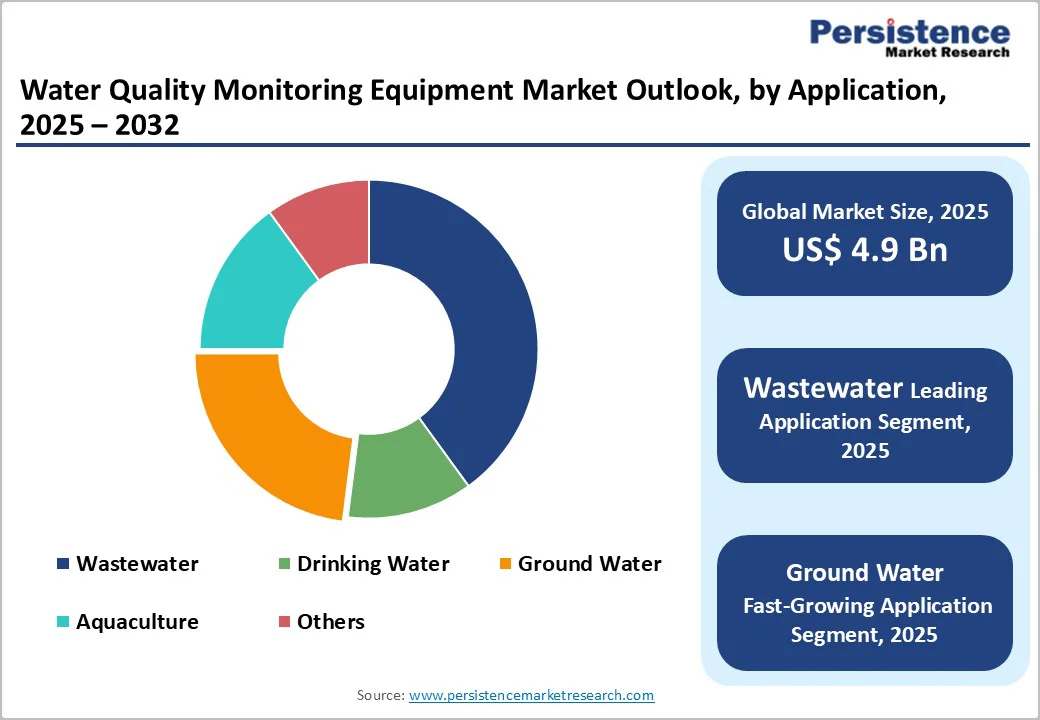
The global water quality monitoring equipment market size is likely to be valued at US$4.9 billion in 2025. It is expected to reach US$8.6 billion by 2032, growing at a CAGR of 8.3% from 2025 to 2032, driven by rising global concerns over water contamination and environmental sustainability, increasing demand from industrial and government regulatory mandates, and technological advancements, including IoT integration for real-time monitoring.
Key Industry Highlights
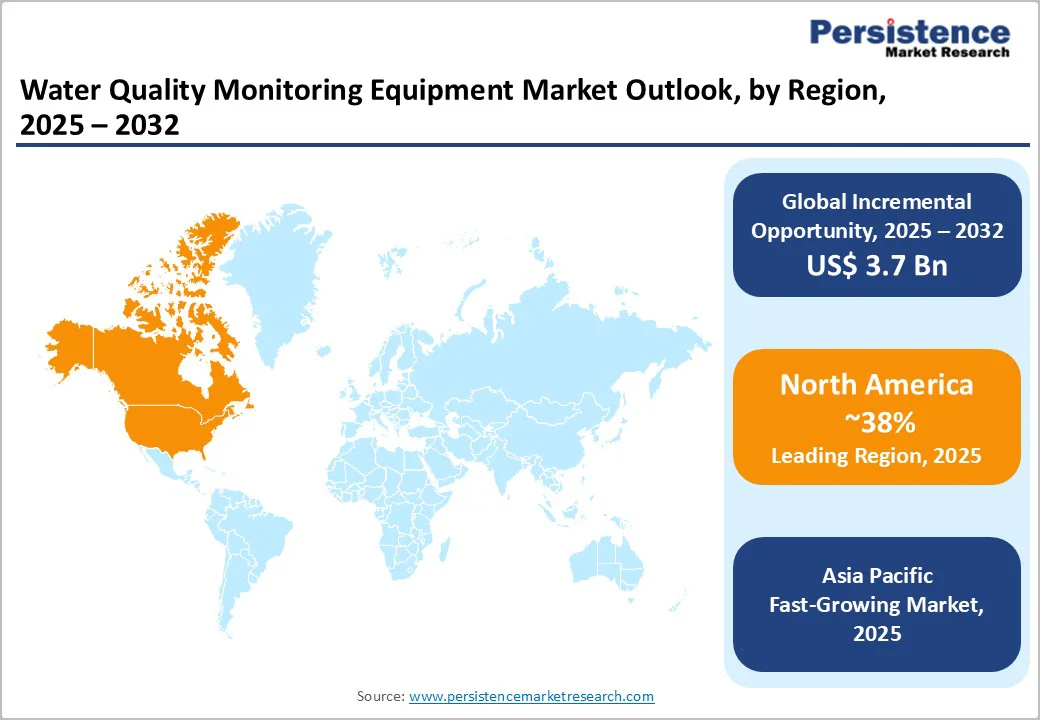
- Leading Region: North America leads the market with around 38% share, driven by stringent EPA regulations, strong industrial infrastructure, and widespread adoption of IoT-based monitoring technologies.
- Fastest-growing Region: Asia Pacific is the fastest-growing region, driven by rapid industrialization, expanding manufacturing and agriculture sectors, and government incentives that support technology adoption across infrastructure projects.
- Leading Product Type: The handheld segment leads the water quality monitoring equipment market, capturing around 40% share, owing to its portability, precision, and advanced features such as miniaturization and wireless connectivity.
- Fastest-Growing Product Type: The portable segment is the fastest-growing, driven by the rising demand for real-time field analysis in remote and agricultural areas.
- Leading Application: The industrial wastewater monitoring segment leads the market with over 35% market share, driven by strict discharge regulations and increasing industrial effluent volumes.
- Fastest-growing Application: The groundwater segment is the fastest-growing, driven by rising concerns over aquifer contamination and the push for sustainable water resource management.
- Leading Component: Sensors dominate the market, accounting for more than 55% of the share, due to their critical function in precisely measuring key water parameters such as pH, turbidity, and dissolved oxygen.
- Leading End-user Type: The industrial segment leads the market, accounting for about 35% of the market, supported by strong demand from the manufacturing, chemical, and pharmaceutical industries for wastewater monitoring and process optimization.
| Key Insights | Details |
|---|---|
| Market Size (2025E) | US$4.9 Bn |
| Market Value Forecast (2032F) | US$8.6 Bn |
| Projected Growth CAGR (2025 - 2032) | 8.3% |
| Historical Market Growth (2019 - 2024) | 7.8% |
Market Factors - Growth, Barriers, and Opportunity Analysis
Stringent Environmental Regulations and Government Policies
The growing enforcement of stringent environmental regulations and government initiatives to promote sustainable water management are major drivers of the water quality monitoring equipment market. Regulatory bodies such as the U.S. EPA, EEA, and other international agencies mandate continuous water quality monitoring to protect ecosystems and public health. These strict standards drive industries, municipalities, and utilities to adopt advanced monitoring systems that deliver real-time, accurate data on key parameters such as pH, turbidity, and dissolved oxygen.
In developing regions, rapid industrialization and growing concerns over water pollution have prompted the introduction of stricter national water management programs, such as India’s National Water Quality Monitoring Programme and China’s Water Pollution Prevention and Control Action Plan. These initiatives are driving large-scale adoption of IoT-enabled sensors, cloud-based analytics, and integrated water management platforms.
High Initial Investments and Maintenance Costs
High initial investments and maintenance costs act as significant restraints in the water quality monitoring equipment market. Advanced monitoring systems, particularly those integrated with IoT, AI, and cloud-based technologies, require substantial upfront expenditure for installation, calibration, and integration with the existing infrastructure. This poses a challenge for small and medium-scale industries, municipalities, and organizations with limited budgets, especially in developing regions.
Maintaining the accuracy and reliability of monitoring systems demands regular calibration, sensor replacement, and skilled technical support, further increasing operational costs. The complexity of managing data from multiple sensors and ensuring compliance with varying regional standards also adds to the financial burden. Many end users opt for basic or manual monitoring solutions, limiting the adoption of sophisticated systems.
Emergence of Smart Cities and Infrastructure Investments
The rapid development of smart cities and rising global infrastructure investments present a significant opportunity for the water quality monitoring equipment market. Governments and urban planners are increasingly prioritizing sustainable water management as part of smart city initiatives, integrating IoT-enabled sensors and real-time monitoring systems into urban water networks. These technologies support efficient resource utilization, leak detection, and pollution control, ensuring the delivery of safe and clean water to urban populations.
Infrastructure modernization projects across regions such as the Asia Pacific, North America, and the Middle East are further boosting demand for advanced water monitoring solutions. Large-scale investments in water treatment plants, distribution systems, and environmental surveillance networks are creating opportunities for continuous, data-driven water quality management.
Category-wise Analysis
Product Type Insights
The handheld segment leads the global market, capturing over 40% of the total revenue share in 2025, driven by its exceptional balance of portability, accuracy, and user convenience. Handheld devices are extensively used across industries, research institutions, and environmental monitoring agencies for on-site testing of critical parameters such as pH, dissolved oxygen, turbidity, and conductivity.
Their compact design and ease of use make them ideal for field applications, where quick, reliable measurements are essential.
The portable segment is emerging as the fastest-growing category. The growing need for real-time water analysis in remote, agricultural, and industrial settings is driving growth. Portable systems offer greater flexibility, durability, and multi-parameter testing capabilities, making them suitable for harsh environments and continuous field operations.
The integration of IoT and AI-driven analytics in portable units enhances performance by enabling automated data collection and predictive diagnostics.
Application Insights
The industrial wastewater monitoring segment is projected to lead the market, capturing over 35% share in 2025. This growth is driven by stricter enforcement of discharge regulations and the increasing volume of effluents from industries such as chemicals, manufacturing, pharmaceuticals, and food processing.
To comply with environmental standards and reduce ecological impacts, industries are increasingly adopting advanced monitoring solutions, such as Hach’s IntelliCAL probes and Yokogawa’s Water Quality Monitoring Systems, which are widely used for precise and real-time industrial wastewater analysis.
The groundwater segment is the fastest-growing category, driven by rising concerns over groundwater depletion, aquifer contamination, and the increasing demand for sustainable water resource management. Governments and environmental agencies are implementing continuous groundwater monitoring programs to ensure safe drinking water and prevent pollution from agricultural runoff and industrial waste.
Advanced technologies, such as Campbell Scientific’s CR6 datalogger paired with groundwater sensors, enable continuous measurement of water levels and quality parameters, with real-time data transmission via IoT networks. These systems are widely used by environmental agencies and research organizations, facilitating sustainable groundwater management and effective tracking of contamination.
Component Type Insights
Sensors dominate the market, accounting for over 55% of the market share in 2025, due to their critical role in accurately detecting key water parameters such as pH, turbidity, conductivity, and dissolved oxygen. Their widespread adoption across industrial, municipal, and environmental applications is driven by the increasing need for precise, real-time water analysis to meet regulatory and operational requirements.
Commonly used solutions include Hanna Instruments’ multi-parameter water quality sensors and Thermo Fisher Scientific’s Orion sensors, which provide reliable measurements across diverse settings. Ongoing innovations in sensor miniaturization, wireless connectivity, and durability further enhance performance and enable seamless IoT integration for efficient, continuous data monitoring.
The software segment is expected to grow the fastest, driven by advancements in artificial intelligence, machine learning, and cloud computing. Modern software platforms facilitate data analytics, visualization, and predictive modeling, allowing operators to interpret complex datasets and make informed decisions in real time.
These digital solutions enhance operational efficiency by enabling remote monitoring, anomaly detection, and proactive maintenance. For example, Trimble Water’s WaterSight Platform leverages cloud computing and advanced analytics to monitor water networks, detect anomalies, predict maintenance needs, and optimize water resource management in real time.
End-user Insights
The industrial segment leads the market, accounting for around 35% of total revenue. It is driven by strong demand from the manufacturing, chemical, and pharmaceutical sectors for wastewater monitoring and process optimization. Industries are increasingly adopting advanced monitoring systems to comply with stringent discharge regulations and improve operational efficiency.
Real-time data analytics and automation enhance water management efficiency and compliance, strengthening the segment’s market leadership.
The government segment is witnessing rapid growth, propelled by initiatives focused on public health, environmental protection, and regulatory compliance. National and regional authorities are investing in large-scale water quality surveillance programs to monitor drinking water, rivers, and wastewater treatment facilities.
IoT and cloud-based systems enhance data transparency and contamination detection, while smart city initiatives boost government adoption of advanced monitoring technologies.
Regional Insights
North America Water Quality Monitoring Equipment Market Trends
North America holds a leading position in the market, accounting for 38% share, driven by stringent environmental regulations, advanced industrial infrastructure, and widespread adoption of smart monitoring technologies. The U.S. Environmental Protection Agency (EPA) plays a central role in enforcing strict water quality standards, compelling industries, municipalities, and utilities to invest in high-precision monitoring systems.
Technological innovation is a defining trend in the region, with manufacturers developing next-generation sensors, cloud-based platforms, and automated systems to enhance data accuracy and compliance efficiency. Increasing investment in smart water infrastructure, digital transformation initiatives, and sustainability-driven projects continues to strengthen the market outlook.
With increased focus on public health and regulations, North America is set to maintain its leadership in advancing water-quality monitoring technologies.
Europe Water Quality Monitoring Equipment Market Trends
Europe represents a robust market for water quality monitoring equipment, driven by stringent environmental regulations, advanced water management infrastructure, and a strong commitment to sustainability. The region’s leadership is reinforced by the European Environment Agency (EEA) and the EU Water Framework Directive, which mandate regular monitoring of surface, groundwater, and wastewater to maintain high-quality standards.
Technological innovation and circular economy initiatives are the key trends shaping the European market. The adoption of IoT-enabled sensors, AI-based data analytics, and cloud-connected monitoring platforms is enhancing operational efficiency and transparency across the region.
The growing emphasis on sustainable resource management, coupled with government incentives for smart water infrastructure, is accelerating the transition toward automated, data-driven monitoring solutions.
Asia Pacific Water Quality Monitoring Equipment Market Trends
Asia Pacific is the fastest-growing region in the water quality monitoring equipment market, driven by rapid industrialization, urbanization, and expanding infrastructure development across China, Japan, India, and South Korea. The region’s growth is fueled by increasing water pollution levels, rising demand for clean drinking water, and government-led initiatives to strengthen water management frameworks.
Growing investments in wastewater treatment, industrial effluent control, and agricultural water monitoring further support market expansion. Technological adoption is accelerating across the region, with emphasis on affordable, IoT-enabled, and portable monitoring solutions suited for diverse applications.
Local manufacturers are focusing on cost-effective innovations, while international players are expanding their presence through partnerships and technology transfers.
Competitive Landscape
The global water quality monitoring equipment market exhibits a moderately fragmented structure, with global leaders such as Xylem Inc., Thermo Fisher Scientific, Danaher Corporation, Hanna Instruments, and Horiba Ltd. dominating through comprehensive product portfolios and advanced technology integration. These companies emphasize innovation through IoT-enabled systems, AI analytics, and cloud solutions for real-time monitoring and predictive maintenance.
Their strong global distribution networks and continuous product upgrades ensure competitive advantage, particularly in regulatory-driven markets including North America and Europe. Regional players and start-ups are gaining traction by offering cost-effective and portable solutions tailored to local requirements, especially in emerging markets across Asia Pacific and Latin America.
Key Industry Developments:
- In May 2025, YSI launched HydroRIG, an all-in-one IoT gateway that simplifies environmental monitoring. Combining a data logger and modem in one compact device, HydroRIG transmits sensor data directly to YSI’s HydroSphere cloud for real-time access and visualization. Supporting multiple sensor types, it enhances data security and allows users to monitor, manage, and share environmental data effortlessly, streamlining water quality and environmental monitoring.
- In November 2025, Veralto announced a definitive agreement to acquire In-Situ for ~US$422 Million post-tax benefits, valuing it at 19x its estimated 2025 EBITDA, including synergies. This bolsters Veralto's environmental monitoring with In-Situ's water-quality sensors and data solutions, enhancing real-time groundwater/surface monitoring amid rising IoT and regulatory demands.
Companies Covered in Water Quality Monitoring Equipment Market
- Thermo Fisher Scientific Inc.
- Danaher Corporation
- Xylem Inc.
- Horiba, Ltd.
- Hach Company
- Teledyne Technologies Incorporated
- General Electric Company
- Agilent Technologies, Inc.
- Honeywell International Inc.
- ABB Ltd.
- Emerson Electric Co.
- Endress+Hauser Group Services AG
- Yokogawa Electric Corporation
- Shimadzu Corporation
- SUEZ Water Technologies & Solutions
- Pentair plc
- Aqua Metrology Systems Ltd.
- OTT Hydromet
- In-Situ Inc.
- Hanna Instruments, Inc.
Frequently Asked Questions
The water quality monitoring equipment market is valued at US$4.9 billion in 2025 and expected to reach US$8.6 billion by 2032, reflecting robust growth.
Key drivers include stringent environmental regulations, technological advances in sensors and IoT integration, and rising industrial and urban wastewater treatment needs.
The handheld product type leads, holding approximately 40% market share due to its balance of mobility and measurement precision.
North America dominates, capturing over 38% driven by regulatory frameworks and technological innovation.
Integrating IoT and AI-driven smart monitoring solutions for real-time water quality analysis and predictive maintenance.


