


- Specialty & Fine Chemicals
- Specialty Cosmetic Ingredients Market
Specialty Cosmetic Ingredients Market Size, Share, and Growth Forecast 2026 - 2033
Specialty Cosmetic Ingredients Market by Ingredient Type (Surfactants, Emollients, Actives, Conditioning Polymers, Preservatives, Others), Source (Synthetic, Natural, Hybrid), Application (Skincare, Haircare, Makeup, Fragrance, Oral Care, Others), and Regional Analysis for 2026 - 2033
Specialty Cosmetic Ingredients Market Size and Trend Analysis
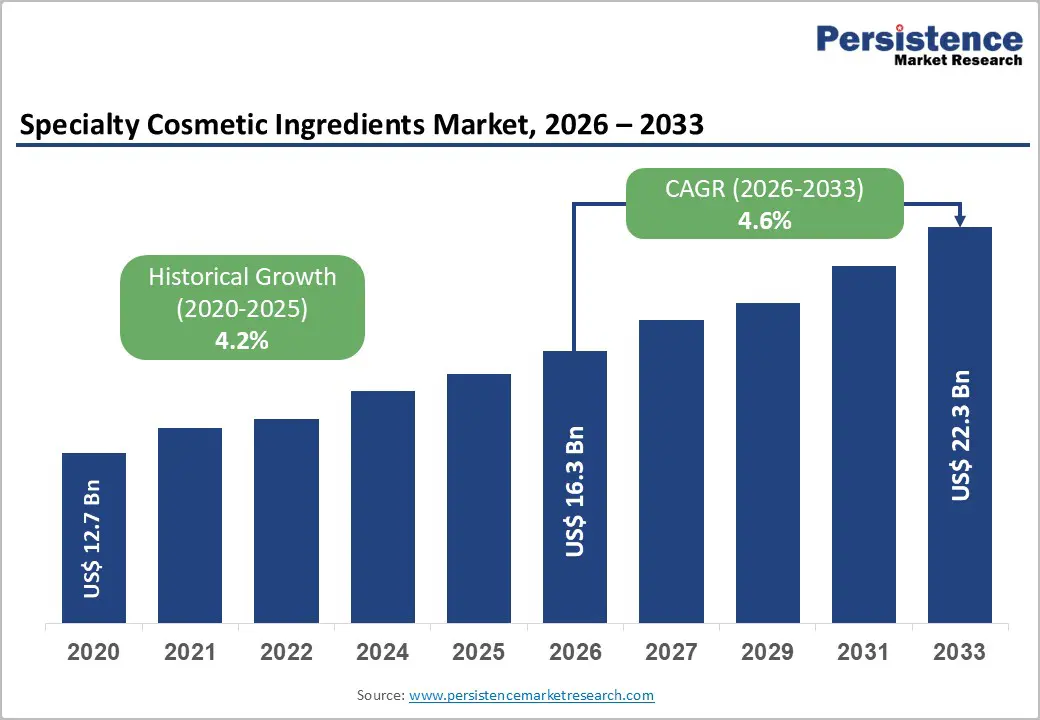
The global specialty cosmetic ingredients market is valued at US$ 16.3 Bn in 2026 and is projected to reach US$ 22.3 Bn by 2033, growing at a CAGR of 4.6% between 2026 and 2033. This growth trajectory is being driven primarily by surging consumer demand for high-performance, multifunctional, and nature-derived cosmetic formulations.
The shift toward clean beauty, personalized skincare, and sustainability-conscious product development has compelled ingredient manufacturers to innovate rapidly, expanding their portfolios with biotechnology-derived actives, bio-based emollients, and biodegradable surfactants. Additionally, the rising purchasing power of middle-class consumers in the Asia Pacific, coupled with increasing beauty consciousness globally, continues to fuel sustained demand for specialty cosmetic ingredients across skincare, haircare, and makeup applications.
Key Industry Highlights:
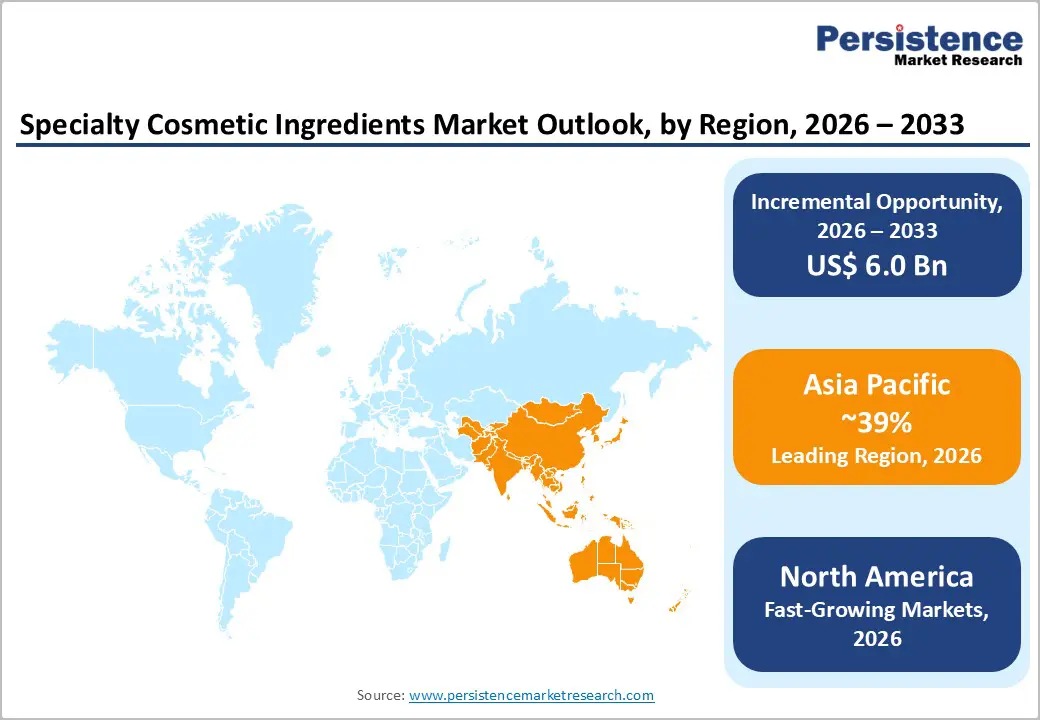
- Leading Region: Asia Pacific dominates the specialty cosmetic ingredients market with approximately 39% revenue share in 2026, supported by rapid urbanization, rising consumer spending on beauty, and significant capacity investments by global ingredient suppliers targeting China, India, and Southeast Asia.
- Fast-Growing Region: North America is projected to be the fastest-growing regional market driven by strong premiumization trends, the MoCRA regulatory framework, expanding clean beauty demand, and robust digital retail channels, contributing to 30% online beauty sales growth in 2024.
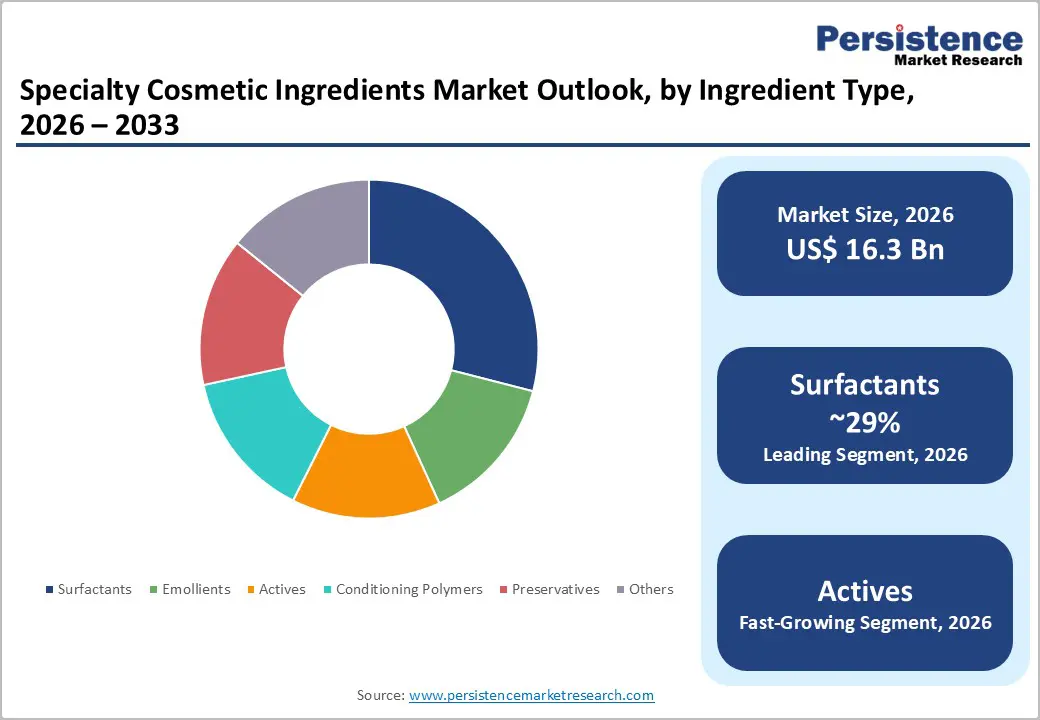
- Dominant Segment: Surfactants lead the ingredient type category with approximately 29% market share in 2026, underpinned by their universal use across cleansing, emulsification, and foaming applications, and growing demand for mild, plant-derived specialty surfactant variants.
- Fast-Growing Ingredient Type: The actives segment encompassing peptides, botanical extracts, vitamins, and fermentation-derived bioactives is the fastest-growing ingredient category, propelled by product premiumization and consumer demand for scientifically validated, clean beauty-compliant skincare solutions.
- Key Opportunity: Biotechnology-enabled ingredient development and the growing personalized skincare trend offer the most significant opportunity for market participants, with the global biotech beauty ingredients sector projected to grow at approximately 7.83% CAGR through 2034, creating demand for innovative, proprietary actives across premium skincare and haircare applications.
DRO Analysis
Drivers - Rising Consumer Demand for Natural and Clean Beauty Formulations
The global shift towards clean-label, natural, and sustainable cosmetic formulations is a key growth driver for the specialty cosmetic ingredients market. Consumers in North America, Europe, and the Asia Pacific increasingly prioritize ingredient transparency, favoring plant-derived, cruelty-free, and biodegradable alternatives over synthetic chemicals. Research from Euromonitor International highlights that since 2019, more U.S. consumers are seeking skincare products with specific ingredients, dermatologist-tested claims, and clinical efficacy, indicating a significant change in consumer behavior.
This trend has led to heightened demand for specialty actives, including botanical extracts and bio-based surfactants. In response, ingredient suppliers are investing in green chemistry and renewable feedstock-based products, exemplified by BASF SE’s launch of the Emulgate® Verde line of COSMOS- and NATRUE-approved natural emulsifiers at the SEPAWA Congress 2024. This momentum is expected to drive long-term premiumization across the specialty ingredients value chain.
Technological Advancements in Biotechnology and Active Ingredient Delivery
Technological innovation is reshaping the specialty cosmetic ingredients landscape, with biotechnology, microencapsulation, fermentation science, and AI-assisted formulation significantly expanding the scope and efficacy of ingredient offerings. Fermentation-derived ingredients, AI-designed peptides, encapsulated actives, and nano-delivery systems enable formulators to create more targeted and efficacious products while reducing the environmental footprint.
Generative AI is reshaping the beauty industry, with estimates suggesting it could add approximately US$ 9-10 Bn to the global economy through applications such as accelerating time-to-market with regulatory-compliant, plant-based formulas. These advancements reduce R&D cycles, lower reformulation costs, and allow specialty ingredient suppliers to differentiate through proprietary, high-margin active systems.
Restraints - Increasingly Stringent Global Regulatory Compliance Requirements
The specialty cosmetic ingredients market faces growing headwinds from tightening regulatory frameworks across key markets, particularly in the European Union. Under EU Cosmetics Regulation (EC) No. 1223/2009, the European Commission has progressively expanded its list of prohibited and restricted substances. The Omnibus Act VII Regulation, effective September 1, 2025, added new CMR (carcinogenic, mutagenic, or reprotoxic) substances to the banned list, including several UV filters, Vitamin A derivatives (Retinol, Retinyl Acetate, Retinyl Palmitate), and others.
The Omnibus Act VIII regulation further expands bans with a compliance deadline of May 1, 2026. This regulatory churn forces ingredient manufacturers and formulators to continuously reformulate, incurring significant R&D costs, reformulation timelines, and compliance expenditures, thereby creating barriers for smaller players and slowing product launch cycles.
Supply Chain Volatility and High Cost of Premium Raw Materials
Specialty cosmetic ingredient manufacturers face persistent challenges related to supply chain instability and the elevated cost of premium, sustainably sourced raw materials. According to Cosmetics & Toiletries magazine (April 2024), lead times for specialty ingredients increased from 12 to 24 weeks during the post-pandemic disruption period of 2022, compared to a pre-pandemic standard of roughly 3 weeks.
While lead times are normalized by the end of 2023, underlying pressures related to naturally derived ingredient consistency, driven by labor availability, plant cultivation seasonality, and creative sourcing strategies, remain. These supply-side constraints increase the cost of goods sold for natural and bio-based specialty ingredients, compressing margins for mid-sized formulators and creating pricing pressure across the value chain.
Opportunities - Expanding Demand for Biotechnology-Derived and Bio-Based Specialty Actives
Biotechnology represents a significant and rapidly growing opportunity for specialty cosmetic ingredient manufacturers, particularly in the development of fermentation-derived actives, bioengineered peptides, and plant-cell-culture-based extracts. Consumer demand for science-backed, high-efficacy, and yet sustainably produced ingredients is driving brands and formulators toward this category. More than 47% of new ingredient launches now contain botanical compounds derived from algae, fruits, and medicinal plants, indicating a decisive pivot toward bio-based specialty ingredients.
Concurrently, around 34% of cosmetic ingredient R&D projects utilize microbial fermentation processes, enabling the cost-effective production of previously rare bioactives such as hyaluronic acid, ceramides, and bakuchiol. The growing commercial availability of AI-assisted ingredient screening platforms and green synthesis routes further accelerates the pipeline of novel actives, offering ingredient suppliers the opportunity to launch differentiated, patent-protected specialty products for premium skincare and personal care brands.
Growth of Personalized Skincare and Emerging Market Penetration
Personalization is a fast-emerging paradigm in the cosmetics industry, creating substantial new demand for specialty ingredients tailored to diverse skin types, tones, and concerns. Brands are leveraging diagnostic tools, AI-powered skin analysis, and dermatological research to develop bespoke formulations, necessitating a wider palette of specialty actives, emollients, and conditioning polymers. According to Euromonitor data referenced by C&T’s 2025 Beauty Accelerate event, there is a marked increase in consumer demand for dermatologist-tested and ingredient-specific products in the U.S.
Concurrently, emerging economies in the Asia Pacific, particularly India, Vietnam, and Indonesia, represent under-penetrated, high-growth markets for premium cosmetic ingredients, supported by rapid urbanization, rising disposable incomes, and the proliferation of international beauty brands. DSM-Firmenich announced an investment of over US$ 100 Mn in India (September 2024) to expand its business and make India an export base for ingredients, validating this opportunity.
Category-wise Analysis
Ingredient Type Insights
By ingredient type, surfactants hold the leading position in the specialty cosmetic ingredients market, accounting for approximately 29% of total revenue in 2026. Surfactants are foundational to a broad range of cosmetic product categories, from facial cleansers and shampoos to body washes and baby care products, owing to their multifunctional role in cleansing, foaming, emulsification, and solubilization.
Industry data from Kline & Company had placed combined surfactant consumption across the U.S., EU, India, Japan, China, and Southeast Asia at over 507 million pounds in a prior benchmark period, reflecting the sheer volume scale of this category. While commodity surfactants face margin compression, specialty mild surfactants, including alkyl polyglucosides, acyl isethionates, and betaines derived from renewable plant sources, are gaining significant traction in premium and sensitive skin formulations, adding incremental value to this leading segment. The emollients segment is the second-largest, driven by skin moisturization trends.
Source Insights
By source, synthetic ingredients continue to dominate the specialty cosmetic ingredients market, representing approximately 61% of total market share in 2026. The dominance of synthetic ingredients is primarily attributed to their cost-effectiveness, formulation consistency, extended shelf stability, and scalability of production, factors that are critical for mass-market personal care brands operating across global supply chains. Synthetic polymers, silicones, and emulsifiers continue to underpin key product performance attributes such as water resistance, viscosity control, and sensory enhancement.
However, the natural and bio-based segment is experiencing the fastest growth trajectory within the source category, driven by accelerating clean beauty regulations, particularly under EU Cosmetics Regulation (EC) No. 1223/2009, and shifting consumer preference for plant-derived and biotechnology-origin ingredients certified under standards such as COSMOS and NATRUE. The hybrid segment, combining natural and synthetic elements to optimize both performance and sustainability, is also gaining interest among formulators seeking balanced solutions.
Application Insights
By application, skincare is the dominant segment in the specialty cosmetic ingredients market, commanding approximately 38% share in 2026 and projected to reach a valuation of US$ 8 Bn in the near future. The dominance of this segment reflects high per-capita expenditure on skincare products, sustained premiumization, and the convergence of cosmetics with dermatology, a trend widely referred to as the rise of dermocosmetics. Consumer focus on anti-aging, brightening, hydration, and microbiome-friendly formulations is driving robust demand for specialty actives such as peptides, hyaluronic acid, ceramides, retinoids, and botanical antioxidants.
Haircare is the second-largest application, while makeup formulations are increasingly integrating skincare-grade specialty actives, further expanding the addressable market.
Regional Insights
North America Specialty Cosmetic Ingredients Market Trends & Analysis
North America holds a significant share of the global specialty cosmetic ingredients market, representing approximately 24% of global revenue in 2026, and is projected to be the fastest-growing region through 2033. Growth is underpinned by strong consumer spending on premium skincare and personal care, a well-established retail ecosystem spanning specialized beauty platforms such as Sephora and Ulta Beauty, and increasing regulatory activity under the Modernization of Cosmetics Regulation Act (MoCRA).
U.S. Specialty Cosmetic Ingredients Market Size
The U.S. accounts for approximately 88% of the North American specialty cosmetic ingredients market. The market is shaped by strong investment in premium ingredient R&D, stringent labelling compliance under MoCRA, and a highly competitive retail environment that rewards innovation and efficacy-backed claims. Online sales of beauty and personal care products in the U.S. grew by 30% in 2024, creating new demand signals for specialty ingredient suppliers. The geopolitical impact of U.S. tariff policies on imported raw materials from China and India, particularly plant extracts, amino acids, and synthetic actives, has moderately elevated input costs for domestic formulators, prompting some supply chain realignment toward domestic sourcing or allied-country suppliers.
Europe Specialty Cosmetic Ingredients Market Trends, Drivers, & Insights
Europe is the second-largest regional market for specialty cosmetic ingredients, contributing approximately 27% of global market revenue in 2026. The region is simultaneously the most regulatory-intensive market globally, with the European Commission’s ongoing revisions to Regulation (EC) No. 1223/2009, including Omnibus Acts VI, VII, and VIII, driving continuous reformulation requirements. Geopolitically, the Russia-Ukraine conflict continues to affect energy prices and European manufacturing costs, while shifting supply chain strategies for ingredients sourced from Eastern Europe and Central Asia.
However, regulatory pressure also serves as an innovation catalyst: European brands and ingredient suppliers lead globally in the adoption of green chemistry, bio-based feedstocks, and sustainable packaging. The region holds the largest share in the biotech beauty ingredient space, with a 38% market share in 2024 per industry webinar data cited by cosmetics & toiletries.
Germany Specialty Cosmetic Ingredients Market Size
Germany is Europe’s largest specialty cosmetic ingredients market, estimated at approximately US$ 1.3 billion in 2026. Home to global leaders such as BASF SE, Evonik Industries AG, and Symrise AG, the country is a central hub for ingredient innovation, with robust academic-industry collaboration and strong export capability.
U.K. Specialty Cosmetic Ingredients Market Size
U.K. specialty cosmetic ingredients market is likely to be valued at approximately US$ 700 Mn in 2026. Post-Brexit regulatory divergence from EU Cosmetics Regulation (EC) No. 1223/2009 has created dual compliance needs for ingredient suppliers serving both markets, while the presence of Croda International Plc anchors the domestic specialty ingredient supply ecosystem.
France Specialty Cosmetic Ingredients Market Size
France is perceived as the epicenter luxury beauty on a global scale, it represents a specialty cosmetic ingredient market estimated at approximately US$ 750 Mn in 2026. The dominance of major beauty conglomerates such as L’Oréal and LVMH sustains strong domestic demand for premium specialty actives, plant extracts, and fragrance-grade specialty ingredients, aligning with France’s position as a global center of cosmetic R&D and innovation.
Asia Pacific Specialty Cosmetic Ingredients Market Drivers & Analysis
Asia Pacific dominates the global specialty cosmetic ingredients market with approximately 39% revenue share in 2026, driven by rapid urbanization, rising middle-class disposable incomes, and the region’s strong beauty culture across China, South Korea, Japan, and India. The region is also the fastest-growing destination for international ingredient suppliers expanding their manufacturing and distribution footprints.
China Specialty Cosmetic Ingredients Market Size
China represents the largest individual country market in Asia Pacific, with specialty cosmetic ingredient demand estimated at approximately US$ 3.5 billion in 2026. The country’s booming beauty sector, regulatory modernization under the National Medical Products Administration (NMPA), and growing domestic brand presence are driving demand for sophisticated specialty ingredients, particularly skincare actives and functional polymers. Geopolitical dynamics, including U.S.-China trade tensions, ongoing U.S. tariff escalations, and supply chain diversification strategies by global brands, are reshaping ingredient sourcing patterns.
India Specialty Cosmetic Ingredients Market Size
India’s specialty cosmetic ingredients market is estimated at approximately US$ 750 Mn in 2026, growing at an above-average CAGR driven by a young, digitally engaged consumer base, rapid expansion of organized beauty retail, and growing interest in Ayurvedic and natural cosmetic formulations, creating robust demand for botanical specialty ingredients.
Japan Specialty Cosmetic Ingredients Market Size
Japan, a global leader in cosmetic innovation and dermatological research, represents a specialty cosmetic ingredients market estimated at approximately US$ 1.2 Bn in 2026. The country’s emphasis on high-performance skincare, distinctive formulation aesthetics, and the dominance of Kao Corporation as a key domestic ingredient supplier and beauty brand reinforce Japan’s position as a sophisticated, high-value specialty ingredient market.
Competitive Landscape
The global specialty cosmetic ingredients market is moderately consolidated, with a handful of multinational chemical and specialty chemical companies, led by BASF SE, Evonik Industries AG, Croda International Plc, and Clariant AG, commanding significant market influence through diversified portfolios, global manufacturing networks, and sustained R&D investment. The top five players collectively hold approximately 55% of the market share in the U.S. personal care ingredient sector. Emerging business models include digital formulation platforms and direct-to-formulator ingredient sales through e-commerce and distribution networks, enabling smaller specialty ingredient innovators to compete effectively.
Key Developments:
- April 2026: Evonik Industries announced the unveiling of a new beauty and personal care identity at in-cosmetics Global 2026 in Paris, alongside a broad portfolio of innovative specialty cosmetic ingredients focused on sustainability, biotechnology, and high-performance beauty formulations.
- April 2026: Croda International Plc announced the launch of Matrixyl® Neolide™, a next-generation peptide ingredient designed for advanced skincare applications. The new ingredient builds on Croda’s long-established Matrixyl peptide technology by incorporating a patented encapsulation system that enables controlled peptide release for up to 15 days after application.
- April 2026: Symrise AG announced the launch of several innovations at in-cosmetics Global 2026 in Paris, reinforcing its strategic focus on longevity, inner beauty, and science-driven skincare solutions in the specialty cosmetic ingredients market. The company introduced three new cosmetic ingredients, Cellexora® MD, Mindera® Euca, and SymConcentrole® Barrier Boost, while also presenting concepts from its newly established Care & Wellness Division.
Top Companies in the Specialty Cosmetic Ingredients Market
- BASF SE (Ludwigshafen, Germany) is the world’s largest chemical company and a dominant force in specialty cosmetic ingredients, offering an extensive portfolio spanning surfactants, emulsifiers, UV filters, polymers, and cosmetic actives through its Care Chemicals division. The company’s Care 360°, Solutions for Sustainable Life strategy integrates sustainability, digitalization, and innovation. Its recent Emulgate® Verde launch and sustained investment in bio-based and fermentation-derived ingredient platforms reinforce its market leadership.
- Evonik Industries AG (Essen, Germany) is a key specialty chemicals player with a dedicated Care Solutions business line serving the global cosmetic ingredients sector. The company is recognized for its expertise in rheology modifiers, conditioning polymers, specialty surfactants, and microbiome-friendly bioactives. Evonik received EU regulatory approval in Q4 2024 for a new biodegradable cosmetic polymer and has accelerated its use of AI in ingredient screening, partnering with GenScript to screen 10,000 peptide sequences weekly, enabling the development of bespoke actives within a year.
- Croda International Plc (Snaith, U.K.) is a leading British specialty chemical company with a strong focus on sustainable, bio-based, and high-performance cosmetic ingredients. Its Consumer Care segment serves the global beauty and personal care industry with emollients, peptide actives, UV protection ingredients, and conditioning agents.
Companies Covered in Specialty Cosmetic Ingredients Market
- BASF SE
- Evonik Industries AG
- Croda International Plc
- DSM-Firmenich AG
- Clariant AG
- Givaudan SA
- Symrise AG
- The Dow Chemical Company
- Ashland Global Holdings
- Lonza Group Ltd.
- Solvay SA
- Wacker Chemie AG
- Eastman Chemical Company
- Nouryon Chemicals
- Kao Corporation
Frequently Asked Questions
The global specialty cosmetic ingredients market is valued at US$ 16.3 Bn in 2026 and is projected to reach US$ 22.3 Bn by 2033, expanding at a CAGR of 4.6% during the forecast period, driven by sustained demand for multifunctional, natural, and biotechnology-derived cosmetic ingredients globally.
The primary growth drivers include the rapid global shift toward clean beauty and natural/sustainable formulations, compelling brands to adopt bio-based and biodegradable specialty ingredients, and technological advancements in biotechnology, fermentation science, AI-assisted ingredient screening, and microencapsulation, enabling the development of high-performance, scientifically validated specialty actives.
The surfactants segment leads the Ingredient Type category with approximately 29% market share in 2026. Their dominance is attributed to essential roles in cleansing, foaming, emulsification, and solubilization across a wide range of product categories, including shampoos, facial cleansers, and body washes. The growing demand for mild, plant-derived specialty surfactants for premium and sensitive skin formulations further sustains this segment’s leadership.
Asia Pacific is the leading region, commanding approximately 39% of global market revenue in 2025. The region’s dominance is driven by rapid urbanization, growing middle-class spending on beauty and personal care, a thriving domestic cosmetics industry in China, Japan, South Korea, and India, and significant investments by global specialty ingredient suppliers establishing production and innovation centers in the region.
The most significant market opportunity lies in biotechnology-derived and personalized specialty cosmetic actives. With the global biotech beauty ingredients market projected to grow at approximately 7.83% CAGR through 2034, and personalized skincare becoming mainstream, ingredient suppliers that can deliver proprietary, clinically validated, and sustainably produced actives, particularly peptides, fermentation-derived bioactive, and AI-designed ingredients, stand to capture premium margins and long-term brand partnerships.
The leading companies operating in the global Specialty Cosmetic Ingredients market include BASF SE, Evonik Industries AG, Croda International Plc, DSM-Firmenich AG, Clariant AG, Givaudan SA, Symrise AG, The Dow Chemical Company, Ashland Global Holdings Inc., Lonza Group Ltd., Solvay SA, Wacker Chemie AG, Eastman Chemical Company, Nouryon Chemicals, and Kao Corporation. These companies compete based on portfolio breadth, sustainability credentials, R&D capability, and geographic reach.


