Specialty Cosmetic Ingredients Market

Global Market Study on Specialty Cosmetic Ingredients: Increasing Per Capita Spending on Personal Care Fueling Demand

Specialty Cosmetic Ingredients Market Segmented By Emollients, Anionics Surfactants, Non-Anionics Surfactants, Cationics Surfactants, Amphoterics Surfactants, Conditioning polymers, Rheology control agents, UV absorbers, Emulsifiers, Antimicrobials Product Type

- Table of Content -

1. Executive Summary

    1.1. Market Overview

    1.2. Supply Trends

    1.3. Demand Trends

    1.4. Product Life Cycle

2. Market Introduction

    2.1. Market Taxonomy

    2.2. Market Definition

3. Market Background

    3.1. Macroeconomic Factors

        3.1.1. Global GDP Outlook

        3.1.2. Global Chemical Industry Outlook

        3.1.3. Global Surfactant Market

        3.1.4. Global Personal Care and Cosmetics Market

        3.1.5. Parent Market Outlook

        3.1.6. Value Chain Analysis

    3.2. Porter’s Five analysis

        3.2.1. Bargaining Power of Suppliers

        3.2.2. Bargaining Power of Buyers

        3.2.3. Threat of Substitutes

        3.2.4. Threat of New Entrants

        3.2.5. Intensity of Competition

    3.3. Key Regulations

    3.4. Supply Chain Analysis

        3.4.1. Raw Material Manufacturers

        3.4.2. End-users

        3.4.3. Distributors/ Suppliers

    3.5. Forecast Factors – Relevance & Impact

    3.6. Market Dynamics

        3.6.1. Drivers

        3.6.2. Restraints

        3.6.3. Opportunities

        3.6.4. Trend

4. Global Specialty Cosmetic Ingredients Market Analysis 2013–2017 and Forecast 2018–2026

    4.1. Market Volume Projections

    4.2. Pricing Analysis

    4.3. Market Size (US$ Mn) Projections

5. Global Specialty Cosmetic Ingredients Market Analysis 2013–2017 and Forecast 2018–2026, By Product Type

    5.1. Introduction

        5.1.1. Market Value Share Analysis By Product Type

        5.1.2. Y-o-Y Growth Analysis By Product Type

        5.1.3. Market Attractiveness By Product Type

    5.2. Historical Market Size (US$ Mn) and Volume By Product Type, 2013–2017

    5.3. Market Size (US$ Mn) and Volume Forecast By Product Type, 2018-2026

        5.3.1. Emollients

        5.3.2. Surfactants

            5.3.2.1. Anionics

            5.3.2.2. Non-ionics

            5.3.2.3. Cationics

            5.3.2.4. Amphoterics

            5.3.2.5. Others

        5.3.3. Conditioning Polymers

        5.3.4. Rheology Control agents

        5.3.5. UV Absorbers

        5.3.6. Emulsifiers

        5.3.7. Antimicrobials

        5.3.8. Others

    5.4. Global Specialty Cosmetic Ingredients Market Absolute $ Opportunity By Product Type, 2018 – 2026

6. Global Specialty Cosmetic Ingredients Market Analysis 2013–2017 and Forecast 2018–2026, By Application

    6.1. Introduction

        6.1.1. Market Value Share Analysis By Application

        6.1.2. Y-o-Y Growth Analysis By Application

        6.1.3. Market Attractiveness By Application

    6.2. Historical Market Size (US$ Mn) and Volume By Application, 2013–2017

    6.3. Market Size (US$ Mn), Market Attractiveness and Volume Forecast By Application, 2018-2026

        6.3.1. Skin Care

        6.3.2. Hair Care

        6.3.3. Oral care

        6.3.4. Makeup

        6.3.5. Fragrance

        6.3.6. Others

    6.4. Global Specialty Cosmetic Ingredients Market Absolute $ Opportunity By Application, 2018 – 2026

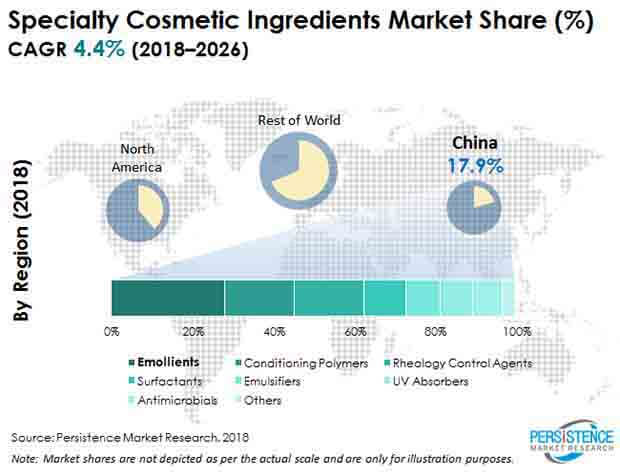
7. Global Specialty Cosmetic Ingredients Market Analysis and Forecast, By Region

    7.1. Introduction

        7.1.1. Market Value Share Analysis By Region

        7.1.2. Y-o-Y Growth Analysis By Region

        7.1.3. Market Attractiveness By Region

    7.2. Historical Market Size (US$ Mn) and Volume By Region, 2013–2017

    7.3. Market Size (US$ Mn) and Volume Forecast By Region, 2018-2026

        7.3.1. North America

        7.3.2. Latin America

        7.3.3. Europe

        7.3.4. SEAP

        7.3.5. MEA

        7.3.6. China

        7.3.7. Japan

    7.4. Global Specialty Cosmetic Ingredients Market Absolute $ Opportunity By Region, 2018 – 2026

8. North America Cosmetic Ingredients Market Analysis 2013–2017 and Forecast 2018–2026, By Product Type

    8.1. Introduction

        8.1.1. Market Value Share Analysis By Market Segments

        8.1.2. Y-o-Y Growth Analysis By Market Segments

        8.1.3. Market Attractiveness By Market Segments

    8.2. Pricing Analysis

    8.3. Historical Market Size (US$ Mn) and Volume By Market Segments, 2013–2017

    8.4. Market Size (US$ Mn) and Volume Forecast By Market Segments, 2018-2026

        8.4.1. By Country

            8.4.1.1. U.S.

            8.4.1.2. Canada

        8.4.2. By Product Type

        8.4.3. By Application

    8.5. North America Specialty Cosmetic Ingredients Market Absolute $ Opportunity By Country, 2018 – 2026

9. Latin America Cosmetic Ingredients Market Analysis 2013–2017 and Forecast 2018–2026, By Application

    9.1. Introduction

        9.1.1. Market Value Share Analysis By Market Segments

        9.1.2. Y-o-Y Growth Analysis By Market Segments

        9.1.3. Market Attractiveness By Market Segments

    9.2. Pricing Analysis

    9.3. Historical Market Size (US$ Mn) and Volume By Market Segments, 2013–2017

    9.4. Market Size (US$ Mn) and Volume Forecast By Market Segments, 2018-2026

        9.4.1. By Country

            9.4.1.1. Brazil

            9.4.1.2. Mexico

            9.4.1.3. Argentine

            9.4.1.4. Rest of LA

        9.4.2. By Product Type

        9.4.3. By Application

    9.5. Latin America Specialty Cosmetic Ingredients Market Absolute $ Opportunity By Country, 2018 – 2026

10. Europe Cosmetic Ingredients Market Analysis 2013–2017 and Forecast 2018–2026, By Application

    10.1. Introduction

        10.1.1. Market Value Share Analysis By Market Segments

        10.1.2. Y-o-Y Growth Analysis By Market Segments

        10.1.3. Market Attractiveness By Market Segments

    10.2. Pricing Analysis

    10.3. Historical Market Size (US$ Mn) and Volume By Market Segments, 2013–2017

    10.4. Market Size (US$ Mn) and Volume Forecast By Market Segments, 2018-2026

        10.4.1. By Country

            10.4.1.1. Germany

            10.4.1.2. UK

            10.4.1.3. Italy

            10.4.1.4. Spain

            10.4.1.5. France

            10.4.1.6. Benelux

            10.4.1.7. Russia

            10.4.1.8. Rest of Europe

        10.4.2. By Product Type

        10.4.3. By Application

    10.5. Europe Specialty Cosmetic Ingredients Market Absolute $ Opportunity By Country, 2018 – 2026

11. SEAP Cosmetic Ingredients Market Analysis 2013–2017 and Forecast 2018–2026, By Application

    11.1. Introduction

        11.1.1. Market Value Share Analysis By Market Segments

        11.1.2. Y-o-Y Growth Analysis By Market Segments

        11.1.3. Market Attractiveness By Market Segments

    11.2. Pricing Analysis

    11.3. Historical Market Size (US$ Mn) and Volume By Market Segments, 2013–2017

    11.4. Market Size (US$ Mn) and Volume Forecast By Market Segments, 2018-2026

        11.4.1. By Country

            11.4.1.1. India

            11.4.1.2. ASEAN

            11.4.1.3. ANZ

            11.4.1.4. Rest of SEAP

        11.4.2. By Product Type

        11.4.3. By Application

    11.5. SEAP Specialty Cosmetic Ingredients Market Absolute $ Opportunity By Country, 2018 – 2026

12. MEA Cosmetic Ingredients Market Analysis 2013–2017 and Forecast 2018–2026, By Application

    12.1. Introduction

        12.1.1. Market Value Share Analysis By Market Segments

        12.1.2. Y-o-Y Growth Analysis By Market Segments

        12.1.3. Market Attractiveness By Market Segments

    12.2. Pricing Analysis

    12.3. Historical Market Size (US$ Mn) and Volume By Market Segments, 2013–2017

    12.4. Market Size (US$ Mn) and Volume Forecast By Market Segments, 2018-2026

        12.4.1. By Country

            12.4.1.1. North Africa

            12.4.1.2. South Africa

            12.4.1.3. GCC

            12.4.1.4. Turkey

            12.4.1.5. Rest of MEA

        12.4.2. By Product Type

        12.4.3. By Application

    12.5. MEA Specialty Cosmetic Ingredients Market Absolute $ Opportunity By Country, 2018 – 2026

13. China Cosmetic Ingredients Market Analysis 2013–2017 and Forecast 2018–2026, By Application

    13.1. Introduction

        13.1.1. Market Value Share Analysis By Market Segments

        13.1.2. Y-o-Y Growth Analysis By Market Segments

        13.1.3. Market Attractiveness By Market Segments

    13.2. Pricing Analysis

    13.3. Historical Market Size (US$ Mn) and Volume By Market Segments, 2013–2017

    13.4. Market Size (US$ Mn) and Volume Forecast By Market Segments, 2018-2026

        13.4.1. By Product Type

        13.4.2. By Application

    13.5. China Specialty Cosmetic Ingredients Market Absolute $ Opportunity By Country, 2018 – 2026

14. Japan Cosmetic Ingredients Market Analysis 2013–2017 and Forecast 2018–2026, By Application

    14.1. Introduction

        14.1.1. Market Value Share Analysis By Market Segments

        14.1.2. Y-o-Y Growth Analysis By Market Segments

        14.1.3. Market Attractiveness By Market Segments

    14.2. Pricing Analysis

    14.3. Historical Market Size (US$ Mn) and Volume By Market Segments, 2013–2017

    14.4. Market Size (US$ Mn) and Volume Forecast By Market Segments, 2018-2026

        14.4.1. By Product Type

        14.4.2. By Application

    14.5. North America Specialty Cosmetic Ingredients Market Absolute $ Opportunity By Country, 2018 – 2026

15. Competition Analysis

    15.1. Competition Dashboard

    15.2. Tier Structure Analysis

    15.3. Company Profiles

        15.3.1. BASF SE

            15.3.1.1. Overview

            15.3.1.2. Product Portfolio

            15.3.1.3. Profitability by Segments/ Applications/ Technology

            15.3.1.4. Production Footprint

            15.3.1.5. Sales Footprint

            15.3.1.6. Channel Footprint

            15.3.1.7. Competition Benchmarking

            15.3.1.8. Strategy

        15.3.2. Croda International Plc.

            15.3.2.1. Overview

            15.3.2.2. Product Portfolio

            15.3.2.3. Profitability by Segments/ Applications/ Technology

            15.3.2.4. Production Footprint

            15.3.2.5. Sales Footprint

            15.3.2.6. Channel Footprint

            15.3.2.7. Competition Benchmarking

            15.3.2.8. Strategy

        15.3.3. Evonik Industries AG

            15.3.3.1. Overview

            15.3.3.2. Product Portfolio

            15.3.3.3. Profitability by Segments/ Applications/ Technology

            15.3.3.4. Production Footprint

            15.3.3.5. Sales Footprint

            15.3.3.6. Channel Footprint

            15.3.3.7. Competition Benchmarking

            15.3.3.8. Strategy

        15.3.4. Akzo Nobel N.V.

            15.3.4.1. Overview

            15.3.4.2. Product Portfolio

            15.3.4.3. Profitability by Segments/ Applications/ Technology

            15.3.4.4. Production Footprint

            15.3.4.5. Sales Footprint

            15.3.4.6. Channel Footprint

            15.3.4.7. Competition Benchmarking

            15.3.4.8. Strategy

        15.3.5. Solvay SA

            15.3.5.1. Overview

            15.3.5.2. Product Portfolio

            15.3.5.3. Profitability by Segments/ Applications/ Technology

            15.3.5.4. Production Footprint

            15.3.5.5. Sales Footprint

            15.3.5.6. Channel Footprint

            15.3.5.7. Competition Benchmarking

            15.3.5.8. Strategy

        15.3.6. The Dow Chemical Company

            15.3.6.1. Overview

            15.3.6.2. Product Portfolio

            15.3.6.3. Profitability by Segments/ Applications/ Technology

            15.3.6.4. Production Footprint

            15.3.6.5. Sales Footprint

            15.3.6.6. Channel Footprint

            15.3.6.7. Competition Benchmarking

            15.3.6.8. Strategy

        15.3.7. Lonza Group

            15.3.7.1. Overview

            15.3.7.2. Product Portfolio

            15.3.7.3. Profitability by Segments/ Applications/ Technology

            15.3.7.4. Production Footprint

            15.3.7.5. Sales Footprint

            15.3.7.6. Channel Footprint

            15.3.7.7. Competition Benchmarking

            15.3.7.8. Strategy

        15.3.8. Eastman Chemical Company

            15.3.8.1. Overview

            15.3.8.2. Product Portfolio

            15.3.8.3. Profitability by Segments/ Applications/ Technology

            15.3.8.4. Production Footprint

            15.3.8.5. Sales Footprint

            15.3.8.6. Channel Footprint

            15.3.8.7. Competition Benchmarking

            15.3.8.8. Strategy

        15.3.9. Clariant AG

            15.3.9.1. Overview

            15.3.9.2. Product Portfolio

            15.3.9.3. Profitability by Segments/ Applications/ Technology

            15.3.9.4. Production Footprint

            15.3.9.5. Sales Footprint

            15.3.9.6. Channel Footprint

            15.3.9.7. Competition Benchmarking

            15.3.9.8. Strategy

        15.3.10. Ashland Global Specialty Chemicals Inc.

            15.3.10.1. Overview

            15.3.10.2. Product Portfolio

            15.3.10.3. Profitability by Segments/ Applications/ Technology

            15.3.10.4. Production Footprint

            15.3.10.5. Sales Footprint

            15.3.10.6. Channel Footprint

            15.3.10.7. Competition Benchmarking

            15.3.10.8. Strategy

        15.3.11. Innospec Inc.

            15.3.11.1. Overview

            15.3.11.2. Product Portfolio

            15.3.11.3. Profitability by Segments/ Applications/ Technology

            15.3.11.4. Production Footprint

            15.3.11.5. Sales Footprint

            15.3.11.6. Channel Footprint

            15.3.11.7. Competition Benchmarking

            15.3.11.8. Strategy

        15.3.12. Novacap Group

            15.3.12.1. Overview

            15.3.12.2. Product Portfolio

            15.3.12.3. Profitability by Segments/ Applications/ Technology

            15.3.12.4. Production Footprint

            15.3.12.5. Sales Footprint

            15.3.12.6. Channel Footprint

            15.3.12.7. Competition Benchmarking

            15.3.12.8. Strategy

        15.3.13. Actives International

            15.3.13.1. Overview

            15.3.13.2. Product Portfolio

            15.3.13.3. Profitability by Segments/ Applications/ Technology

            15.3.13.4. Production Footprint

            15.3.13.5. Sales Footprint

            15.3.13.6. Channel Footprint

            15.3.13.7. Competition Benchmarking

            15.3.13.8. Strategy

        15.3.14. Variati S.p.A.

            15.3.14.1. Overview

            15.3.14.2. Product Portfolio

            15.3.14.3. Profitability by Segments/ Applications/ Technology

            15.3.14.4. Production Footprint

            15.3.14.5. Sales Footprint

            15.3.14.6. Channel Footprint

            15.3.14.7. Competition Benchmarking

            15.3.14.8. Strategy

        15.3.15. INOLEX Inc.

            15.3.15.1. Overview

            15.3.15.2. Product Portfolio

            15.3.15.3. Profitability by Segments/ Applications/ Technology

            15.3.15.4. Production Footprint

            15.3.15.5. Sales Footprint

            15.3.15.6. Channel Footprint

            15.3.15.7. Competition Benchmarking

            15.3.15.8. Strategy

        15.3.16. Archer Daniels Midland Company

            15.3.16.1. Overview

            15.3.16.2. Product Portfolio

            15.3.16.3. Profitability by Segments/ Applications/ Technology

            15.3.16.4. Production Footprint

            15.3.16.5. Sales Footprint

            15.3.16.6. Channel Footprint

            15.3.16.7. Competition Benchmarking

            15.3.16.8. Strategy

16. Assumptions and Acronyms Used

17. Research Methodology

Sample Report

FREE Report Sample is Available

In-depth report coverage is now just a few seconds away

Download PDF Get FREE Report Sample

- List Of Table -

Table 01: Global Specialty Cosmetic Ingredients Market Volume (Tons) and Size (US$ Mn) Forecast by Type, 2013 – 2026

Table 02: Global Cosmetic Ingredients Market Size (US$ Mn) and Volume (Tons) Forecast by Product Type- Surfactants, 2013 – 2026

Table 03: Global Specialty Cosmetic Ingredients Market Volume (Tons) and Size (US$ Mn) Forecast by Application, 2013 – 2026

Table 04: Global Specialty Cosmetic Ingredients Market Size Volume (Tons) and Size (US$ Mn) Forecast by Region, 2013 – 2026

Table 05: North America Specialty Cosmetic Ingredients Market Size (US$ Mn) and Volume (Tons) Forecast by Country, 2013 – 2026

Table 06: North America Specialty Cosmetic Ingredients Market Volume (Tons) and Size (US$ Mn) Forecast by Type, 2013 – 2026

Table 07: North America Cosmetic Ingredients Market Size (US$ Mn) and Volume (Tons) Forecast by Product Type- Surfactants, 2013 – 2026

Table 08: North America Specialty Cosmetic Ingredients Market Volume (Tons) and Size (US$ Mn) Forecast by Application, 2013 – 2026

Table 09: Latin America Specialty Cosmetic Ingredients Market Size (US$ Mn) and Volume (Tons) Forecast by Country, 2013 – 2026

Table 10: Latin America Specialty Cosmetic Ingredients Market Volume (Tons) and Size (US$ Mn) Forecast by Type, 2013 – 2026

Table 11: Latin America Cosmetic Ingredients Market Size (US$ Mn) and Volume (Tons) Forecast by Product Type- Surfactants, 2013 – 2026

Table 12: Latin America Specialty Cosmetic Ingredients Market Volume (Tons) and Size (US$ Mn) Forecast by Application, 2013 – 2026

Table 13: Europe Specialty Cosmetic Ingredients Market Volume (Tons) Forecast by Country, 2013 – 2026

Table 14: Europe Specialty Cosmetic Ingredients Market Volume (Tons) and Size (US$ Mn) Forecast by Type, 2013 – 2026

Table 15: Europe Cosmetic Ingredients Market Size (US$ Mn) and Volume (Tons) Forecast by Product Type- Surfactants, 2013 – 2026

Table 16: Europe Specialty Cosmetic Ingredients Market Volume (Tons) and Size (US$ Mn) Forecast by Application, 2013 – 2026

Table 17: SEAP Specialty Cosmetic Ingredients Market Volume (Tons) and Market Size (US$ Mn) Forecast by Country, 2013 – 2026

Table 18: SEAP Specialty Cosmetic Ingredients Market Volume (Tons) and Size (US$ Mn) Forecast by Type, 2013 – 2026

Table 19: SEAP Cosmetic Ingredients Market Size (US$ Mn) and Volume (Tons) Forecast by Product Type- Surfactants, 2013 – 2026

Table 20: SEAP Specialty Cosmetic Ingredients Market Volume (Tons) and Size (US$ Mn) Forecast by Application, 2013 – 2026

Table 21: MEA Specialty Cosmetic Ingredients Market Volume (Tons) and Market Size (US$ Mn) Forecast by Country, 2013 – 2026

Table 22: MEA Specialty Cosmetic Ingredients Market Volume (Tons) and Size (US$ Mn) Forecast by Type, 2013 – 2026

Table 23: MEA Cosmetic Ingredients Market Size (US$ Mn) and Volume (Tons) Forecast by Product Type- Surfactants, 2013 – 2026

Table 24: MEA Specialty Cosmetic Ingredients Market Volume (Tons) and Size (US$ Mn) Forecast by Application, 2013 – 2026

Table 25: China Specialty Cosmetic Ingredients Market Volume (Tons) and Size (US$ Mn) Forecast by Type, 2013 – 2026

Table 26: China Cosmetic Ingredients Market Size (US$ Mn) and Volume (Tons) Forecast by Product Type- Surfactants, 2013 – 2026

Table 27: China Specialty Cosmetic Ingredients Market Volume (Tons) and Size (US$ Mn) Forecast by Application, 2013 – 2026

Table 28: Japan Specialty Cosmetic Ingredients Market Volume (Tons) and Size (US$ Mn) Forecast by Type, 2013 – 2026

Table 29: Japan Cosmetic Ingredients Market Size (US$ Mn) and Volume (Tons) Forecast by Product Type- Surfactants, 2013 – 2026

Table 30: Japan Specialty Cosmetic Ingredients Market Volume (Tons) and Size (US$ Mn) Forecast by Application, 2013 – 2026

Custom Report Cover

Make This Report Your Own

Take Advantage of Intelligence Tailored to your Business Objective

> Get a Customized Version

- List Of Chart -

Figure 01: Global Specialty Cosmetic Ingredients Historical Market Volume (Tons) Analysis, 2013-2017

Figure 02: Global Specialty Cosmetic Ingredients Projected Market Volume (Tons) Analysis, 2018-2026

Figure 03: Global Specialty Cosmetic Ingredients Market Historical Value (US$ Mn), 2013 – 2017

Figure 04: Global Specialty Cosmetic Ingredients Y-O-Y & Market Value (US$ Mn) Forecast, 2018 – 2026

Figure 05: Global Specialty Cosmetic Ingredients Market Absolute $ Opportunity, 2018 – 2026

Figure 06: Global Specialty Cosmetic Ingredients Market Share and BPS Analysis by Type – 2013, 2018 & 2026

Figure 07: Global Specialty Cosmetic Ingredients Market Y-o-Y (%) Growth Projections by Type, 2018 – 2026

Figure 8: Global Specialty Cosmetic Ingredients Market Attractiveness Analysis by Type, 2018 – 2026

Figure 09: Global Specialty Cosmetic Ingredients Market Absolute $ Opportunity of Emollient Type, 2018 – 2026

Figure 10: Global Specialty Cosmetic Ingredients Market Absolute $ Opportunity of Surfactant Type, 2018 – 2026

Figure 11: Global Specialty Cosmetic Ingredients Market Absolute $ Opportunity of Conditioning Polymer Type, 2018 – 2026

Figure 12: Global Specialty Cosmetic Ingredients Market Absolute $ Opportunity of Rheology Control Agent Type, 2018 – 2026

Figure 13: Global Specialty Cosmetic Ingredients Market Absolute $ Opportunity of UV Absorber Type, 2018 – 2026

Figure 14: Global Specialty Cosmetic Ingredients Market Absolute $ Opportunity of Emulsifier Type, 2018 – 2026

Figure 15: Global Specialty Cosmetic Ingredients Market Absolute $ Opportunity of Antimicrobial Type, 2018 – 2026

Figure 16: Global Specialty Cosmetic Ingredients Market Absolute $ Opportunity of Others Type, 2018 – 2026

Figure 17: Global Specialty Cosmetic Ingredients Market Share and BPS Analysis by Application – 2013, 2018 & 2026

Figure 18: Global Specialty Cosmetic Ingredients Market Y-o-Y (%) Growth Projections by Application, 2018 – 2026

Figure 20: Global Specialty Cosmetic Ingredients Market Absolute $ Opportunity by Skin Care Application, 2018 – 2026

Figure 21: Global Specialty Cosmetic Ingredients Market Absolute $ Opportunity by Hair Care Application, 2018 – 2026

Figure 22: Global Specialty Cosmetic Ingredients Market Absolute $ Opportunity by Oral Care Application, 2018 – 2026

Figure 23: Global Specialty Cosmetic Ingredients Market Absolute $ Opportunity by Makeup Application, 2018 – 2026

Figure 24: Global Specialty Cosmetic Ingredients Market Absolute $ Opportunity of Fragrance Application, 2018 – 2026

Figure 25: Global Specialty Cosmetic Ingredients Market Absolute $ Opportunity of Others Application, 2018 – 2026

Figure 26: Global Specialty Cosmetic Ingredients Market Share and BPS Analysis by Region – 2013, 2018 & 2026

Figure 27: Global Specialty Cosmetic Ingredients Market Y-o-Y (%) Growth Projections by Region, 2018 – 2026

Figure 28: Global Specialty Cosmetic Ingredients Market Y-o-Y (%) Growth Projections by Region, 2018 – 2026

Figure 29: North America Specialty Cosmetic Ingredients Market Absolute $ Opportunity, 2018 – 2026

Figure 30: Latin America Specialty Cosmetic Ingredients Market Absolute $ Opportunity, 2018 – 2026

Figure 31: Europe Specialty Cosmetic Ingredients Market Absolute $ Opportunity, 2018 – 2026

Figure 32: China Specialty Cosmetic Ingredients Market Absolute $ Opportunity, 2018 – 2026

Figure 33: MEA Specialty Cosmetic Ingredients Market Absolute $ Opportunity, 2018 – 2026

Figure 34: China Specialty Cosmetic Ingredients Market Absolute $ Opportunity, 2018 – 2026

Figure 35: Japan Specialty Cosmetic Ingredients Market Absolute $ Opportunity, 2018 – 2026

Figure 36: North America Specialty Cosmetic Ingredients Market Share and BPS Analysis by Country – 2013, 2018 & 2026

Figure 37: North America Specialty Cosmetic Ingredients Market Y-o-Y (%) Growth Projections by Country, 2018 – 2026

Figure 38: North America Specialty Cosmetic Ingredients Market Attractiveness Analysis by Country, 2018 – 2026

Figure 39: US Specialty Cosmetic Ingredients Market Absolute $ Opportunity, 2018 – 2026

Figure 40: Canada Specialty Cosmetic Ingredients Market Absolute $ Opportunity, 2018 – 2026

Figure 41: North America Specialty Cosmetic Ingredients Market Share and BPS Analysis by Type – 2013, 2018 & 2026

Figure 42: North America Specialty Cosmetic Ingredients Market Y-o-Y (%) Growth Projections by Type, 2018 – 2026

Figure 43: North America Specialty Cosmetic Ingredients Market Attractiveness Analysis by Type, 2018 – 2026

Figure 44: North America Specialty Cosmetic Ingredients Market Share and BPS Analysis by Application – 2013, 2018 & 2026

Figure 45: North America Specialty Cosmetic Ingredients Market Y-o-Y (%) Growth Projections by Application, 2018 – 2026

Figure 46: North America Specialty Cosmetic Ingredients Market Attractiveness Analysis by Application, 2018 – 2026

Figure 47: Latin America Specialty Cosmetic Ingredients Market Share and BPS Analysis by Country – 2013, 2018 & 2026

Figure 48: Latin America Specialty Cosmetic Ingredients Market Y-o-Y (%) Growth Projections by Country, 2018 – 2026

Figure 49: Latin America Specialty Cosmetic Ingredients Market Attractiveness Analysis by Country, 2018 – 2026

Figure 50: Brazil Specialty Cosmetic Ingredients Market Absolute $ Opportunity, 2018 – 2026

Figure 51: Mexico Specialty Cosmetic Ingredients Market Absolute $ Opportunity, 2018 – 2026

Figure 52: Argentina Specialty Cosmetic Ingredients Market Absolute $ Opportunity, 2018 – 2026

Figure 53: Rest of LA Specialty Cosmetic Ingredients Market Absolute $ Opportunity, 2018 – 2026

Figure 54: Latin America Specialty Cosmetic Ingredients Market Share and BPS Analysis by Type – 2013, 2018 & 2026

Figure 55: Latin America Specialty Cosmetic Ingredients Market Y-o-Y (%) Growth Projections by Type, 2018 – 2026

Figure 56: Latin America Specialty Cosmetic Ingredients Market Attractiveness Analysis by Type, 2018 – 2026

Figure 57: Latin America Specialty Cosmetic Ingredients Market Share and BPS Analysis by Application – 2013, 2018 & 2026

Figure 58: Latin America Specialty Cosmetic Ingredients Market Y-o-Y (%) Growth Projections by Application, 2018 – 2026

Figure 59: Latin America Specialty Cosmetic Ingredients Market Attractiveness Analysis by Application, 2018 – 2026

Figure 60: Europe Specialty Cosmetic Ingredients Market Share and BPS Analysis by Country – 2013, 2018 & 2026

Figure 61: Europe Specialty Cosmetic Ingredients Market Y-o-Y (%) Growth Projections by Country, 2018 – 2026

Figure 62: Europe Specialty Cosmetic Ingredients Market Attractiveness Analysis by Country, 2018 – 2026

Figure 63: Germany Specialty Cosmetic Ingredients Market Absolute $ Opportunity, 2018 – 2026

Figure 64: Norway Specialty Cosmetic Ingredients Market Absolute $ Opportunity, 2018 – 2026

Figure 65: Italy Specialty Cosmetic Ingredients Market Absolute $ Opportunity, 2018 – 2026

Figure 66: Spain Specialty Cosmetic Ingredients Market Absolute $ Opportunity, 2018 – 2026

Figure 67: France Specialty Cosmetic Ingredients Market Absolute $ Opportunity, 2018 – 2026

Figure 68: Benelux Specialty Cosmetic Ingredients Market Absolute $ Opportunity, 2018 – 2026

Figure 69: Russia Specialty Cosmetic Ingredients Market Absolute $ Opportunity, 2018 – 2026

Figure 70: Rest of Europe Specialty Cosmetic Ingredients Market Absolute $ Opportunity, 2018 – 2026

Figure 71: Europe Specialty Cosmetic Ingredients Market Share and BPS Analysis by Type – 2013, 2018 & 2026

Figure 72: Europe Specialty Cosmetic Ingredients Market Y-o-Y (%) Growth Projections by Type, 2018 – 2026

Figure 73: Europe Specialty Cosmetic Ingredients Market Attractiveness Analysis by Type, 2018 – 2026

Figure 74: Europe Specialty Cosmetic Ingredients Market Share and BPS Analysis by Application– 2013, 2018 & 2026

Figure 75: Europe Specialty Cosmetic Ingredients Market Y-o-Y (%) Growth Projections by Application, 2018 – 2026

Figure 76: Europe Specialty Cosmetic Ingredients Market Attractiveness Analysis by Application, 2018 – 2026

Figure 77: SEAP Specialty Cosmetic Ingredients Market Share and BPS Analysis by Country – 2013, 2018 & 2026

Figure 78: SEAP Specialty Cosmetic Ingredients Market Y-o-Y (%) Growth Projections by Country, 2018 – 2026

Figure 79: SEAP Specialty Cosmetic Ingredients Market Attractiveness Analysis by Country, 2018 – 2026

Figure 80: India Specialty Cosmetic Ingredients Market Absolute $ Opportunity, 2018 – 2026

Figure 81: ASEAN Specialty Cosmetic Ingredients Market Absolute $ Opportunity, 2018 – 2026

Figure 82: ANZ Specialty Cosmetic Ingredients Market Absolute $ Opportunity, 2018 – 2026

Figure 83: Rest of SEAP Specialty Cosmetic Ingredients Market Absolute $ Opportunity, 2018 – 2026

Figure 84: SEAP Specialty Cosmetic Ingredients Market Share and BPS Analysis by Type – 2013, 2018 & 2026

Figure 85: SEAP Specialty Cosmetic Ingredients Market Y-o-Y (%) Growth Projections by Type, 2018 – 2026

Figure 86: SEAP Specialty Cosmetic Ingredients Market Attractiveness Analysis by Type, 2018 – 2026

Figure 87: SEAP Specialty Cosmetic Ingredients Market Share and BPS Analysis by Application – 2013, 2018 & 2026

Figure 88: SEAP Specialty Cosmetic Ingredients Market Y-o-Y (%) Growth Projections by Application, 2018 – 2026

Figure 89: SEAP Specialty Cosmetic Ingredients Market Attractiveness Analysis by Type, 2018 – 2026

Figure 90: MEA Specialty Cosmetic Ingredients Market Share and BPS Analysis by Country – 2013, 2018 & 2026

Figure 91: MEA Specialty Cosmetic Ingredients Market Y-o-Y (%) Growth Projections by Country, 2018 – 2026

Figure 92: MEA Specialty Cosmetic Ingredients Market Attractiveness Analysis by Country, 2018 – 2026

Figure 93: North Africa Specialty Cosmetic Ingredients Market Absolute $ Opportunity, 2018 – 2026

Figure 94: South Africa Specialty Cosmetic Ingredients Market Absolute $ Opportunity, 2018 – 2026

Figure 95: GCC Specialty Cosmetic Ingredients Market Absolute $ Opportunity, 2018 – 2026

Figure 96: Rest of MEA Specialty Cosmetic Ingredients Market Absolute $ Opportunity, 2018 – 2026

Figure 97: MEA Specialty Cosmetic Ingredients Market Share and BPS Analysis by Type – 2013, 2018 & 2026

Figure 98: MEA Specialty Cosmetic Ingredients Market Y-o-Y (%) Growth Projections by Type, 2018 – 2026

Figure 99: MEA Specialty Cosmetic Ingredients Market Attractiveness Analysis by Type, 2018 – 2026

Figure 100: MEA Specialty Cosmetic Ingredients Market Share and BPS Analysis by Application – 2013, 2018 & 2026

Figure 101: MEA Specialty Cosmetic Ingredients Market Y-o-Y (%) Growth Projections by Application, 2018 – 2026

Figure 102: MEA Specialty Cosmetic Ingredients Market Attractiveness Analysis by Type, 2018 – 2026

Figure 103: China Specialty Cosmetic Ingredients Market Share and BPS Analysis by Type – 2013, 2018 & 2026

Figure 104: China Specialty Cosmetic Ingredients Market Y-o-Y (%) Growth Projections by Type, 2018 – 2026

Figure 105: China Specialty Cosmetic Ingredients Market Attractiveness Analysis by Type, 2018 – 2026

Figure 106: China Specialty Cosmetic Ingredients Market Share and BPS Analysis by Application – 2013, 2018 & 2026

Figure 107: China Specialty Cosmetic Ingredients Market Y-o-Y (%) Growth Projections by Application, 2018 – 2026

Figure 108: China Specialty Cosmetic Ingredients Market Attractiveness Analysis by Type, 2018 – 2026

Figure 109: Japan Specialty Cosmetic Ingredients Market Share and BPS Analysis by Type – 2013, 2018 & 2026

Figure 110: Japan Specialty Cosmetic Ingredients Market Y-o-Y (%) Growth Projections by Type, 2018 – 2026

Figure 111: Japan Specialty Cosmetic Ingredients Market Attractiveness Analysis by Type, 2018 – 2026

Figure 112: Japan Specialty Cosmetic Ingredients Market Share and BPS Analysis by Application – 2013, 2018 & 2026

Figure 113: Japan Specialty Cosmetic Ingredients Market Y-o-Y (%) Growth Projections by Application, 2018 – 2026

Figure 114: Japan Specialty Cosmetic Ingredients Market Attractiveness Analysis by Application, 2018 – 2026

This site uses cookies, including third-party cookies, that help us to provide and improve our services. Privacy Policy
Google translate