


- LED & Lighting (Optoelectronics)
- Power Cable Market
Power Cable Market Size, Trends, Share, and Growth Forecast, 2025 - 2032
Power Cable Market by Installation (Overhead, Underground and Submarine), by Cable Type (Polyvinyl Chloride (PVC), Polyurethane (PUR), Rubber, XLPE, Thermoset CPE and Others), Application (Utility, Residential, Commercial Buildings & Data Centre, Manufacturing, Railways, Automotive, Material Handling and Others), Voltage, and Regional Analysis for 2025 - 2032
Power Cable Market Size and Trends Analysis
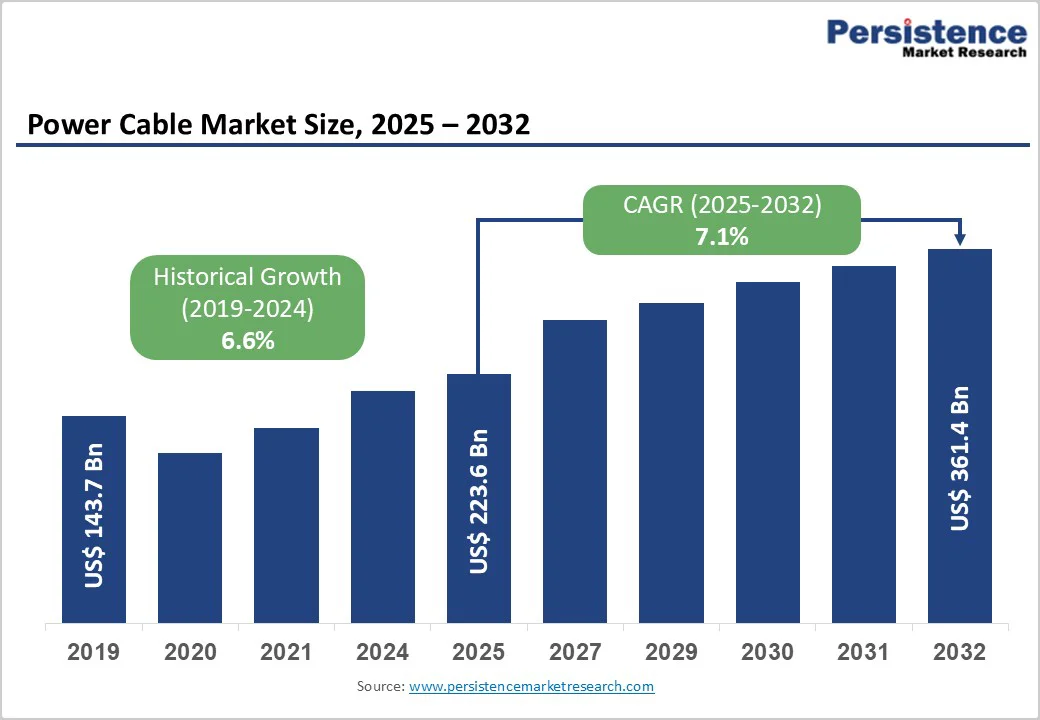
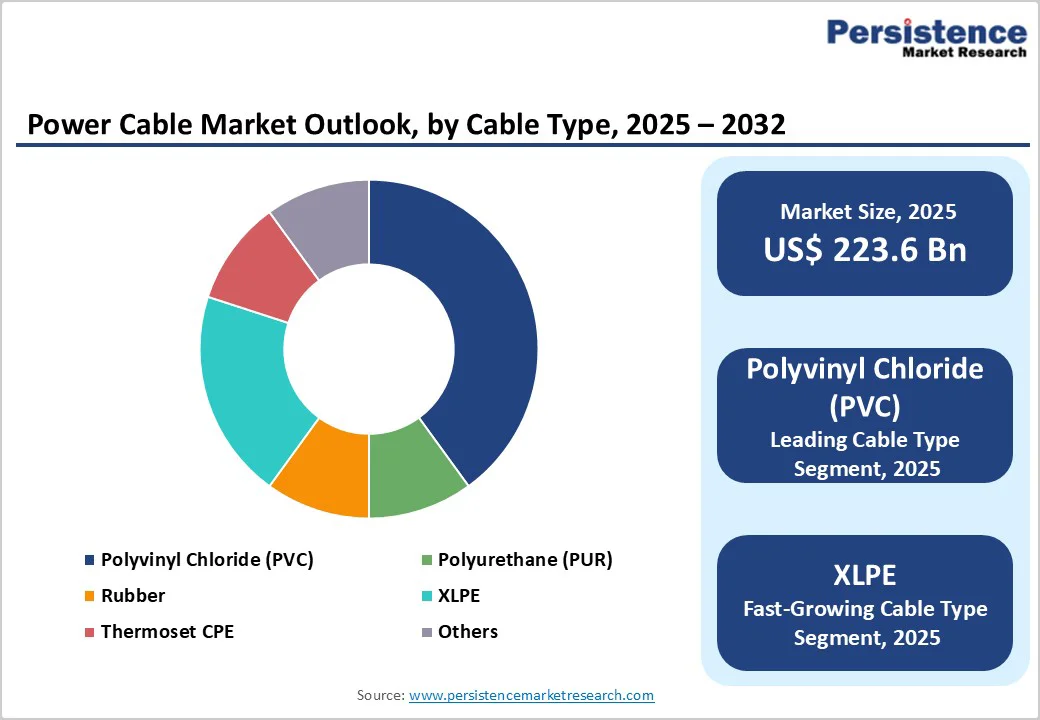
The global power cable market size was valued at US$ 223.6 billion in 2025 and is projected to reach US$ 361.4 billion by 2032, growing at a CAGR of 7.1% between 2025 and 2032.
This sustained expansion reflects renewable energy capacity tripling from 3,870 GW in 2023 to 11,000 GW by 2030, requiring 1,000+ GW annual additions necessitating massive transmission infrastructure investment, underground distribution deployment eliminating over 3,000 GW renewable capacity grid connection bottlenecks, and submarine cable proliferation supporting offshore wind expansion with 31.8% renewable energy share within the submarine segment.
Key Industry?Highlights:
- Topology Segment Leadership: Centralized battery management systems (BMS) dominate with 36.4% market share, driven by cost-effective implementation and suitability for compact battery pack architectures. Distributed BMS is the fastest-growing topology at 14% CAGR, enabled by high scalability for 100+ kWh EV battery packs and decentralized monitoring architectures supporting 200+ individual cells.
- Battery Chemistry Dynamics: Lead-acid BMS leads with 49% market share, supported by extensive deployment across 12V start-stop systems in passenger vehicles. Lithium-ion BMS is the fastest-growing segment at 18-22% CAGR, driven by widespread BEV/PHEV adoption requiring precision monitoring for 400-800V platforms and 60-100 kWh high-energy battery packs.
- Vehicle Category Trends: Passenger cars dominate with 64.3% share, reflecting the largest global BEV/PHEV production volumes and rapid OEM integration of advanced BMS technologies. Light commercial vehicles (LCVs) are the fastest-growing category at 12% CAGR, supported by the electrification of urban delivery fleets and increased demand for connected fleet battery management solutions.
- Regional Growth Patterns: Asia Pacific dominates with 38% global market share, expanding at 18.5% CAGR, led by China contributing 48% of regional EV output with over 9 million EV units produced annually. North America holds 28% share with 14.2% CAGR, while Europe accounts for 25% share, growing at 15.8% CAGR, driven by battery passport mandates and strong EV manufacturing ecosystems.
- Strategic Market Developments: LG Energy Solution leads with 14% market share, supported by AI-powered BMS platforms optimizing pack efficiency and safety. Samsung SDI, CATL, and Panasonic maintain strong competitive positions. AI-driven predictive analytics enabling 15% battery life extension and expanding second-life battery applications represent a US$1.5 billion opportunities by 2032, driven by circular-economy battery reuse infrastructure.
| Key Insights | Details |
|---|---|
| Power Cable Market Size (2025E) | US$ 223.6 Bn |
| Market Value Forecast (2032F) | US$ 361.4 Bn |
| Projected Growth (CAGR 2025 to 2032) | 7.1% |
| Historical Market Growth (CAGR 2019 to 2024) | 6.6% |
Market Dynamics
Growth Drivers
Renewable Energy Expansion and Grid Infrastructure Modernization
Global renewable energy capacity projection reaching 11,000 GW by 2030 from 3,870 GW in 2023 represents 1,000+ GW annual additions requiring proportional transmission and distribution cable infrastructure development, with submarine cable market alone expanding 8.7% CAGR driven by offshore wind deployment.
Offshore wind farm proliferation including Dogger Bank (UK), Hornsea Project (Denmark), and Vineyard Wind (USA) requiring high-voltage transmission cables connecting installations to mainland grids demonstrates substantial capital deployment.
Current 3,000 GW renewable capacity awaiting grid connection reveals critical transmission bottleneck, with underground distribution expansion addressing distribution network limitations and enabling rapid distributed renewable project absorption addressing structural grid constraints.
HVDC (High-Voltage Direct Current) cable technology enabling efficient electricity transmission over 500+ km distances achieves 3-5% energy loss reduction versus conventional HVAC systems justifying technology adoption for long-distance renewable transmission.
Submarine Cable Demand for Cross-Border Electricity Trade and Offshore Energy
Submarine power cable market valued at $18.56 billion in 2025 growing 8.5% CAGR through 2034 reflects expanding inter-country transmission networks enabling cross-border electricity trade, interconnected grid reliability enhancement, and offshore renewable integration.
European dominance with 36% submarine cable market share reflects intensive offshore wind deployment and regional electricity trading networks connecting UK, Germany, Denmark, Belgium, and Netherlands submarine infrastructure enabling 20-30% renewable energy penetration.
International submarine interconnections including NordLink (Norway-Germany), ItalyGriceConnector (Italy-Greece), and Synchronous Machine (Morocco-Spain) demonstrate policy support for integrated European electricity markets through submarine cable investment.
Intercontinental connections enabling electricity trade between Australia-Indonesia, Japan-Korea, and trans-Pacific linkages support renewable energy export opportunities justifying infrastructure investment. Renewable energy comprises 31.8% of the submarine cable market in 2025 with remaining segments including interconnections (35%), telecommunications (20%), and oil/gas (13%) demonstrating diversified submarine cable applications.
Market Restraints
High Capital Investment and Installation Complexity
Underground cable installation commanding $500,000-$2 million per kilometer versus $80,000-150,000 overhead installation creates substantial financial barriers constraining deployment despite technical advantages including reduced visual impact, improved reliability, and electromagnetic field elimination.
Submarine cable installation exceeding $1-3 million per kilometer reflecting specialized vessel requirements, seabed survey complexity, and marine installation expertise creates capital intensity limiting deployment to major projects with substantial revenue justification.
Installation labor representing 50-70% of total project cost creates sensitivity to construction wage inflation and availability constraints, with regional labor shortages delaying major projects 6-18 months and increasing costs 20-35%.
Right-of-way acquisition for underground distribution requiring private property easements, municipal permits, and community engagement creates project delays averaging 12-24 months in developed markets, with acquisition costs ranging $5,000-50,000 per kilometer depending on regional factors.
Raw Material Price Volatility and Supply Chain Constraints
Copper and aluminum commodity price volatility affecting conductor cost representing 30-45% of cable manufacturing cost creates margin pressure and pricing uncertainty constraining manufacturer profitability and customer budgeting. Copper price fluctuations of 20-40% annually create hedging requirements and forward contract complexity, with supply constraints from limited mine expansion constraining production growth.
Insulation material supply challenges including PVC resin shortage (2021 - 2023) demonstrating petrochemical dependency and geopolitical vulnerability, with XLPE material availability constraints from limited specialized resin production capacity.
Semiconductor shortage impacts production of cable accessories including terminations, connectors, and monitoring systems reducing system assembly capacity 15-25% despite cable conductor availability, creating project execution delays.
Market Opportunities
Emerging Market Grid Modernization and Electrification
Developing economies including India, Southeast Asia, Brazil, and Sub-Saharan Africa requiring grid expansion connecting 1+ billion unelectrified population create substantial cable demand with emerging market representation growing 14-18% CAGR.
India rural electrification reaching 100+ million households through government programs including Pradhan Mantri Sahaj Bijli Har Ghar Yojana requires distribution cable deployment of 2-3 million kilometers through 2032, creating estimated $15-25 billion opportunity.
Southeast Asia electricity demand growth averaging 4-6% annually driven by manufacturing expansion, data center deployment, and rising living standards supports transmission and distribution cable investment estimated at $8-15 billion through 2032.
Sub-Saharan Africa electrification expansion and renewable energy development including South African wind and solar projects support cable demand growing 13% CAGR with supply chain localization creating manufacturing opportunities. Market opportunity for emerging market power cables estimated at $45-75 billion by 2032 as infrastructure investment accelerates.
Data Center Infrastructure and AI Computing Power Requirements
Data center expansion drives by artificial intelligence, cloud computing, and edge computing infrastructure creating specialized high-reliability power cable requirements with extreme redundancy and fault-tolerance specifications.
Google, Microsoft, Amazon, and Meta combined investment exceeding $150 billion through 2030 in hyperscale data center deployment creates substantial power infrastructure demand including specialized cables rated for continuous 100% load operation with near-zero downtime tolerance.
400-800V DC distribution systems replacing traditional AC infrastructure in data centers require specialized cabling supporting direct current transmission, reducing transmission losses 10-15% versus conventional AC systems while enabling more efficient renewable energy integration.
Cable cooling innovations enabling higher current density 30-50% increase versus conventional designs support data center space optimization, with hybrid liquid-cooled cables commanding 25-40% premiums enabling 40% footprint reduction. Market opportunity for data center power cables estimated at $12-20 billion by 2032 as hyperscale expansion accelerates.
Segmentation Analysis
Installation Type Analysis
Overhead installations command 56.3% market share through lowest installation cost ($80,000-150,000 per kilometer), rapid deployment capability, and easy maintenance access supporting utility distribution networks.
Overhead distribution infrastructure serving 70%+ of developed market electricity distribution creates baseline demand for replacement and capacity expansion, with aging infrastructure exceeding 30-year service life requiring systematic modernization.
Underground deployment represents fastest-growing segment at approximately 9% CAGR, driven by urban congestion minimizing overhead line visual/electromagnetic impact, improved reliability eliminating storm damage, and smart city prioritization. Underground cable deployment in urban areas, reducing customer outage duration 30-50% versus overhead systems during weather events and equipment failures, justifies a 3-4x cost premium.
Application Insights
Utility transmission and distribution account for 28.2% of application share, reflecting their critical role in supporting national and regional power grids. These applications span a wide voltage range from 69 kV high-voltage transmission lines to 240 V residential service connections, making them foundational to reliable electricity delivery.
Continuous grid expansion, urbanization, and modernization initiatives sustain steady demand for durable, high-performance cables across utility networks.
The manufacturing sector is the fastest-growing application, expanding at an estimated 8% CAGR. Growth is driven by Industry 4.0 adoption, including AI-enabled robotics, smart factories, and industrial digitalization.
Advanced manufacturing systems require reliable, high-capacity electrical distribution to support automation, precision equipment, and data-driven operations. This is accelerating investment in specialized high-voltage and industrial-grade cabling infrastructure, strengthening cable demand within modern manufacturing facilities.
Voltage Insights
Low-voltage cables (≤240V) account for 35.4% of the total market share, driven primarily by widespread residential electrification. Single-phase 240V service cables are the standard for household power delivery, supporting lighting, appliances, HVAC systems, and consumer electronics.
With more than 150 million households in North America alone, replacement demand, new housing construction, and home electrification upgrades continue to sustain strong volume consumption. Low-voltage cables benefit from standardized specifications, cost efficiency, and high installation frequency, reinforcing their dominant market position.
The medium-voltage segment (240V-1kV) is the fastest-growing, expanding at a 7.5-9% CAGR. Growth is fueled by commercial buildings, light industrial facilities, electric vehicle charging infrastructure, and decentralized renewable energy integration. Medium-voltage cables enable higher load capacity, improved energy efficiency, and reduced power losses, making them increasingly essential in modern power distribution networks.
Regional Market Insights
North America Power Cable Market Trends
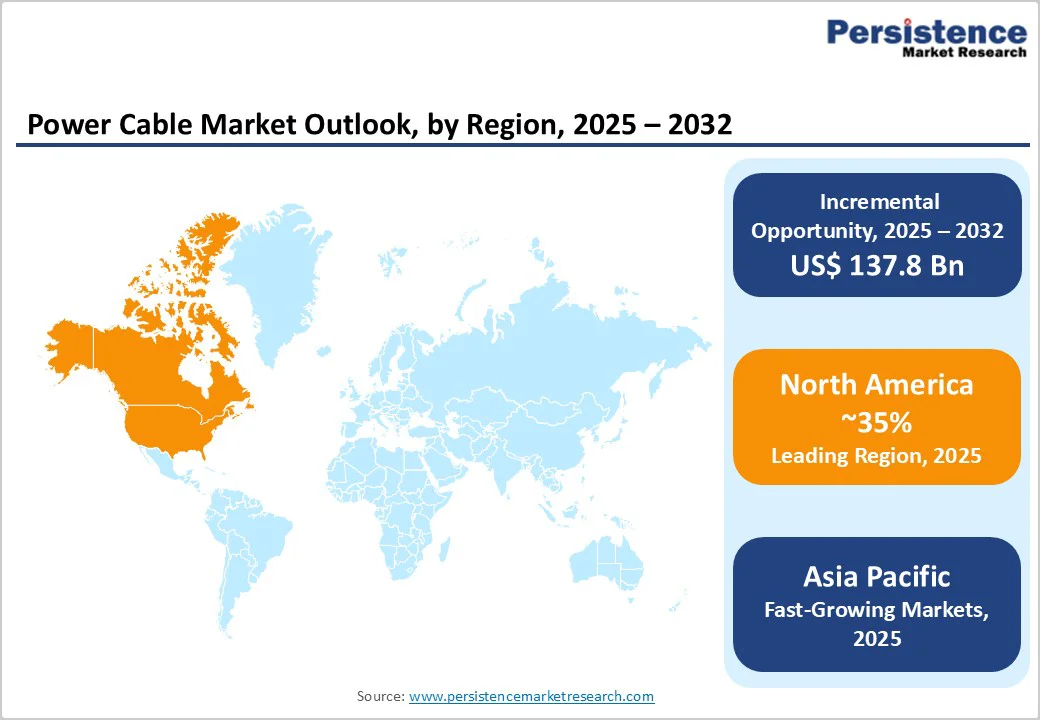
North America has generated approximately US$87.1 billion market value in 2025, representing 35% global share, with a 6.8% CAGR through 2032. It is driven by aging infrastructure requiring modernization, renewable energy integration, and grid reliability enhancement priorities.
The United States dominates the regional market with an 82-85% North American share through a 130-year-old transmission infrastructure averaging 40+ years of age requiring a systematic replacement cycle, with utility capital expenditure exceeding $50 billion annually, supporting cable deployment.
Texas and California renewable integration, requiring 15,000+ miles of underground distribution cable installation to connect solar and wind projects to load centers, supports a substantial market opportunity. Canadian hydroelectric transmission expansion connecting Atlantic and Western hydroelectric capacity to population centers drives submarine cable deployment investments.
Europe Power Cable Market Trends
Europe represents US$58.2 billion market in 2025, capturing 22% global share, growing at a 7.4% CAGR through 2032, characterized by strict environmental regulations, submarine cable infrastructure leadership, and integrated regional electricity trading networks.
Germany leads the European market with 24-28% regional share through aggressive renewable integration targeting 80% electricity from renewables by 2030, requiring substantial distribution and transmission cable investment.
United Kingdom submarine cable deployments, including NordLink supporting Norwegian hydroelectric import, create specialized offshore cable demand. France's nuclear fleet modernization and planned hydrogen economy transition support both conventional and specialized cable applications.
Asia Pacific Power Cable Market Trends
Asia Pacific represents fastest-growing region at approximately 9.2% CAGR through 2032, with an estimated market value reaching US$135 billion by 2032, comprising 30% global market share by 2032, driven by electrification expansion, renewable energy investment, and manufacturing growth.
China dominates Asia Pacific with 40% regional share through 1,000+ GW renewable capacity by 2030 target, requiring massive transmission infrastructure investment with submarine cable deployment for offshore wind farms.
India is emerging as a high-growth market at 11-14% CAGR through rural electrification programs, renewable energy deployment, and manufacturing expansion, supporting distribution cable demand. Southeast Asia is combining 8% regional growth through manufacturing relocation, data center expansion, and EV infrastructure development, supporting cable deployment.
Competitive Landscape
The global power cable market is mostly fragmented, with key players operating in the industry. Globally, Prysmian, a cable systems company headquartered in Italy, is dominating the market. In May 2025, Prysmian boosted its transmission business with the completion of the expansion works at its subsea power cable factory in Finland and the naming ceremony for the newest addition to its cable laying vessel (CLV) fleet.
Key Industry Developments:
- In March 2025, NKT introduced an advanced cable monitoring solution designed to enhance power grid reliability. The platform integrates multiple sensor technologies to deliver a comprehensive, real-time overview of power cable health and operational status.
- In December 2024, The engineering, procurement, construction, installation, and commissioning (EPCI) of submarine power cable connections. Prysmian has a Framework Agreement with the French TSO, Réseau de Transport d'Électricité (RTE). These connections will link two offshore wind farms, each with a potential capacity of 750 MW, to the French transmission network, encompassing both the land and underwater components (including landfall activities).
Companies Covered in Power Cable Market
- Prysmian Group
- Nexans SA
- General Cable Technologies Corporation
- Sumitomo Electric Industries Ltd.
- Fujikura Ltd.
- NKT AS
- Encore Wire corporation
- Elmeridge Cables Limited
- Southwire company LLC
- Furukawa Electric Ltd.
- Others Key Players
Frequently Asked Questions
The Power Cable market is estimated to be valued at US$ 223.6 Bn in 2025.
The primary demand driver for the power cable market is the global expansion and modernization of power transmission and distribution (T&D) infrastructure, driven by rising electricity consumption and the rapid integration of renewable energy sources.
In 2025, the North America region will dominate the market with an exceeding 35% revenue share in the global Power Cable market.
Among the Installation Type, Overhead Based holds the highest preference, capturing beyond 56.3% of the market revenue share in 2025, surpassing other Installation Type.
The key players in Power Cable are Prysmian Group, Nexans SA, Fujikura Ltd. and NKT AS.


