


- Agrochemicals
- Plant Activators Market
Plant Activators Market Size, Share, and Growth Forecast 2026 - 2033
Plant Activators Market by Product Type (Synthetic Plant Activators, Biological Plant Activators), Crop Type (Cereals & Grains, Fruits & Vegetables, Oilseeds & Pulses, Plantation Crops, Ornamentals), Mode of Action (SAR Inducers, ISR Inducers, Broad), Formulation (Liquid, Powder/Granules), Application (Foliar Spray, Soil Treatment, Seed Treatment, Water Drenching), and Regional Analysis, 2026 - 2033
Plant Activators Market Size and Trend Analysis
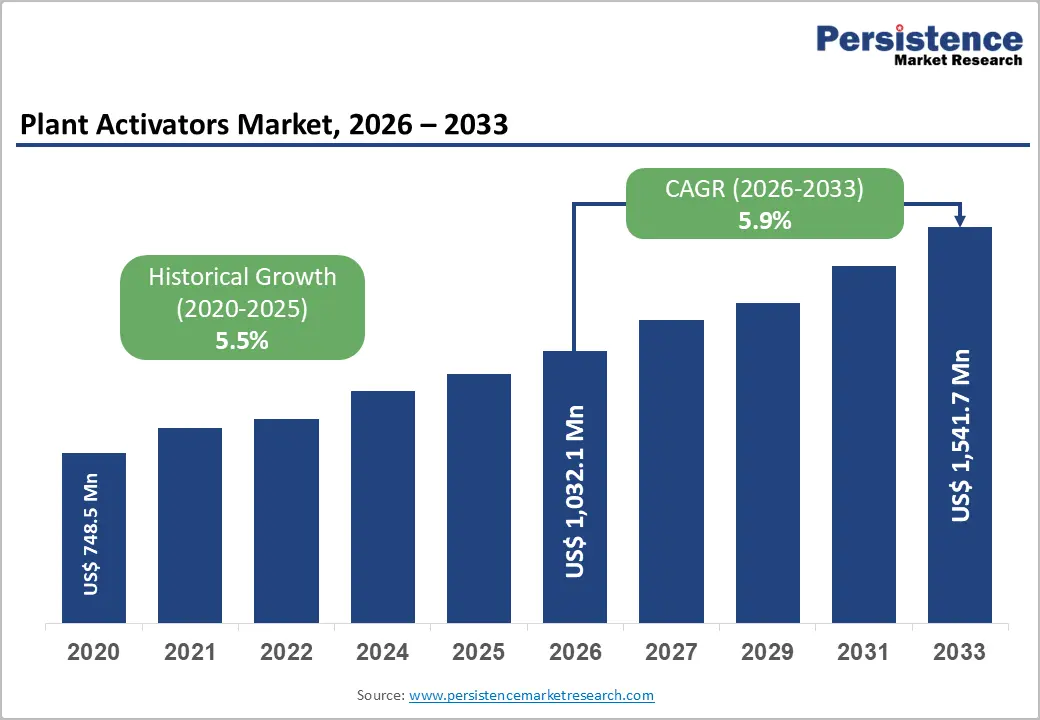
The global plant activators market size is likely to be valued at US$ 1,032.1 million in 2026 and is expected to reach US$ 1,541.7 million by 2033, growing at a CAGR of 5.9% during the forecast period from 2026 to 2033.
The market growth is driven by rising crop losses from biotic and abiotic stresses, including drought, extreme temperatures, and pest outbreaks intensified by climate change. Demand for residue-free produce, regulatory recognition of biostimulants, and integration into precision agriculture are boosting adoption. Plant activators enhance natural plant defenses, improve yield, and reduce reliance on synthetic chemicals, making them vital in modern agriculture.
Key Industry Highlights:
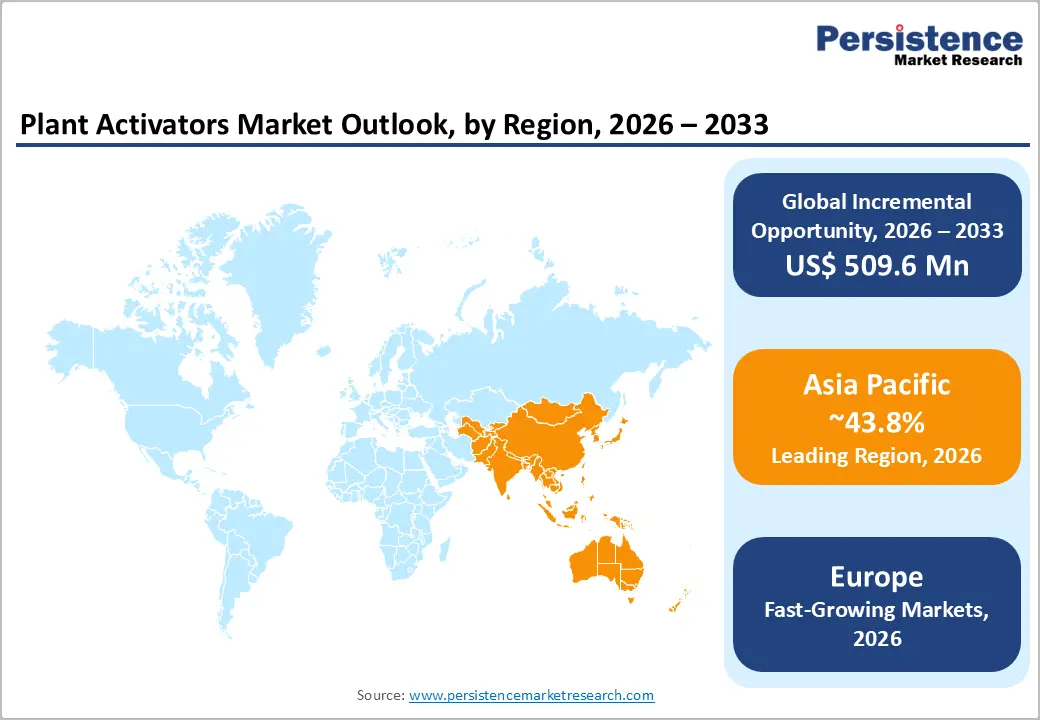
- Leading Region: Asia Pacific is the largest market, commanding 43.8% share, driven by intensive cultivation, rising climate stress, and rapid adoption of biological inputs.
- Fastest-Growing Region: Europe is the fastest-growing market at ~6.3% CAGR, supported by strict residue rules, biostimulant regulation, and expanding organic farming.
- Dominant Crop Segment: Fruits & vegetables lead with 42% of demand due to high value, disease sensitivity, and strict export-quality standards.
- Dominant Product Type: Biological activators hold 56% share, backed by regulatory preference, sustainability goals, and compatibility with IPM practices.
- Key Opportunity: Pairing plant activators with digital monitoring and decision tools boosts field performance and improves return on investment for farmers.
| Key Insights | Details |
|---|---|
|
Plant Activators Market Size (2026E) |
US$ 1,032.1 Million |
|
Market Value Forecast (2033F) |
US$ 1,541.7 Million |
|
Projected Growth CAGR (2026-2033) |
5.9% |
|
Historical Market Growth (2020-2025) |
5.5% |
Market Dynamics
Driver - Rising Abiotic and Biotic Stress in Agriculture
Climate-induced stresses such as drought, extreme temperatures, and salinity are key growth drivers for the Plant Activators market. Annual global crop losses from environmental stress range between 20–40%, urging farmers to adopt solutions that enhance plant resilience without relying on synthetic chemicals. Plant activators stimulate Systemic Acquired Resistance (SAR) and Induced Systemic Resistance (ISR), helping plants develop defenses against pathogens while improving tolerance to water scarcity and salinity, making them essential for climate-smart agriculture.
Research shows that activators incorporating brassinosteroids or jasmonic acid derivatives can improve water use efficiency by up to 30% under moderate stress. Unpredictable monsoons in India, droughts in North America, and shifting frost patterns in Europe have accelerated adoption, positioning plant activators as vital for safeguarding yields and ensuring sustainable crop production.
Regulatory Shift Toward Biological and Low-Toxicity Solutions
Global regulations are increasingly restricting synthetic pesticides while encouraging biological crop protection products. Europe’s Fertilising Products Regulation (FPR 2019/1009) formally recognizes biostimulants as a distinct category, simplifying market entry and reducing approval timelines from 3–5 years to 12–24 months. North America and the Asia Pacific are following similar approaches, promoting plant activators as safe, low-toxicity alternatives to conventional chemicals.
Multiple biological activator ingredients, including Bacillus subtilis and Pseudomonas chlororaphis, are approved by the US EPA, validating efficacy and safety. Major agrochemical companies such as BASF, Bayer, and Syngenta are increasingly investing in R&D for plant activation technologies. This regulatory tailwind is accelerating innovation, expanding product portfolios, and driving global market growth in plant activators.
Restraint - Cost Differential and Farmer Adoption Barriers
Plant activators are priced significantly higher than conventional synthetic pesticides, often 1.5–3 times more per hectare, creating adoption challenges, especially for smallholder farmers in price-sensitive regions. While activators enhance stress tolerance and disease resistance, benefits are realized over multiple seasons, whereas synthetic pesticides deliver immediate visible results. Small farm sizes, limited capital, and delayed ROI reinforce resistance to adoption despite regulatory incentives.
This cost disparity is particularly pronounced in South Asia and Sub-Saharan Africa, where farmers operate on tight margins and require short-term outcomes. Without financial support, extension services, or technical guidance, risk-averse growers are reluctant to invest in plant activators, limiting penetration in developing markets.
Limited Farmer Awareness and Technical Knowledge Gaps
The market faces significant adoption constraints due to low farmer awareness and technical knowledge gaps. Many growers lack understanding of plant activation mechanisms, SAR and ISR pathways, or the correct application timing for maximum efficacy. This challenge is acute in developing regions with limited extension infrastructure and minimal access to agronomic advisory services.
Successful use requires diagnosis of stress conditions, selection of suitable activators, and integration with existing crop management complexity that contrasts sharply with simple pesticide use. Low literacy and limited educational investment further restrict adoption, creating a cycle where market growth is hindered by insufficient farmer training and support.
Opportunity - Integration with Precision Agriculture and Digital Farming Technologies
The integration of plant activators with precision agriculture, digital farm management, and data-driven decision-making presents a major growth opportunity. Smart farming tools, including soil sensors, spectral imaging, and AI-driven platforms, enable precise optimization of activator dosage, timing, and formulation based on real-time crop stress. This approach improves activator efficacy, reduces input costs, and minimizes environmental runoff. Advanced digital solutions from companies like BASF and Corteva are increasingly embedding plant activator recommendations into crop management workflows, making these products more actionable and effective for growers.
Emerging markets such as Brazil, China, and India are rapidly adopting digital agronomy technologies, creating new opportunities for localized, user-friendly activator integration solutions. In regions with high connectivity and farm data availability, digital integration also supports premium pricing, broader adoption, and more efficient use of plant activators, strengthening their role in modern, climate-smart agriculture practices.
Expansion into High-Value Specialty Crops and Organic Production Systems
Plant activator demand is growing strongly among specialty crop producers, including fruits, vegetables, nuts, and wine grapes, where higher crop values justify the investment. Organic farming also offers significant opportunities, as synthetic pesticide restrictions and increasing disease pressures drive adoption of biological formulations and SAR inducers. Plant activators provide science-backed alternatives to botanical pesticides or sulfur-based products while supporting integrated pest management.
Regulatory incentives and certification schemes such as Fair Trade, Rainforest Alliance, and GlobalGAP further encourage adoption. Organic and high-value crop growers benefit from improved yield stability, enhanced stress tolerance, and compliance with premium quality standards. Collectively, these factors make specialty and organic segments highly attractive, with adoption rates significantly outpacing conventional commodity agriculture and creating substantial growth potential for plant activator providers.
Category-wise Analysis
Product Type Insights
Biological plant activators hold the leading position, accounting for around 56% of the market. Their dominance reflects the accelerating move toward sustainable agriculture, regulatory preference for low-residue inputs, and strong compatibility with integrated pest management. Derived from microorganisms and plant extracts, biological activators offer biodegradability, lower toxicity, and improved reliability across diverse crop systems, especially in regions tightening residue regulations.
The fastest-growing opportunity lies in advanced biological formulations designed to improve stress tolerance and trigger multiple defense pathways simultaneously. These solutions align with climate-smart farming initiatives, organic production requirements, and evolving consumer expectations for residue-free produce. Increasing R&D collaboration between biological input suppliers and crop science companies further supports innovation and wider on-farm adoption.
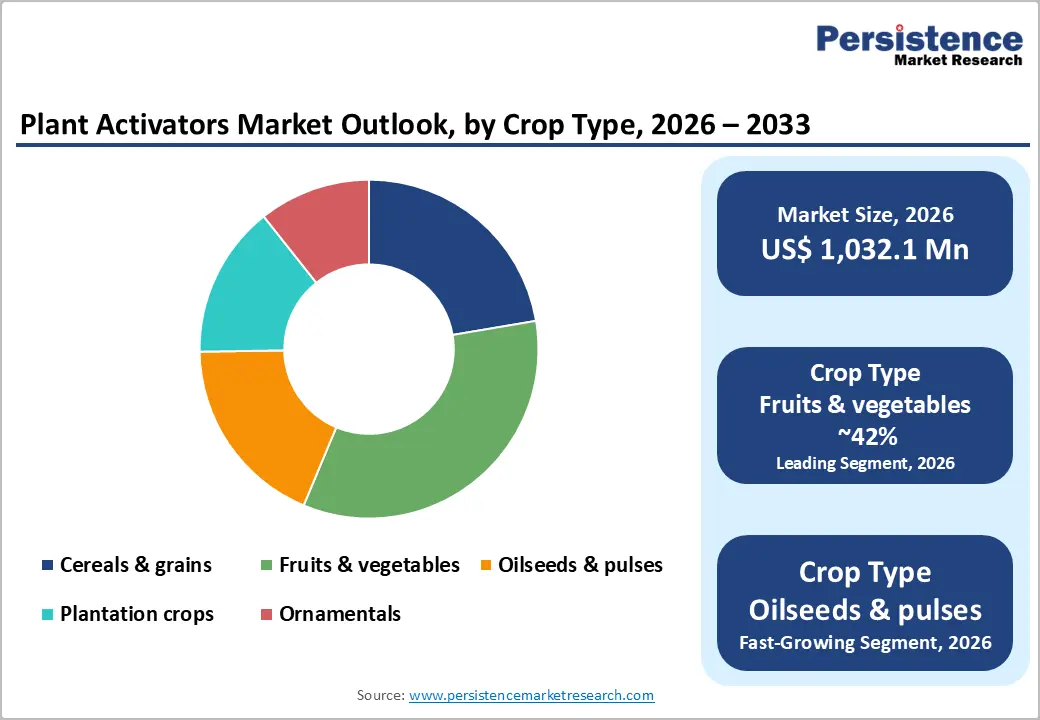
Crop Type Insights
Fruits and vegetables represent the leading crop segment, capturing roughly 42% of total demand. Their high economic value, sensitivity to fungal and bacterial diseases, and strict residue regulations drive growers to adopt plant activators as preventive shield technologies. By strengthening natural resistance, activators help reduce fungicide reliance while preserving quality standards essential for export markets and premium retail channels.
The fastest-growing opportunity is emerging in oilseeds and plantation crops, where farmers increasingly seek resilience against complex soil- and climate-related stresses. Producers are turning to plant activators to improve plant vigor, reduce stress-related yield losses, and support sustainable intensification, particularly in regions transitioning toward regenerative and conservation-oriented farming practices.
Mode of Action Insights
Systemic Acquired Resistance (SAR) inducers dominate with about 48% share. Operating through salicylic-acid signaling pathways, they trigger production of pathogenesis-related proteins and secondary metabolites. Products such as acibenzolar-S-methyl are widely used in specialty crops and orchards, offering predictable control and strong alignment with residue-reduction requirements across regulated markets.
The fastest-growing momentum is seen in solutions that combine immune-priming benefits with improved crop tolerance to environmental stress. These activators are increasingly designed to integrate seamlessly with biological inputs and reduced-chemistry programs. Their ability to complement conventional crop protection strategies rather than replace them outright makes them appealing to growers seeking reliability while gradually transitioning toward more sustainable production systems.
Formulation Insights
Water-dispersible and water-soluble granules (WDG/WSG) lead the market at about 43.5%. These formulations dissolve evenly, prevent clogging, reduce packaging volume, and maintain stability under challenging storage conditions. Their practicality makes them especially favored in regions with limited infrastructure and among growers relying on manual or older spraying equipment.
The fastest-growing traction is occurring in user-friendly, compatibility-focused formulations designed for precision agriculture. Improved handling, faster mixing, and easier integration into automated dosing systems are reshaping application practices. Manufacturers are prioritizing stability, leaf coverage, and residue behavior, ensuring products fit seamlessly within evolving spray programs while supporting efficiency, convenience, and farm-level labor savings.
Application Mode Insights
Foliar spray application dominates with about 56.1% share, reflecting its speed, flexibility, and visible results. Sprays deliver activators directly to foliage, enabling rapid uptake and targeted disease suppression. Compatibility with fungicides, nutrients, and biocontrols, along with advances in nozzle technology, further strengthens its role as the preferred application method for many growers.
The fastest-growing application opportunity is seed treatment, driven by interest in early-season protection and long-lasting immune priming. By treating seeds before planting, growers secure uniform coverage, reduce operational passes, and support healthier root development. As research improves formulations and placement techniques, seed-applied activators are becoming an integral component of integrated crop establishment strategies.
Regional Insights
North America Plant Activators Market Trends
North America accounts for 32.1% of the global plant activators market, reflecting high technology adoption, strong regulatory support, and rising climate-driven stress across major crops. U.S. growers increasingly deploy plant activators in corn, soybean, fruits, and vegetables to manage emerging pathogens and improve resilience while staying compliant with residue-reduction requirements and sustainability programs.
Canada and Mexico are strengthening uptake as regulatory alignment improves and export-oriented growers seek better disease prevention strategies. Biological approvals, digital agronomy platforms, and precision-application tools are accelerating integration into mainstream crop programs. With innovation pipelines from BASF, Bayer, Corteva, and FMC expanding rapidly, North America is positioned to maintain its leadership and continue transitioning toward biology-driven crop protection systems.
Europe Plant Activators Market Trends
Europe remains one of the most structured and regulated markets, benefiting from the EU Fertilising Products Regulation, which clearly defines the role of plant biostimulants. This framework enhances trust, accelerates product approvals, and supports cross-border harmonization, encouraging rapid deployment across premium crops, organic farming, and protected horticulture systems. The regional growth is forecast to expand at around 6.3% CAGR, supported by sustainability targets, pesticide-reduction policies, and strong institutional backing for induced resistance technologies. Countries such as Germany, France, Spain, and Italy drive most demand, while large agrochemical firms and biological specialists continue expanding portfolios. Ongoing climate warming, disease spread, and stricter residue controls further position plant activators as strategic tools within integrated crop-management programs.
Asia Pacific Plant Activators Trends
Asia Pacific commands 43.8% of the global plant activators market, driven by its vast agricultural base, intense cultivation practices, and increasing exposure to heat, drought, salinity, and disease pressure. China, India, Japan, and Southeast Asia rely heavily on plant activators to stabilize yields in rice, wheat, vegetables, and plantation crops while meeting tightening residue and sustainability requirements.
Adoption is accelerating as governments promote biological input, digital agronomy tools improve application precision, and localized manufacturing lowers cost barriers. Smallholder-focused programs in India, modernization in China, and high-value horticulture growth across Japan and ASEAN are creating sustained structural demand. As climate variability intensifies and chemical reduction policies expand, the Asia Pacific is expected to remain the world’s most influential demand center for plant activators.
Competitive Landscape
The plant activators market is moderately consolidated, with leading players holding a significant proportion of global revenue due to broad portfolios, strong distribution networks, and sustained R&D spending. At the same time, meaningful fragmentation persists across regions and product niches, particularly in biological and specialty segments where focused innovators capture rising demand through differentiated technologies.
Smaller specialist firms increasingly compete through proprietary microbial libraries, deeper understanding of crop-specific stress pathways, digital decision-support platforms, and strategic distribution alliances. Industry momentum is shifting toward multifunctional, value-added formulations and portfolio integration, as consolidation accelerates and companies align biological, nutritional, and activation technologies into unified crop-health solutions.
Key Market Developments
- In May 2025, Marrone Bio Innovations and Valagro announced a global non-exclusive research collaboration leveraging Marrone Bio's microorganism collection of 18,000+ microbial strains in combination with Valagro's plant biostimulants and nutrition products, targeting the development of advanced integrated crop health solutions addressing the US$ 155 Billion global plant nutrition market.
- In March 2024, Certis Biologicals acquired proprietary biological fungicides Howler® and Theia® from AgBiome, strengthening its position in biological crop protection and enabling expansion into specialty crop markets requiring broad-spectrum disease control with minimal environmental impact.
- In December 2024, BASF launched an advanced seed treatment product featuring biologically active ingredients for soil-borne disease and pest protection, incorporating enhanced germination and plant growth features, reflecting industry-wide acceleration in biological seed treatment solutions as farmers seek sustainable alternatives to synthetic chemical coatings.
Companies Covered in Plant Activators Market
- Syngenta
- BASF
- Bayer
- Corteva Agriscience
- FMC Corporation
- UPL
- Nutrien
- Certis Biologicals
- Valagro, Novozymes
- AgBiome
- Marrone Bio Innovations
- Isagro
- Gowan Company
- Koppert Biological Systems
Frequently Asked Questions
The global plant activators market is valued at US$ 1,032.1 million in 2026 and is projected to expand to US$ 1,541.7 million by 2033, representing a consistent 5.9% CAGR throughout the forecast period.
Growth is driven by climate-induced crop stress (causing 20–40% yield losses), regulatory push toward biological inputs, shrinking arable land, and rising preference for residue-free produce.
Fruits & vegetables lead with ~42% share, due to high economic value, strong disease pressure, strict residue limits, and higher willingness to invest in preventive crop protection.
Asia Pacific leads with 43.8% share, while Europe is the fastest-growing region at ~6.3% CAGR, supported by strict sustainability and biostimulant regulations.
Top opportunities include precision-agriculture integration, organic expansion (EU 25% farmland target), specialty crops growth, and rising seed-treatment adoption alongside strong uptake of biological activators (56% share).
Major agrochemical conglomerates Syngenta, BASF, Bayer, Corteva Agriscience, Marrone Bio Innovations, Koppert Biological Systems, Certis Biologicals, and Valagro.


