


- Testing, Inspection, & Certification
- Marine Electronic Cartography Market
Marine Electronic Cartography Market Size, Share, and Growth Forecast, 2026 – 2033
Marine Electronic Cartography Market by Product Type (Raster Charts, Vector Charts, 3D Charts), Application (Navigation, Fisheries Management, Oil and Gas Exploration, Environmental Monitoring, Defense and Security), and Regional Analysis for 2026 – 2033
Marine Electronic Cartography Market Size and Trends Analysis
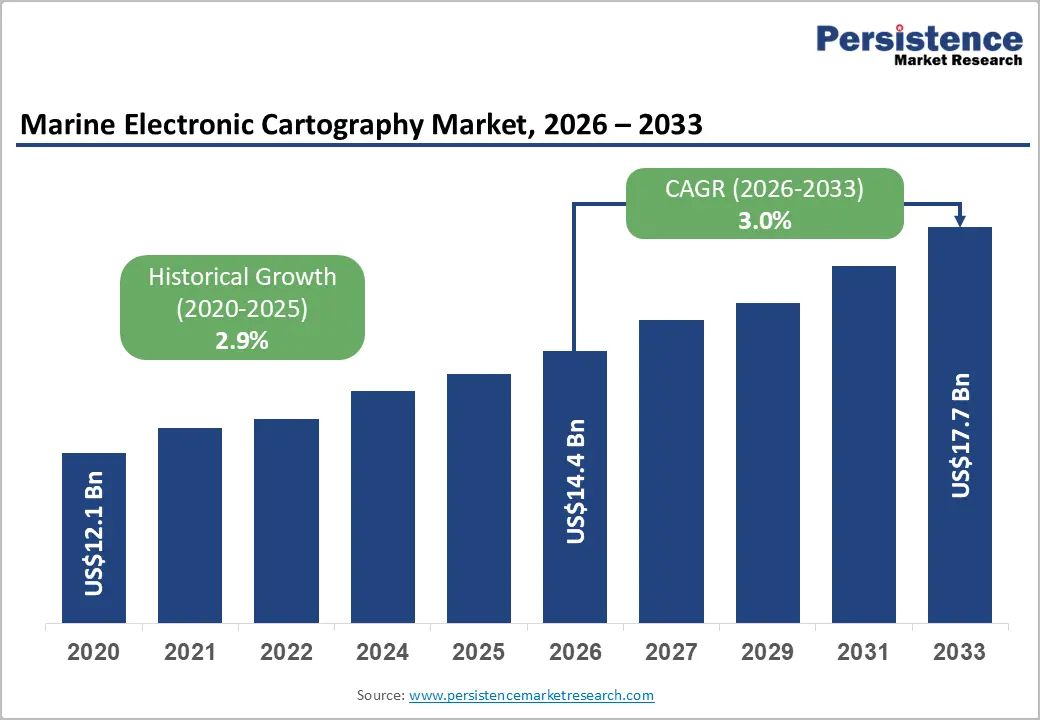
The global marine electronic cartography market size is likely to be valued at US$14.4 billion in 2026 and is expected to reach US$17.7 billion by 2033, growing at a CAGR of 3.0% during the forecast period from 2026 to 2033, driven by the transition from paper-based charts to digital navigation solutions, mandated by international maritime regulations such as IMO SOLAS requirements for ECDIS carriage, which continue to stimulate demand for electronic navigational charts (ENCs), chart management systems, and integrated bridge solutions.
In parallel, rising maritime trade volumes, fleet expansion in emerging economies, and increased vessel traffic density are elevating the need for accurate, real-time cartographic data to enhance navigational safety and operational efficiency. Technological advancements, including the shift toward vector-based and 3D charts, cloud-enabled chart distribution, and the gradual adoption of IHO S-100 data standards, are improving data accuracy, interoperability, and decision support for mariners.
Key Industry Highlights:
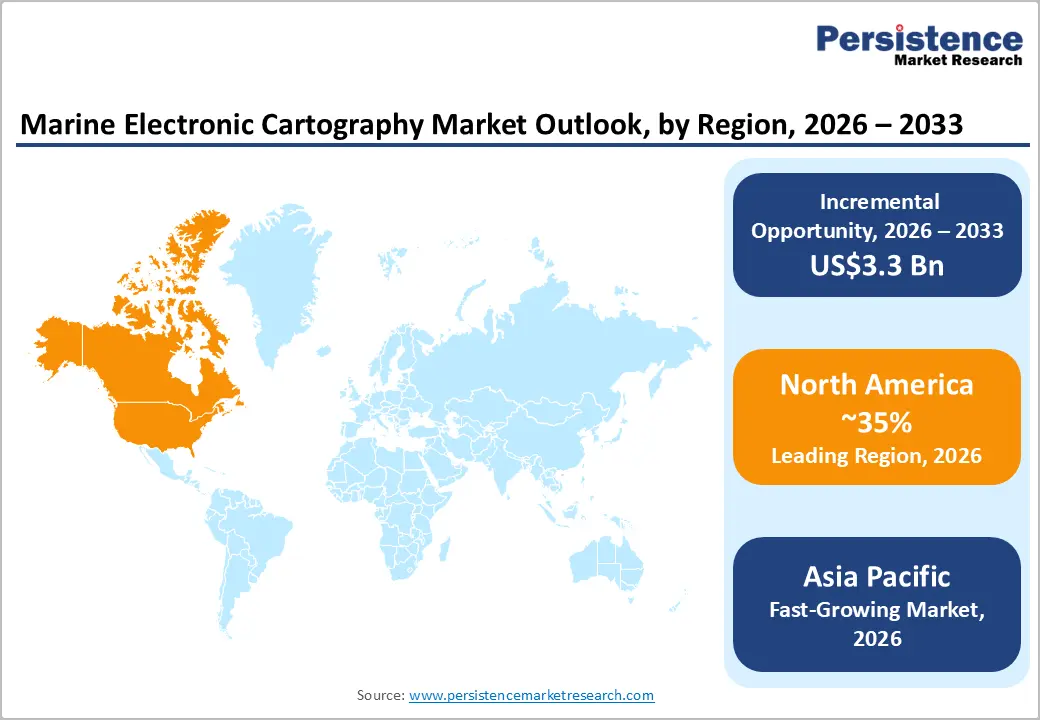
- Leading Region: North America is expected to be the leading region, accounting for 35% market share in 2026, driven by strong regulatory compliance, advanced technology adoption, and high penetration across the commercial and defense maritime sectors.
- Fastest-growing Region: Asia Pacific is likely to be the fastest-growing region in marine electronic cartography in 2026, supported by expanding maritime trade, fleet growth, and accelerating digital navigation adoption across emerging and developed economies.
- Leading Product Type: Vector charts are projected to be the leading product type in 2026, accounting for 55% of revenue, driven by widespread adoption in electronic chart display and information system (ECDIS)- enabled commercial navigation.
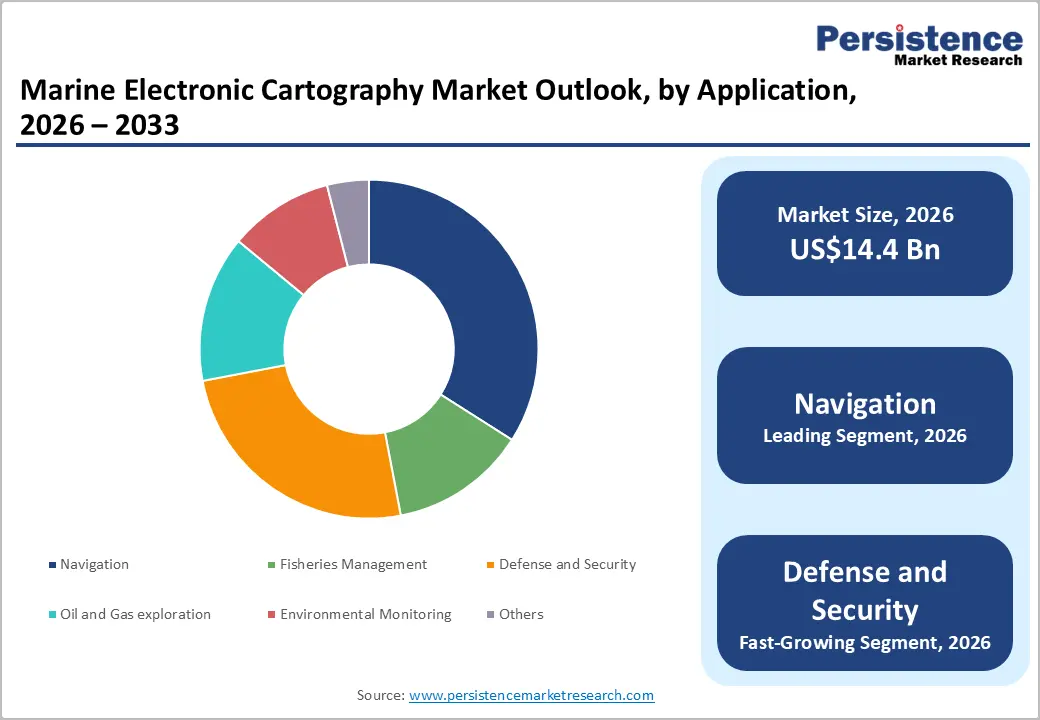
- Leading Application: Navigation is expected to be the leading application type, accounting for over 50% of revenue in 2026, supported by mandatory ECDIS adoption under international maritime regulations, rising seaborne trade, and the critical need for accurate, real-time charting to ensure safe and efficient vessel operations.
| Global Market Attributes | Key Insights |
|---|---|
| Marine Electronic Cartography Market Size (2026E) | US$14.4 Bn |
| Market Value Forecast (2033F) | US$17.7 Bn |
| Projected Growth (CAGR 2026 to 2033) | 3.0% |
| Historical Market Growth (CAGR 2020 to 2025) | 2.9% |
Market Factors – Growth, Barriers, and Opportunity Analysis
Increasing Maritime Trade and Operational Efficiency Needs
Growing demand for raw materials, energy resources, and finished goods has led to higher vessel traffic across major sea routes, ports, and congested waterways. This increase in traffic heightens the need for accurate, up-to-date navigation data to minimize collision risk, grounding incidents, and route inefficiencies. Marine electronic cartography solutions, particularly vector charts and ECDIS-compatible systems, enable mariners to access real-time navigational data, dynamic chart updates, and precise positional awareness, which are critical for managing complex voyages. Expanding port infrastructure, larger vessel sizes, and the development of new shipping lanes are reinforcing the adoption of advanced digital charts.
The need for improved operational efficiency is accelerating the shift toward marine electronic cartography solutions across commercial, offshore, and defense fleets. Ship-owners and operators are under continuous pressure to reduce fuel consumption, optimize voyage planning, and lower operational costs while maintaining strict safety standards. Electronic cartographic systems support these objectives by enabling optimized route selection, real-time hazard detection, and seamless integration with onboard navigation and monitoring systems such as radar, AIS, and GPS. By replacing paper charts and manual processes, digital cartography significantly reduces administrative workload and human error, leading to more efficient bridge operations. Fleet-wide chart management and automated update services help operators ensure compliance with international regulations while minimizing downtime.
Cybersecurity and Interoperability Risks
Navigation systems become increasingly digital, interconnected, and data-driven. Modern electronic cartography solutions rely on continuous data exchange among Electronic Chart Display and Information Systems (ECDIS) chart management systems, GPS, Automatic Identification Systems (AIS), Radar, and shore-based networks, thereby expanding the potential attack surface for cyber threats. Unauthorized access, data manipulation, malware, or ransomware attacks on electronic charts or navigation systems can compromise voyage safety, lead to incorrect positioning or route guidance, and disrupt vessel operations. High-profile cyber incidents in the maritime sector have heightened awareness among shipowners, regulators, and insurers, leading to stricter cybersecurity requirements and additional compliance burdens.
Interoperability challenges restrain market growth, especially in fleets operating mixed or legacy navigation systems. Marine electronic cartography solutions must seamlessly integrate with various onboard systems from different manufacturers, many of which were installed at different times and follow different technical standards. Incompatibilities between older ECDIS units, proprietary software platforms, and next-generation chart formats, such as those based on the IHO S-100 framework, can lead to data inconsistencies, reduced functionality, or additional retrofit requirements. This lack of standardization increases training demands for crew members and raises concerns about operational reliability during system transitions. Ship operators may hesitate to adopt new cartographic technologies due to fears of vendor lock-in or disruption to existing workflows.
Technological Convergence with Autonomous and Green Shipping
The maritime industry is increasingly adopting intelligent and data-driven vessel operations. Autonomous and semi-autonomous vessels rely heavily on high-precision electronic navigational charts, real-time geospatial data, and advanced situational awareness to make accurate navigational decisions without continuous human intervention. Modern marine electronic cartography solutions, particularly vector and emerging 3D charts, support this transition by enabling dynamic data layering, obstacle detection, and seamless integration with sensors such as radar, LiDAR, sonar, and satellite navigation systems. The evolution toward IHO S-100 standards is enhancing interoperability and data richness, allowing autonomous navigation systems to access standardized, high-resolution hydrographic and environmental information.
The shift toward green shipping and sustainability initiatives is creating new avenues for innovation within the marine electronic cartography market. Shipping companies are under increasing pressure to reduce carbon emissions, improve fuel efficiency, and comply with evolving environmental regulations set by international and regional authorities. Electronic cartography solutions contribute directly to these goals by enabling optimized voyage planning, fuel-efficient routing, and avoidance of environmentally sensitive or restricted marine areas. Integration of real-time weather, currents, and bathymetric data allows vessels to select routes that minimize fuel consumption and emissions while maintaining safety. Electronic charts increasingly support environmental monitoring, emissions reporting, and compliance with marine protected area regulations.
Category-wise Analysis
Product Type Insights
Vector charts are expected to lead the marine electronic cartography market, accounting for approximately 55% of revenue in 2026, driven by their advanced functionality, scalability, and seamless compatibility with electronic chart display and information systems (ECDIS). Unlike raster charts, vector charts allow layered data visualization, object-based querying, real-time updates, and alarms for navigational hazards, making them the preferred choice for commercial shipping and regulated maritime operations.
For example, large container shipping operators commonly deploy vector-chart-based ECDIS solutions across entire fleets to ensure standardized navigation practices and regulatory compliance. The ability to integrate vector charts with radar, AIS, and positioning systems strengthens their adoption.
3D charts are likely to represent the fastest-growing segment in 2026, supported by advances in visualization technologies and the expansion of non-traditional navigation applications. These charts provide enhanced three-dimensional representations of seabed topography, underwater structures, and coastal environments, significantly improving situational awareness in complex maritime settings. Growth is particularly strong in oil and gas exploration, offshore construction, and environmental monitoring, where accurate interpretation of underwater terrain is critical for operational planning and risk mitigation.
Integration with sonar, radar, and bathymetric data enables more informed decision-making in challenging environments. For example, the use of 3D electronic charts in offshore wind farm development, where operators rely on detailed seabed visualization to plan cable routes and installation activities safely.
Application Insights
Navigation is projected to lead the market, capturing around 50% of the revenue share in 2026, supported by mandatory ECDIS usage in commercial shipping, where electronic charts are essential for safe passage planning, collision avoidance, and regulatory compliance. Navigation-focused applications are deployed across cargo vessels, tankers, passenger ships, and offshore support vessels, making them the most widely adopted use case. The use of accurate, continuously updated electronic charts is critical for ensuring safe navigation through congested sea lanes, narrow channels, and port approaches.
For example, international commercial shipping fleets rely on navigation-centric electronic charting systems to comply with SOLAS requirements while optimizing voyage planning and minimizing operational risk.
The defense and security segment is likely to be the fastest-growing application area, driven by rising geopolitical tensions and heightened maritime security concerns. Naval forces and coast guards require highly accurate, secure, and frequently updated electronic charts to support surveillance, patrol missions, amphibious operations, and strategic planning. Advanced electronic cartography supports precise coastal mapping, restricted-area monitoring, and seamless integration with command-and-control systems.
For instance, naval fleets are increasingly adopting secure electronic charting solutions to support mission planning and provide real-time situational awareness during maritime security operations. As governments continue to invest in naval modernization and enhanced maritime domain awareness, demand for specialized, defense-grade cartographic solutions is accelerating.
Regional Insights
North America Marine Electronic Cartography Market Trends
North America is expected to be the leading region, accounting for 35% market share in 2026, driven by strong maritime infrastructure, stringent regulatory compliance, and high adoption of digital navigation systems across commercial and defense fleets. The U.S. and Canada have established robust frameworks for adopting electronic navigational charts (ENCs), with national hydrographic agencies leading the transition from traditional paper and raster charts to advanced digital formats that enhance navigational safety and efficiency.
The presence of specialized cartographic software providers such as Teledyne CARIS Inc., which develops advanced geomatics and marine cartography tools for hydrographic chart production and digital charting workflows, further underscores the region’s strong focus on innovation and data quality in marine electronic cartography.
Technological trends in North America are shaping the market toward more intelligent, connected, and secure navigation solutions that extend beyond basic chart display functionality. Operators are increasingly adopting cloud-connected and analytics-enabled ECDIS platforms that support remote fleet monitoring, automated chart updates, and centralized management of ENC subscriptions, which enhance operational efficiency and reduce administrative overhead.
Cybersecurity is also a prominent market focus, with maritime stakeholders emphasizing hardened chart delivery mechanisms, encrypted data streams, and secure communications between onboard systems and shore-based networks to mitigate risks associated with digital navigation.
Europe Marine Electronic Cartography Market Trends
Europe is likely to be a significant market for marine electronic cartography in 2026, driven by widespread adoption, robust regulatory frameworks, and a focus on digital navigation technologies that enhance maritime safety and efficiency. The region accounts for a significant share of the electronic navigational charts and ECDIS market, supported by the proactive enforcement of International Maritime Organization (IMO) standards across major EU maritime nations and robust hydrographic services from national agencies.
For example, C-MAP, part of the Navico Group, a European chart data provider, is widely used by commercial and recreational vessels for its high-resolution electronic nautical charts and continuous update services, exemplifying how local companies are shaping regional charting standards and meeting diverse navigational needs across Europe.
Compliance and safety, technological innovation and interoperability are emerging as key market drivers in Europe’s marine cartography landscape. Vessel operators and service providers in the region are increasingly prioritizing solutions that support cloud-based chart management, AI-enhanced routing, predictive analytics, and integration with multi-sensor systems such as radar, GPS, and AIS to deliver real-time situational awareness. These advancements help reduce human errors, optimize route planning, and improve fuel efficiency, aligning with broader maritime digitalization and sustainability goals.
European hydrographic offices and private vendors are investing in IHO S-100 standards to improve data quality and ensure compatibility across legacy and next-generation navigation systems.
Asia Pacific Marine Electronic Cartography Market Trends
The Asia-Pacific region is likely to be the fastest-growing, driven by burgeoning maritime trade, extensive port and coastal infrastructure development, and accelerated adoption of digital navigation systems across commercial and defense fleets. Countries such as China and India are at the forefront of this shift, investing in e-navigation initiatives and chart modernization to support increasing vessel traffic and ensure maritime safety. The region’s strategic shipbuilding hubs and large export-oriented economies are also driving fleet modernization programs, leading to rising adoption of electronic navigational charts (ENCs) and integrated ECDIS platforms.
This growing demand for digital navigation solutions is driving companies to develop advanced, region-specific electronic cartography systems tailored for fleets in the Asia-Pacific region. For example, Furuno Electric Co., Ltd., a Japan-based marine electronics veteran that actively supports charting and navigation solutions across the Asia Pacific. Furuno’s participation in key regional events such as Asia Pacific Maritime and its portfolio of ECDIS compatible systems tailored for busy shipping corridors demonstrate how companies are aligning products with local market needs for reliable and up-to-date electronic charts.
Such offerings help commercial and defense vessels improve navigational accuracy and operational safety amid rising maritime activity in the Indo-Pacific.
Competitive Landscape
The global marine electronic cartography market exhibits a moderately fragmented structure, driven by the coexistence of established maritime electronics OEMs, specialized cartographic data providers, and emerging technology firms, each targeting differentiated customer needs across commercial, defense, and offshore segments. Competition increasingly centers on support for next generation chart standards such as IHO S 100, user interface design, secure ENC distribution, and integration capabilities with bridge systems, rather than pure hardware alone, enabling richer situational awareness, fleet synchronization, and compliance automation for large and complex vessel operations.
With key leaders including Wärtsilä Voyage, Kongsberg Gruppen, Navico Group, Northrop Grumman Corporation, Transas Marine (Wärtsilä), Tokyo Keiki Inc., ChartWorld, and SevenCs GmbH, contributing to a competitive ecosystem where technological advancement, data quality, and regulatory compliance define leadership positions. These players compete through strategic R&D investments, technology partnerships, expanded service networks, and tailored software platforms that enhance interoperability, cybersecurity, and data delivery performance for demanding maritime environments.
Key Industry Developments:
- In August 2025, Marine Zero launched MAP (Maritime Analytics Platform), a new data-driven consulting service designed to support maritime electrification and port planning by leveraging real vessel operational data, predictive analytics, and machine learning. MAP enables operators to analyze AIS-derived route patterns, voyage durations, and power usage to accurately assess the technical requirements for electrifying existing vessels, including energy storage needs, peak propulsion power, and suitable charging rates. The consultancy service delivers a tailored report outlining system requirements, preliminary electric or hybrid design options, charging infrastructure needs, and high-level cost and feasibility indicators, helping fleet owners and port planners remove guesswork from early-stage electrification and clean energy transition decisions.
- In October 2025, iNav4U partnered with Aqua Map to launch an integrated yacht management platform, combining Aqua Map’s digital marine charts with iNav4U’s Zora operational system. The unified platform enables captains and yacht owners to manage navigation, voyage planning, safety protocols, maintenance schedules, financial tracking, and document management through a single interface, eliminating the need to switch between multiple applications. Aqua Map co-founder Giorgio Ghiggini noted that this integration brings all onboard equipment together on a single screen and introduces Aqua Map charts to the PC.
Companies Covered in Marine Electronic Cartography Market
- Kongsberg Gruppen
- Furuno Electric Co.
- Northrop Grumman Corp.
- Garmin Ltd
- Wärtsilä Voyage
- Navico Group
- SevenCs GmbH
- Raymarine
- Tokyo Keiki Inc.
Frequently Asked Questions
The global marine electronic cartography market is projected to reach US$14.4 billion in 2026
Growing adoption of digital navigation systems, mandatory ECDIS regulations, and the need for safer and more efficient vessel operations.
The marine electronic cartography market is expected to grow at a CAGR of 3.0% from 2026 to 2033.
Key market opportunities lie in the integration of advanced technologies such as 3D charts, autonomous vessel navigation, and green shipping solutions.
Kongsberg Gruppen, Furuno Electric Co., Northrop Grumman Corp., and Wärtsilä Voyage are the leading players.


