Low Speed Vehicles Market Size, Share, and Growth Forecast, 2025 - 2032

Low Speed Vehicles Market by Vehicle Type (Commercial Turf Utility Vehicle, Golf Cart, Personal Mobility Vehicle), Power Output (>15 KW, 6-15 KW, <15 KW), Application (Golf Courses, Hotels & Resorts, Airports, Industrial Facilities), and Regional Analysis for 2025 - 2032

ID: PMRREP30533
Calendar

September 2025

191 Pages

Author : Jitendra Deviputra

Low Speed Vehicles Market Size and Trend Analysis

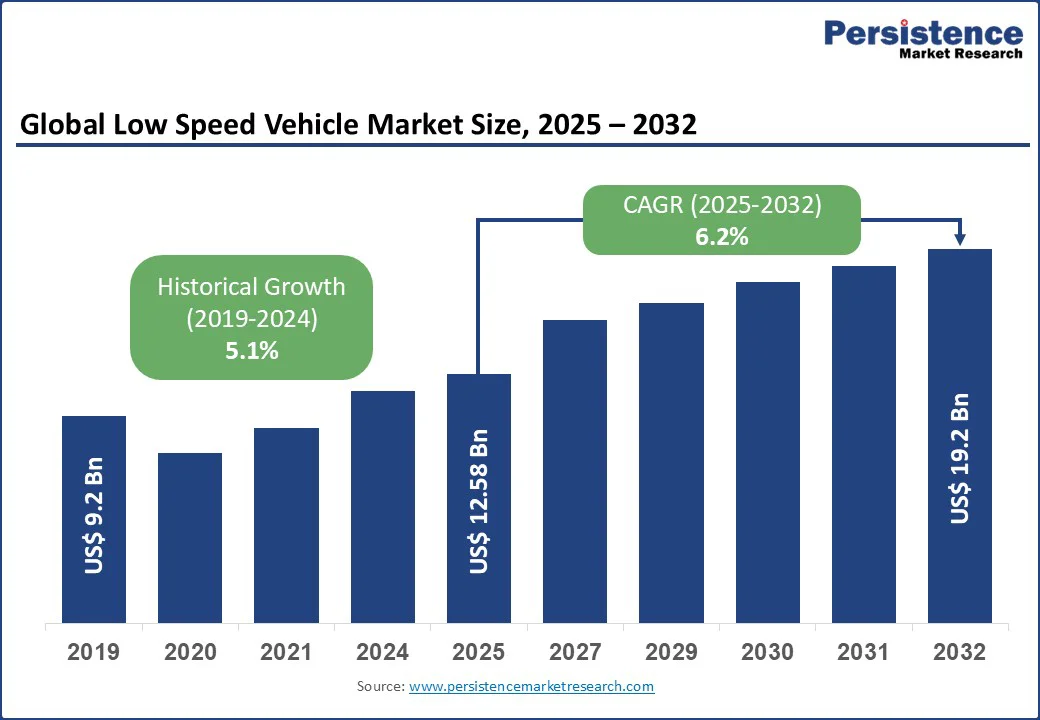
The global low speed vehicles market size is likely to value at US$ 12.6 Bn in 2025 and reach US$19.2 Bn by 2032, growing at a CAGR of 6.2% during the forecast period from 2025 to 2032. The LSV market is experiencing robust growth, fueled by increasing demand for eco-friendly, cost-efficient transport solutions in controlled environments such as golf courses, resorts, and industrial facilities.

Key Industry Highlights

  • Leading Region: North America holds 42.5% share in 2025, driven by widespread adoption in golf courses, resorts, and industrial applications in the U.S. and Canada.
  • Fastest-Growing Region: Asia Pacific is the fastest-growing region, propelled by rapid urbanization, tourism growth, and government support for electric mobility in China and India.
  • Investment Plans: In February 2023, the U.S. Department of Transportation’s Federal Transit Administration announced $1.7 billion in available funding via the Low or No Emission Vehicle Grant Program and Grants for Buses and Bus Facilities Competitive Program, boosts LSV demand in urban and industrial settings.
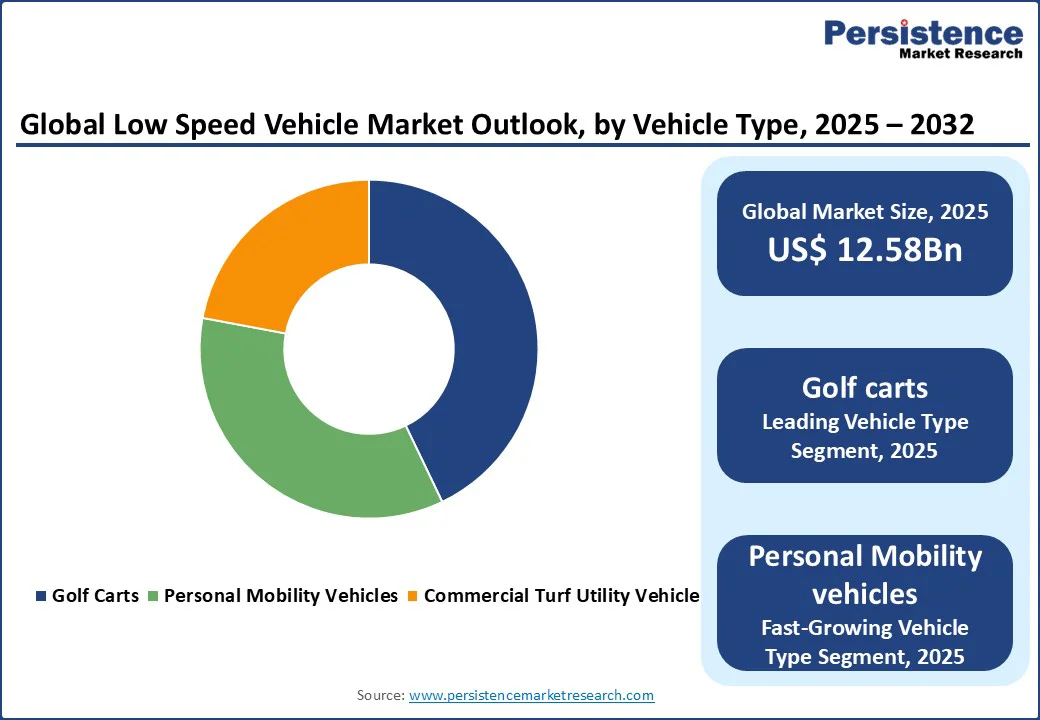
  • Dominant Vehicle Type: Golf carts account for 42.8% share, driven by their extensive use in recreational and resort applications globally.
  • Leading Application: Golf courses contribute over 35.7% of market revenue, fueled by the global expansion of golf tourism and leisure facilities.

Low Speed Vehicle Market Size 2025 - 2032

Key Insights Details

Low Speed Vehicles Market Size (2025E)

US$12.6 Bn

Market Value Forecast (2032F)

US$19.2 Bn

Projected Growth (CAGR 2025 to 2032)

6.2%

Historical Market Growth (CAGR 2019 to 2024)

5.1%

Market Dynamics

Driver - Rising Demand for Sustainable and Cost-Effective Mobility Solutions

The global low speed vehicles market is experiencing significant growth due to increasing demand for sustainable and cost-effective mobility solutions across various sectors. LSVs, primarily electric-powered, offer low carbon emissions and reduced operational costs compared to traditional vehicles, aligning with global sustainability goals. In the Global EV Outlook 2024 report, under the Stated Policies Scenario (STEPS), global EV sales (excluding two?/three?wheelers) are projected to reach 43?million units in 2030, driven by government incentives and environmental policies.

In the U.S., the Inflation Reduction Act of 2022 provides tax credits for electric vehicle adoption, boosting LSV use in golf courses and resorts. Companies such as Club Car and E-Z-GO reported sales growth in electric LSVs in 2024, driven by demand in tourism and industrial applications. Growing environmental awareness and cost efficiency ensure sustained demand, positioning LSVs as a key driver for market growth through 2032.

Restraint - Limited Range and Regulatory Challenges

The low speed vehicles market faces challenges due to the limited range of electric LSVs and stringent regulatory frameworks. Most LSVs, with power outputs below 15 KW, have a range of 30–50 miles per charge, limiting their use in large-scale applications or extended travel. This constraint impacts adoption in industrial facilities requiring long-distance transport. Additionally, varying regulations across regions create compliance challenges. For instance, the U.S. National Highway Traffic Safety Administration restricts LSVs to roads with speed limits of 35 mph or less, limiting their versatility.

In Europe, homologation standards for LSVs vary by country, increasing production costs for manufacturers such as Yamaha Motor Company. Competition from faster, conventional vehicles and limited charging infrastructure in emerging markets further restrains growth, particularly in cost-sensitive regions, impacting the overall market expansion.

Opportunity - Growth in Tourism and Industrial Automation

The expanding tourism sector and increasing industrial automation present significant opportunities for the low speed vehicles market. LSVs, such as golf carts and commercial turf utility vehicles, are widely used in hotels, resorts, and airports for efficient passenger and cargo transport. In 2024, international tourism receipts totaled a record USD 2.0 trillion, as per the World Tourism Organization, with a focus on sustainable travel driving LSV adoption in resorts and eco-tourism destinations. In industrial settings, automation trends are increasing the demand for LSVs in material handling and logistics.

Government incentives, such as the EU’s Sustainable and Smart Mobility Strategy, promote electric LSVs in urban and industrial settings. Manufacturers such as Polaris Industries are innovating with high-capacity batteries and smart navigation systems, aligning with automation trends and creating opportunities for advanced, eco-friendly LSVs to meet evolving industry needs through 2032.

Category-wise Analysis

By Vehicle Type

  • Golf carts are dominant vehicle types approximately accounting for 42.8% share in 2025. Their widespread use in golf courses, resorts, and gated communities drives demand, supported by their affordability and versatility. Companies such as Club Car and E-Z-GO lead with extensive portfolios, catering to recreational and tourism sectors, particularly in North America and Europe, where golf tourism is expanding rapidly.
  • Personal mobility vehicles are the fastest-growing segment, driven by rising demand for compact, eco-friendly transport in urban and senior living communities. Their lightweight design and electric efficiency make them ideal for short-distance travel. Manufacturers such as Yamaha Motor Company and Electric Mobility are innovating with customizable, battery-powered models, boosting adoption in the Asia Pacific and North America.

By Power Output

  • The 6-15 KW segment holds the largest share approximately 45.6% in 2025, due to the balance of power and energy efficiency. This range is ideal for golf carts and commercial turf utility vehicles used in resorts and industrial facilities. Companies such as Textron Inc. and Polaris Industries dominate with models offering optimal performance for medium-duty applications across North America and Europe.
  • The >15 KW segment is the fastest-growing, driven by demand for high-performance LSVs in industrial and airport applications. These vehicles offer enhanced load capacity and speed, catering to large-scale operations. Manufacturers such as Ingersoll Rand and Cushman are expanding offerings with high-power electric models, particularly in the Asia Pacific, where industrial automation is surging.

By Application

  • Golf courses account for over 35.7% of market revenue in 2025, driven by the global expansion of golf tourism and leisure facilities. LSVs, particularly golf carts, are essential for player transport and course maintenance. Major players, such as Club Car and Yamaha Motor Company, supply specialized vehicles for golf resorts in the U.S. and Europe, where tourism drives demand.
  • Industrial facilities are the fastest-growing application for low speed vehicles market, propelled by automation and the need for efficient material handling. LSVs are used for intra-facility transport in warehouses and factories. Companies such as Textron Inc. and Polaris Industries innovate with durable, high-capacity vehicles, supporting growth in the Asia Pacific and North America, where industrial infrastructure is expanding.

Low Speed Vehicle Market By Segments 2025 - 2032

Regional Insights

North America Low Speed Vehicles Market Trends

North America holds a commanding 42.5% share of the low-speed vehicle market in 2025, driven primarily by strong demand across golf courses, resorts, and industrial sectors in the U.S. and Canada. The U.S. leisure industry extensively relies on LSVs for golf and resort transportation, valuing their efficiency and environmental benefits. Meanwhile, Canada’s industrial sector fuels demand for high-capacity LSVs used in warehouses, manufacturing facilities, and large-scale operations, supported by insights from Canadian Manufacturers & Exporters. Leading manufacturers such as Polaris Industries and Club Car dominate owing to expansive distribution networks, ensuring broad availability and tailored solutions. These companies are actively involved in sustainable mobility initiatives, offering electric and hybrid LSVs that align with growing environmental awareness.

Consumer preference is increasingly shifting toward electric LSVs, reinforcing North America’s leadership position in the low speed vehicles market. This trend underscores the region’s commitment to sustainable, efficient transportation solutions across recreational and industrial applications.

Asia Pacific Low Speed Vehicles Market Trends

Asia Pacific is the fastest-growing region, propelled by several dynamic factors. Rapid urbanization fuels demand for efficient, eco-friendly transportation solutions in congested cities and tourist hotspots. China’s 14th Five-Year Plan prioritizes green transportation, investing heavily in electric mobility infrastructure, which accelerates LSV adoption, particularly in resorts and industrial zones where low-emission vehicles align with sustainability goals. In India, the burgeoning tourism sector, supported by government campaigns such as “Incredible India,” drives increased use of golf carts and personal mobility vehicles in heritage sites and resorts.

The region’s role as a global manufacturing hub ensures competitive production costs, attracting major players such as Yamaha Motor Company to expand their footprint. Additionally, rising disposable incomes and a growing eco-tourism trend bolster demand for environmentally friendly, convenient transport options. These combined factors position the Asia Pacific as a sustained powerhouse in the LSV market through 2032.

Europe Low Speed Vehicles Market Trends

Europe ranks as the second fastest-growing region in the low-speed vehicle market, propelled by strict environmental regulations and robust demand from tourism and industrial sectors, particularly in Germany and France. The European tourism industry actively supports LSV use in resorts, airports, and other leisure destinations, prioritizing quiet, eco-friendly transportation options that enhance visitor experiences. Germany’s advanced industrial automation sector drives demand for high-power LSVs, with manufacturers such as Garia and Electric Mobility providing specialized electric vehicles tailored to logistics and factory environments.

The European Union’s Green Deal plays a pivotal role in accelerating electric LSV adoption by promoting sustainability across tourism, transport, and supply chains. This regulatory push, combined with growing consumer awareness of environmental issues, fuels steady market growth. Europe’s unwavering commitment to stringent eco-friendly standards and sustainable innovation positions the region for continuous expansion in the LSV market through 2032, supporting a greener, more efficient transportation future.

Low Speed Vehicle Market By Region 2025 - 2032

Competitive Landscape

The global low speed vehicles market is highly competitive, characterized by a fragmented landscape with numerous global and regional players. Leading companies such as Polaris Industries, Club Car, and E-Z-GO dominate through extensive product portfolios and global distribution networks. Regional players focus on localized offerings, particularly in the Asia Pacific. Companies are investing in advanced battery technologies and smart navigation systems to enhance market share, driven by demand for eco-friendly vehicles in tourism and industrial applications.

Key Industry Developments:

  • July 2025: Club Car launched the CRU, a next-generation electric golf cart with enhanced battery life and smart navigation, designed for high-performance use in resorts and golf courses. The CRU features a distinctive design with a central table and flip-forward bucket seats, emphasizing social interaction and versatility.
  • March 2024: Yamaha's DIAPASON platform utilizes Yamaha's own electric motors and is designed to be compatible with Honda's Mobile Power Pack e: system for personal, low-speed electric mobility applications. The EV platform is versatile and aims to facilitate partnerships with various companies to enable seamless mobility for all kind of users.

Companies Covered in Low Speed Vehicles Market

  • Polaris Industries
  • Club Car
  • E-Z-GO
  • Yamaha Motor Company
  • Textron Inc.
  • Garia
  • Star EV
  • Cushman
  • Revolutions Golf Cars
  • Ingersoll Rand
  • Electric Mobility
  • Global Electric Motorcars (GEM)
  • Suzuki Motor Corporation
  • Others
Frequently Asked Questions

The low speed vehicles market is projected to reach US$12.58 Bn in 2025.

Rising demand for sustainable mobility and expanding applications in tourism and industrial automation are key market drivers.

The low speed vehicles market is poised to witness a CAGR of 6.2% from 2025 to 2032.

The growth in tourism and industrial automation sectors is the key market opportunity.

Polaris Industries, Club Car, E-Z-GO, and Yamaha Motor Company are key market players.

Global Low Speed Vehicles Market Report Scope

Report Attribute

Details

Historical Data/Actuals

2019 - 2024

Forecast Period

2025 - 2032

Market Analysis

Value: US$ Bn/Mn, Volume: As Applicable

Geographical Coverage

  • North America
  • Europe
  • East Asia
  • South Asia and Oceania
  • Latin America
  • Middle East and Africa

Segmental Coverage

  • Vehicle Type
  • Power Output
  • Application
  • Region

Competitive Analysis

  • Polaris Industries
  • Club Car
  • E-Z-GO
  • Yamaha Motor Company
  • Textron Inc.
  • Garia
  • Star EV
  • Cushman
  • Revolutions Golf Cars
  • Ingersoll Rand
  • Electric Mobility
  • Global Electric Motorcars (GEM)
  • Suzuki Motor Corporation
  • Others

Report Highlights

  • Market Forecast and Trends
  • Competitive Intelligence and Share Analysis
  • Growth Factors and Challenges
  • Strategic Growth Initiatives
  • Pricing Analysis
  • Future Opportunities and Revenue Pockets
  • Market Analysis Tools
Market Segmentation

By Vehicle Type

  • Commercial Turf Utility Vehicle
  • Golf Cart
  • Personal Mobility Vehicle

By Power Output

  • 15 KW
  • 6-15 KW
  • <15 KW

By Application

  • Golf Courses
  • Hotels & Resorts
  • Airports
  • Industrial Facilities

By Region

  • North America
  • Europe
  • East Asia
  • South Asia and Oceania
  • Latin America
  • Middle East and Africa

Related Reports

  1. Executive Summary
    1. Global Low Speed Vehicles Market Snapshot, 2025 and 2032
    2. Market Opportunity Assessment, 2025 - 2032, US$ Bn
    3. Key Market Trends
    4. Future Market Projections
    5. Premium Market Insights
    6. Industry Developments and Key Market Events
    7. PMR Analysis and Recommendations
  2. Market Overview
    1. Market Scope and Definition
    2. Market Dynamics
      1. Drivers
      2. Restraints
      3. Opportunity
      4. Challenges
      5. Key Trends
    3. COVID-19 Impact Analysis
    4. Forecast Factors - Relevance and Impact
  3. Value Added Insights
    1. Value Chain Analysis
    2. Key Market Players
    3. Regulatory Landscape
    4. PESTLE Analysis
    5. Porter’s Five Forces Analysis
    6. Consumer Behavior Analysis
  4. Price Trend Analysis, 2019 - 2032
    1. Key Factors Impacting Vehicle Type Prices
    2. Pricing Analysis, By Vehicle Type
    3. Regional Prices and Vehicle Type Preferences
  5. Global Low Speed Vehicles  Market Outlook
    1. Market Size (US$ Bn) Analysis and Forecast
      1. Historical Market Size (US$ Bn) Analysis, 2019-2024
      2. Market Size (US$ Bn) Analysis and Forecast, 2025-2032
    2. Global Low Speed Vehicles  Market Outlook: By Vehicle Type
      1. Historical Market Size (US$ Bn) Analysis, By Vehicle Type, 2019-2024
      2. Market Size (US$ Bn) Analysis and Forecast, By Vehicle Type, 2025-2032
        1. Commercial Turf Utility Vehicle
        2. Golf Cart    
        3. Personal Mobility Vehicle
      3. Market Attractiveness Analysis: Vehicle Type
    3. Global Low Speed Vehicles  Market Outlook: Power Output
      1. Historical Market Size (US$ Bn) Analysis, By Power Output, 2019-2024
      2. Market Size (US$ Bn) Analysis and Forecast, By Power Output, 2025-2032
        1. 15 KW
        2. 6-15 KW
        3. <15 KW
      3. Market Attractiveness Analysis: Power Output
    4. Global Low Speed Vehicles  Market Outlook: Application
      1. Historical Market Size (US$ Bn) Analysis, By Application, 2019-2024
      2. Market Size (US$ Bn) Analysis and Forecast, By Application, 2025-2032
        1. Golf courses
        2. Hotels & Resorts
        3. Airports         Industrial Facilities   
        4. Others
      3. Market Attractiveness Analysis: Application
  6. Global Low Speed Vehicles  Market Outlook: Region
    1. Historical Market Size (US$ Bn) Analysis, By Region, 2019-2024
    2. Market Size (US$ Bn) Analysis and Forecast, By Region, 2025-2032
      1. North America
      2. Latin America
      3. Europe
      4. East Asia
      5. South Asia and Oceania
      6. Middle East & Africa
    3. Market Attractiveness Analysis: Region
  7. North America Low Speed Vehicles  Market Outlook
    1. Historical Market Size (US$ Bn) Analysis, By Market, 2019-2024
      1. By Country
      2. By Vehicle Type
      3. By Power Output
      4. By Application
    2. Market Size (US$ Bn) Analysis and Forecast, By Country, 2025-2032
      1. U.S.
      2. Canada
    3. Market Size (US$ Bn) Analysis and Forecast, By Vehicle Type, 2025-2032
      1. Commercial Turf Utility Vehicle
      2. Golf Cart    
      3. Personal Mobility Vehicle
    4. Market Size (US$ Bn) Analysis and Forecast, By Power Output, 2025-2032
      1. 15 KW
      2. 6-15 KW
      3. <15 KW
    5. Market Size (US$ Bn) Analysis and Forecast, By Application, 2025-2032
      1. Golf courses
      2. Hotels & Resorts
      3. Airports        
      4. Industrial Facilities   
      5. Others
    6. Market Attractiveness Analysis
  8. Europe Low Speed Vehicles Market Outlook
    1. Historical Market Size (US$ Bn) Analysis, By Market, 2019-2024
      1. By Country
      2. By Vehicle Type
      3. By Power Output
      4. By Application
    2. Market Size (US$ Bn) Analysis and Forecast, By Country, 2025-2032
      1. Germany
      2. France
      3. U.K.
      4. Italy
      5. Spain
      6. Russia
      7. Rest of Europe
    3. Market Size (US$ Bn) Analysis and Forecast, By Vehicle Type, 2025-2032
      1. Commercial Turf Utility Vehicle
      2. Golf Cart    
      3. Personal Mobility Vehicle
    4. Market Size (US$ Bn) Analysis and Forecast, By Power Output, 2025-2032
      1. 15 KW
      2. 6-15 KW
      3. <15 KW
    5. Market Size (US$ Bn) Analysis and Forecast, By Application, 2025-2032
      1. Golf courses
      2. Hotels & Resorts
      3. Airports        
      4. Industrial Facilities   
      5. Others
    6. Market Attractiveness Analysis
  9. East Asia Low Speed Vehicles Market Outlook
    1. Historical Market Size (US$ Bn) Analysis, By Market, 2019-2024
      1. By Country
      2. By Vehicle Type
      3. By Power Output
      4. By Application
    2. Market Size (US$ Bn) Analysis and Forecast, By Country, 2025-2032
      1. China
      2. Japan
      3. South Korea
    3. Market Size (US$ Bn) Analysis and Forecast, By Vehicle Type, 2025-2032
      1. Commercial Turf Utility Vehicle
      2. Golf Cart    
      3. Personal Mobility Vehicle
    4. Market Size (US$ Bn) Analysis and Forecast, By Power Output, 2025-2032
      1. 15 KW
      2. 6-15 KW
      3. <15 KW
    5. Market Size (US$ Bn) Analysis and Forecast, By Application, 2025-2032
      1. Golf courses
      2. Hotels & Resorts
      3. Airports        
      4. Industrial Facilities   
      5. Others
    6. Market Attractiveness Analysis
  10. South Asia & Oceania Low Speed Vehicles Market Outlook
    1. Historical Market Size (US$ Bn) Analysis, By Market, 2019-2024
      1. By Country
      2. By Vehicle Type
      3. By Power Output
      4. By Application
    2. Market Size (US$ Bn) Analysis and Forecast, By Country, 2025-2032
      1. India
      2. Indonesia
      3. Thailand
      4. Singapore
      5. ANZ
      6. Rest of South Asia & Oceania
    3. Market Size (US$ Bn) Analysis and Forecast, By Vehicle Type, 2025-2032
      1. Commercial Turf Utility Vehicle
      2. Golf Cart    
      3. Personal Mobility Vehicle
    4. Market Size (US$ Bn) Analysis and Forecast, By Power Output, 2025-2032
      1. 15 KW
      2. 6-15 KW
      3. <15 KW
    5. Market Size (US$ Bn) Analysis and Forecast, By Application, 2025-2032
      1. Golf courses
      2. Hotels & Resorts
      3. Airports        
      4. Industrial Facilities   
      5. Others
    6. Market Attractiveness Analysis
  11. Latin America Low Speed Vehicles Market Outlook
    1. Historical Market Size (US$ Bn) Analysis, By Market, 2019-2024
      1. By Country
      2. By Vehicle Type
      3. By Power Output
      4. By Application
    2. Market Size (US$ Bn) Analysis and Forecast, By Country, 2025-2032
      1. Brazil
      2. Mexico
      3. Rest of Latin America
    3. Market Size (US$ Bn) Analysis and Forecast, By Vehicle Type, 2025-2032
      1. Commercial Turf Utility Vehicle
      2. Golf Cart    
      3. Personal Mobility Vehicle
    4. Market Size (US$ Bn) Analysis and Forecast, By Power Output, 2025-2032
      1. 15 KW
      2. 6-15 KW
      3. <15 KW
    5. Market Size (US$ Bn) Analysis and Forecast, By Application, 2025-2032
      1. Golf courses
      2. Hotels & Resorts
      3. Airports        
      4. Industrial Facilities   
      5. Others
    6. Market Attractiveness Analysis
  12. Middle East & Africa Low Speed Vehicles Market Outlook
    1. Historical Market Size (US$ Bn) Analysis, By Market, 2019-2024
      1. By Country
      2. By Vehicle Type
      3. By Power Output
      4. By Application
    2. Market Size (US$ Bn) Analysis and Forecast, By Country, 2025-2032
      1. GCC Countries
      2. Egypt
      3. South Africa
      4. Northern Africa
      5. Rest of Middle East & Africa
    3. Market Size (US$ Bn) Analysis and Forecast, By Vehicle Type, 2025-2032
      1. Commercial Turf Utility Vehicle
      2. Golf Cart    
      3. Personal Mobility Vehicle
    4. Market Size (US$ Bn) Analysis and Forecast, By Power Output, 2025-2032
      1. 15 KW
      2. 6-15 KW
      3. <15 KW
    5. Market Size (US$ Bn) Analysis and Forecast, By Application, 2025-2032
      1. Golf courses
      2. Hotels & Resorts
      3. Airports        
      4. Industrial Facilities   
      5. Others
    6. Market Attractiveness Analysis
  13. Competition Landscape
    1. Market Share Analysis, 2024
    2. Market Structure
      1. Competition Intensity Mapping By Market
      2. Competition Dashboard
    3. Company Profiles (Details - Overview, Financials, Strategy, Recent Developments)
        1.  Polaris Industries
        2. Overview
        3. Segments and Type
        4. Key Financials
        5. Market Developments
        6. Market Strategy
      1. Club Car
      2. E-Z-GO
      3. Yamaha Motor Company
      4. Textron Inc.
      5. Garia
      6. Star EV
      7. Cushman
      8. Revolutions Golf Cars
      9. Ingersoll Rand
      10. Electric Mobility
      11. Global Electric Motorcars (GEM)
      12. Suzuki Motor Corporation
      13. Others
  14. Appendix
    1. Research Methodology
    2. Research Assumptions
    3. Acronyms and Abbreviations

Research Methodology Framework for Market Research Excellence

At Persistence Market Research, we implement a comprehensive, validated, and multi-dimensional approachto market analysis that delivers actionable insights across complex market landscapes. Our methodology combines the analytical rigor of leading consulting firms with innovative research techniques, ensuring robust market assessments that guide strategic decision-making with confidence.

Core Research Philosophy

Our methodology is built on four foundational pillars:

Research Philosophy Image

At Persistence Market Research, our methodology is designed to transcend conventional market studies by combining analytical rigor, multi-source validation, and future-focused insights.

We integrate advanced research frameworks, robust data collection strategies, cutting-edge analytics, and innovative technologies to deliver a 360-degree view of complex markets.

We integrate advanced research frameworks, robust data collection strategies, cutting-edge analytics, and innovative technologies to deliver a 360-degree view of complex markets.

Each stage spanning from strategic scoping and hypothesis-building to competitive intelligence, quality validation, and actionable recommendations is engineered to provide clients with unmatched clarity, precision, and confidence in decision-making.

By embedding innovation and technology at the core, our approach ensures that insights are not only comprehensive but also predictive, empowering businesses to seize opportunities, mitigate risks, and achieve sustainable growth

Research Philosophy Image

Capturing Key Information and Events

During this phase, key research objectives focus on essential information and data points for assessing the market, including:

Research Philosophy Image

TAM-SAM-SOM Framework Implementation

We employ both top-down and bottom-up approaches to ensure accurate market sizing.

Top-Down Market SizingBottom-Up Market Sizing
Universe Definition: Total global/regional market identificationUnit Economics: Average transaction values, purchase frequencies, customer lifecycle
Segmentation Filters: Geographic, demographic, and behavioral constraintsCustomer Segmentation: Detailed buyer persona development and sizing
Market Share Analysis: Competitive landscape assessment and share allocationPenetration Analysis: Market penetration rates by segment and geography
Growth Rate Application: Historical trends and forward-looking growth assumptionsScaling Methodology: Extrapolation techniques with confidence intervals

Validation & Cross-Verification

  • Triangulation: Comparing top-down and bottom-up results for consistency
  • Sensitivity Analysis: Testing key assumptions and parameter variations
  • Peer Benchmarking: Comparison with analogous markets and industry benchmarks
  • Expert Review: External validation through industry specialist consultation

Research Philosophy Image

Forecasting & Projection Modeling

Our proprietary forecasting models incorporate multiple variables and scenarios.

Forecasting Components

  • Historical Trend Analysis: 10-year historical growth patterns and cyclical variations
  • Driver-Based Modeling: Economic indicators, demographic shifts, technology adoption
  • Scenario Planning: Base case, optimistic, and conservative projections
  • Monte Carlo Simulations: Probability-weighted outcomes and risk assessments

Model Validation

  • Back-Testing: Historical accuracy assessment over 3–5-year periods
  • Cross-Validation: Multiple modeling approaches for result comparison
  • External Benchmarking: Comparison with established market forecasts
  • Continuous Calibration: Quarterly model updates based on new data

Comprehensive Data Collection Strategy

Our secondary research phase establishes a robust knowledge base utilizing diverse, credible sources.

Secondary Data Sourcess

  • Industry Publications & Reports
  • Government & Regulatory Data
  • Financial Intelligence (filings & reports)
  • Academic Research & Digital Intelligence

Quality Assurance Protocol

  • Source credibility assessment and publication date validation
  • Data consistency checks across multiple sources
  • Bias identification and neutralization techniques
  • Information gap tracking for primary research prioritization

Research Philosophy Image

Primary Research Excellence

Our primary research methodology employs best-in-class techniques to capture unique market insights.

Quantitative Research Methods

  • Large-Scale Surveys: Statistically representative samples with 95% confidence intervals
  • Survey Methodology: Multi-channel deployment (online, telephone, in-person)
  • Question Architecture and Response Optimization

Qualitative Research Methods

  • Executive Interviews
  • Focus Groups
  • Expert Consultations

Quality Assurance & Validation Framework

Multi-Stage Validation Process

  • Source Verification and Consistency Testing
  • Outlier Detection and Bias Assessment
  • Peer Review Process and External Validation
  • Sensitivity Analysis and Confidence Intervals

Research Philosophy Image

Methodology Validation & Credibility

Our research methodology has been extensively validated through:

  • Academic Partnerships: Collaborations with top-tier business schools and research institutions
  • Client Success Stories: Documented case studies demonstrating research impact and ROI
  • Continuous Benchmarking: Performance comparison with leading global research firms

This comprehensive methodology framework positions Persistence Market Research at the forefront of market intelligence, combining the analytical sophistication of top-tier consulting firms with innovative research techniques. Our approach ensures that every market assessment delivers precise, actionable, and strategically valuable insights that drive business success in competitive market environments.

Ready to unlock your market potential? Contact our research experts to discuss how our validated methodology can transform your strategic decision-making with data-driven market intelligence.

Copyright © 2026 Persistence Market Research. All Rights Reserved

Connect With Us -