Consumer Electronics Market Size, Share, and Growth Forecast 2026 - 2033

Consumer Electronics Market by Product Type (Smartphones & Mobile Devices, Laptops & Tablets, Televisions & Display Devices, Audio & Video Equipment, Home Appliances, Cameras & Imaging Devices, Others), Distribution Channel (Online Retail, Offline Retail, Direct-to-Consumer (D2C), Wholesale / Distributors), End-user, and Regional Analysis, 2026-2033.

ID: PMRREP3068
Calendar

January 2026

130 Pages

Author : Rajat Zope

Global Consumer Electronics Market Size and Trend Analysis

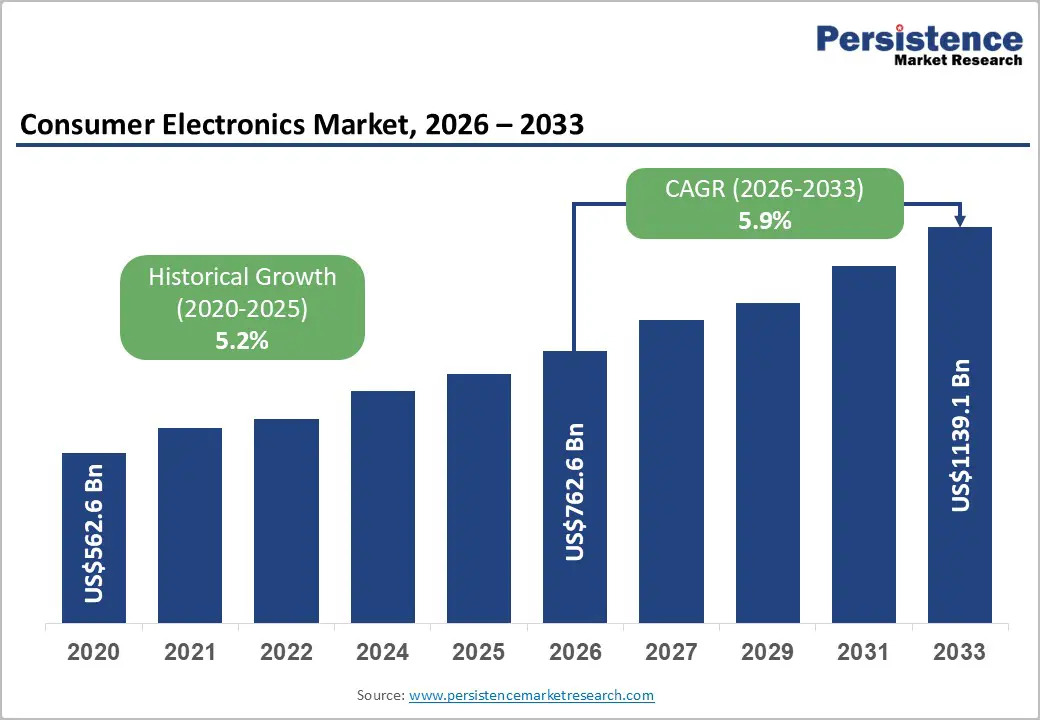
The global Consumer Electronics Market market size is likely to be valued at US$ 762.6 billion in 2026 and is projected to reach US$ 1,139.1 billion by 2033, growing at a CAGR of 5.9% between 2026 and 2033. The primary drivers include rapid advancements in 5G technology, increasing adoption of IoT devices, and rising consumer demand for smart home solutions, which enhance connectivity and user experiences across devices.

Key Industry Highlights:

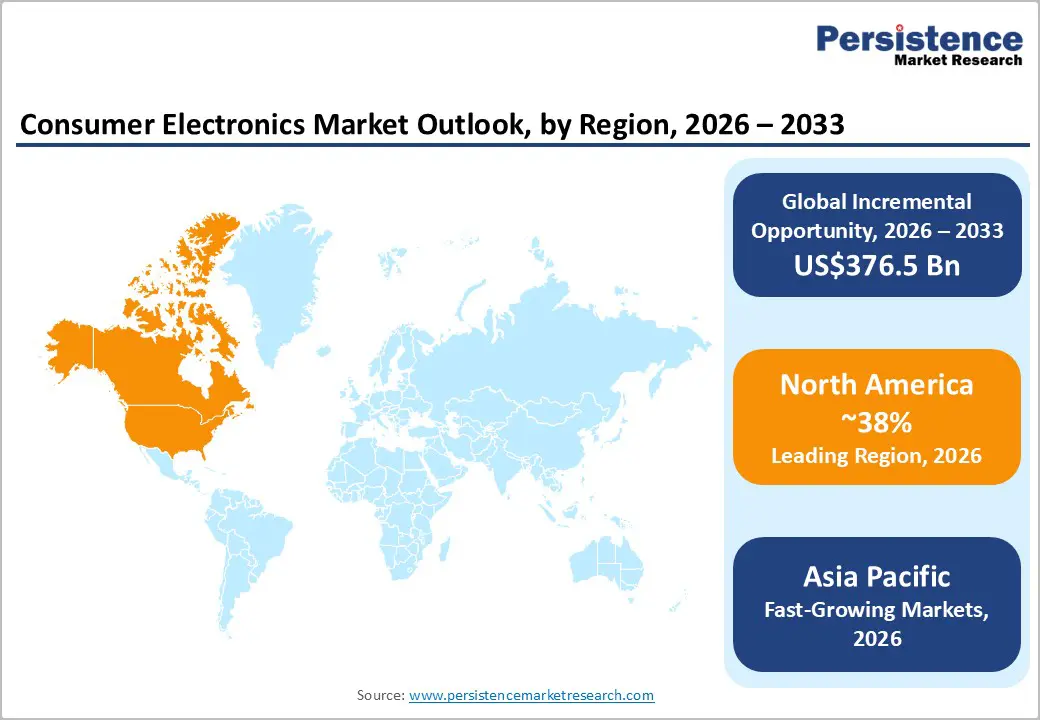
  • Leading Region: North America remains a leading region in the global consumer electronics market with 38% share, fueled by high demand for premium devices and fast adoption of 5G and AI technologies.
  • Fastest Growing Region: Asia Pacific emerges as the fastest-growing region, fueled by urbanization and 5G infrastructure in emerging economies like India, projecting 8.5% CAGR through 2030.
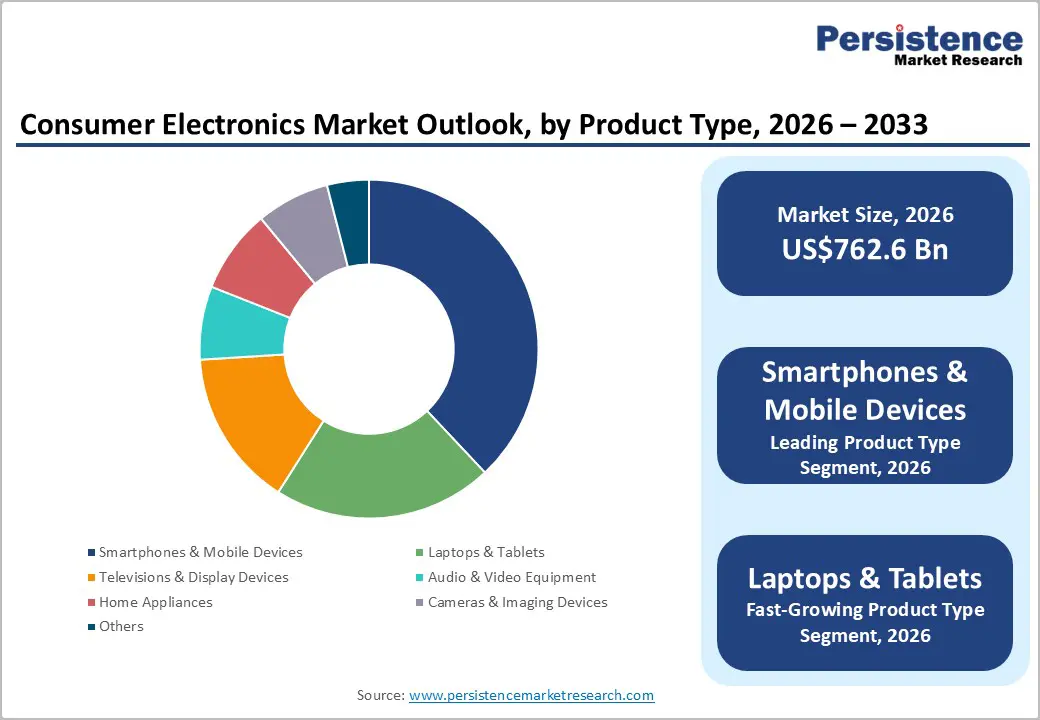
  • Leading Segment: Smartphones & Mobile Devices dominate as the key product segment, capturing 38% share with essential roles in daily connectivity and entertainment worldwide.
  • Leading Segment: Online Retail stands as the fastest-growing distribution channel, expanding at 9.73% CAGR due to e-commerce convenience and digital shopping shifts.
  • Key Opportunity: Integration of edge AI in wearables presents a prime opportunity, enabling health monitoring and personalization to tap into the wellness market's 7.8% CAGR.
Key Insights Details
Global Consumer Electronics Market Size (2026E) US$ 762.6 Bn
Market Value Forecast (2033F) US$ 1,139.1 Bn
Projected Growth CAGR (2026-2033) 5.9%
Historical Market Growth (2020-2025) 5.2%

Market Dynamics

Drivers - 5G Expansion and IoT Integration are Accelerating Global Demand for High-Performance Consumer Electronic Devices

The global rollout of 5G networks is becoming one of the strongest drivers for the consumer electronics market, as it enables faster internet speeds, reduced latency, and significantly better device responsiveness. These improvements support next-generation applications in smartphones, smart home systems, tablets, and wearables. The global 5G subscriptions will cross over billion by 2025, creating a substantial rise in demand for devices optimized for high-speed connectivity.

This shift also encourages innovation in the Consumer Electronic Accessories Market, where products like fast-charging adapters, wireless earphones, and protective accessories designed for 5G compatibility are gaining traction. Companies are accelerating investments in R&D to combine IoT and 5G capabilities, resulting in energy-efficient, AI-enabled devices that appeal to environmentally conscious consumers. These advancements strengthen device ecosystems and expand market penetration across urban households worldwide.

Growing Adoption of Connected Smart Home Technologies is Significantly Boosting Consumer Electronics Market Growth

Consumers are increasingly adopting smart home ecosystems as part of their shift toward connected and convenient living. Devices such as voice assistants, automated lighting, smart security systems, and energy-saving appliances are now becoming integrated into everyday routines. The adoption of smart home technology has surged, with millions of European households now utilizing these innovations for improved security, comfort, and energy management.

The addition of AI-driven personalization, such as adaptive climate control and health-monitoring features, further boosts the appeal of these systems by creating seamless user experiences. This trend is driving higher household spending on integrated ecosystems that offer convenience, automation, and sustainability. As smart device interoperability improves, consumers are increasingly willing to invest in long-term connected solutions, contributing to sustained market growth in both developed and emerging regions.

Restraints - Global Supply Chain Instability and Geopolitical Issues are Causing Component Shortages and Delaying Electronics Production

Persistent supply chain challenges caused by geopolitical tensions, trade restrictions, and material shortages continue to create disruptions in the consumer electronics industry. These issues have led to delays in the production of essential components, especially semiconductors, which affects the timely manufacturing of laptops, televisions, and other key electronic products. The worldwide chip shortage resulted in significant cost increases, up to 20% for semiconductor materials, and created bottlenecks that reduced product availability.

Such disruptions not only increase manufacturing expenses but also weaken consumer confidence, often leading buyers to postpone purchases. Smaller companies suffer the most, as they struggle to secure components amid rising tariffs and intense competition for limited supplies. Additionally, the delays impact efforts in e-waste management, as shortages slowed the recycling process for nearly 62 million tonnes of electronic waste worldwide.

Fast Product Obsolescence and Rising E-Waste Volumes are Increasing Costs and Limiting Sustainable Market Expansion

The rapid pace of technological innovation is making consumer electronic products obsolete much sooner, pushing consumers to upgrade frequently and contributing to a growing global e-waste problem. Global electronic waste reached 62 million tonnes, yet only 22.3% of this was recycled properly, placing significant pressure on environmental regulations and waste management systems. This challenge increases operational and compliance costs for manufacturers, especially due to strict policies such as EU recycling directives and take-back programs.

 Frequent product replacements reduce long-term return on investment and intensify competition from refurbished and second-hand markets. For many consumers, concerns about environmental sustainability influence purchase decisions, slowing the adoption of new products. As a result, companies face increasing pressure to design durable, repairable, and eco-friendly devices while maintaining profitability and staying competitive in a fast-changing technology landscape.

Opportunity - Edge AI Innovation and Rising Health Wearable Adoption are Opening High-Value Growth Opportunities

The growing integration of edge AI into consumer electronic devices is creating strong opportunities, particularly in health-focused wearables that analyze data directly on the device to ensure greater privacy and faster processing. With the number of wearable users in the U.S. expected to exceed 100 million by 2025, demand is rapidly rising for products equipped with advanced sensors for heart rate tracking, sleep analysis, stress monitoring, and personalized fitness coaching.

Innovations such as AI-enabled earbuds for real-time translation and smart rings for biometric authentication are expanding the applications of wearables across both health and lifestyle categories. Companies that collaborate with healthcare organizations and regulatory bodies can develop compliant, medically relevant devices and tap into new opportunities, including aerial health monitoring through consumer-grade drones.

Demand for Eco-Friendly, Modular, and Repairable Electronics is Creating Strong Opportunities for Sustainable Market Growth

Sustainability is becoming a major growth opportunity as consumers and regulators push for environmentally responsible products. Companies are increasingly shifting toward modular electronics, which allow easier repairs, part replacements, and device upgrades, significantly extending product life cycles. Government policies such as the EU’s “Right to Repair” directive have driven a 15% rise in demand for energy-efficient and recyclable appliances in 2024. This trend also encourages manufacturers to explore biodegradable materials, foldable and repair-friendly designs, and low-energy digital components.

Emerging markets like India are supporting this shift through incentives for green manufacturing and recycling technologies, enabling companies to introduce premium eco-friendly devices at competitive pricing. Integration with cloud-based storage solutions and connected platforms further enhances device usability. Overall, sustainability-driven innovation is strengthening product differentiation, reducing environmental impact, and unlocking long-term opportunities in the global consumer electronics market.

Category-wise Analysis

By Product Type Insights

The Smartphones & Mobile Devices segment remains the largest in the global consumer electronics market, holding an estimated 38% share in 2025. This leadership is driven by widespread use for communication, entertainment, and everyday productivity. High adoption rates in urban areas, supported by improvements in cameras, processors, and battery life, continue to strengthen demand. New launches like the iPhone 16 series with advanced AI features further boost growth. Affordable smartphones in emerging economies and expanding 5G connectivity ensure sustained market dominance.

By Distribution Channel Insights

Offline Retail leads the distribution channels with about 58% market share in 2025, mainly because consumers prefer seeing and testing electronics before buying. Physical stores offer product demonstrations, quick support, and immediate availability, which builds strong trust for high-value items like laptops and TVs. Around 70.6% of purchases still happen offline, especially in Asia Pacific. The segment stays strong through omnichannel models that combine in-store product trials with the convenience of online ordering, improving the overall shopping experience.

By End-user Insights

Residential Consumers dominate the end-user segment with around 72% market share in 2025, driven by rising adoption of smart and connected home devices. Households are increasingly investing in appliances, entertainment systems, and automation products that support remote work and digital lifestyles. Nearly 70% of new appliances now include smart features, encouraging higher spending on personal electronics. Growing urbanization and rising incomes further support this trend, making the residential segment essential for long-term market growth across global consumer electronics.

Regional Insights

North America Consumer Electronics Market Trends

North America continues to be a leading region in the global consumer electronics market, driven by strong demand for premium devices and rapid adoption of 5G and AI-enabled technologies. The U.S. contributes over 30% of global consumer electronics sales, supported by high purchasing power and preference for ecosystem-integrated products from leading brands like Apple, Samsung, and Google. Government initiatives from regulatory bodies such as the FCC encourage broadband expansion and strengthen the environment for IoT and smart home development.

By 2025, 5G subscriptions in the U.S. are expected to surpass 100 million, further advancing device adoption. Canada follows similar trends, with urban expansion and strong consumer interest in sustainable electronics contributing to a projected 4.67% CAGR through 2032. Domestic incentives for manufacturing and energy-efficient technologies help reduce supply chain pressures and support steady growth across the region.

Europe Consumer Electronics Market Trends

The European consumer electronics market is heavily influenced by the rising adoption of smart homes and strong regulatory frameworks promoting sustainability and safety. Millions of European households used smart home devices, driven by demand for energy-saving technologies aligned with EU environmental policies. Germany holds the largest share at 24.7%, supported by technological hubs in Munich and Berlin that drive innovation in wearables, robotics, and 5G appliances.

Harmonized standards such as CE marking enforce high product quality and compliance, supporting a projected 6.37% CAGR through 2032. The U.K. leads in adoption speed, driven by increasing smart lifestyle trends among younger consumers. France and Spain have also shown strong performance due to sustainable product initiatives and tourism-driven entertainment device demand. Europe’s strict focus on e-waste recycling continues to shape product development and market dynamics.

Asia Pacific Consumer Electronics Market Trends

Asia Pacific represents one of the fastest-growing regions in the global consumer electronics market, supported by strong manufacturing capabilities and rapidly rising consumer incomes. The region is expected to grow at 8.5% CAGR from 2025, driven primarily by China and India. China remains the largest market with over 1 billion internet users, boosting demand for smartphones, wearables, home automation devices, and IoT-enabled appliances. Its strong e-commerce ecosystem, including platforms like Alibaba, accelerates consumer adoption.

Japan focuses on premium electronics such as advanced displays, robotics, and high-precision devices. India is experiencing rapid expansion due to government incentives promoting local manufacturing, with the electronics market expected to reach US$150 billion by 2025. ASEAN countries, including Indonesia, Vietnam, and Thailand, are benefiting from urban growth and 5G rollout, increasing demand for affordable, feature-rich consumer devices across the region.

Competitive Landscape

The global consumer electronics market exhibits a moderately consolidated structure, with top players like Samsung, Apple, and LG holding significant shares through innovation and global distribution, yet fragmented by numerous regional competitors. Companies pursue expansion via R&D in AI and sustainability, with key differentiators including ecosystem integration and premium pricing. Emerging models like D2C emphasize direct consumer engagement, while partnerships for supply chain resilience address geopolitical risks.

Key Developments:

  • In September 2024, Apple launched the iPhone 16 series featuring the new A18 chip, advanced camera-control capabilities, a dedicated Action button, and significantly improved battery life to boost productivity and user engagement.
  • In August 2024, Samsung introduced the Galaxy Z Fold6 foldable phone, showcasing a more refined design, enhanced multitasking with a large flexible display and built-in Galaxy AI features aimed at tech-savvy productivity users.
  • In March 2025, LG Electronics expanded its OLED TV lineup with models powered by its Alpha 11 AI Processor Gen2, delivering AI-driven picture and sound enhancements for advanced home entertainment experiences.

Companies Covered in Consumer Electronics Market

  • Samsung Electronics Co. Ltd.
  • LG Electronics Co. Ltd.
  • Apple Inc.
  • Hitachi Ltd.
  • Koninklijke Philips N.V.
  • Sony Corporation
  • Hewlett-Packard Inc. (HP)
  • Toshiba Corporation
  • Panasonic Corporation
  • Canon Inc.
  • Dell Technologies
  • Lenovo
  • LG Electronics
  • Motorola Mobility LLC
  • Nikon
  • Xiaomi Corporation
  • Huawei Technologies Co. Ltd.
Frequently Asked Questions

The consumer electronics market is valued at US$ 762.6 Bn in 2026 and expected to reach US$ 1,139.1 Bn by 2033.

Key drivers include 5G rollout, IoT integration, and smart home adoption, enhancing connectivity and personalization.

Smartphones & Mobile Devices lead with 38% share, driven by essential daily use and tech advancements.

North America remains a leading region in the global consumer electronics market with 38% share, fueled by high demand for premium devices and fast adoption of 5G and AI technologies.

Edge AI in health wearables offers growth, with over 100 million users by 2025 for monitoring and personalization.

Major Players include Samsung Electronics, Apple Inc., LG Electronics, and Sony Corporation, focusing on innovation and ecosystems.

Global Consumer Electronics Market Report Scope
Report Attribute Details
Historical Data/Actuals 2020 – 2025
Forecast Period 2026 – 2033
Market Analysis Units Value: US$ Bn, Volume: Units
Geographical Coverage
  • North America
  • Europe
  • Asia Pacific
  • Latin America
  • Middle East & Africa
Segmental Coverage
  • By Product Type
  • By Distribution Channel
  • By End-user
Competitive Analysis
  • Samsung Electronics Co. Ltd.
  • LG Electronics Co. Ltd.
  • Apple Inc.
  • Hitachi Ltd.
  • Koninklijke Philips N.V.
  • Sony Corporation
  • Hewlett-Packard Inc. (HP)
  • Toshiba Corporation
  • Panasonic Corporation
  • Canon Inc.
  • Dell Technologies
  • Lenovo
  • LG Electronics
  • Motorola Mobility LLC
  • Nikon
  • Xiaomi Corporation
  • Huawei Technologies Co. Ltd.
Report Highlights
  • Market Forecast and Trends
  • Competitive Intelligence & Share Analysis
  • Growth Factors and Challenges
  • Strategic Growth Initiatives
  • Pricing Analysis
  • Future Opportunities and Revenue Pockets
  • Market Analysis Tools
Market Segmentation

By Product Type

  • Smartphones & Mobile Devices
  • Laptops & Tablets
  • Televisions & Display Devices
  • Audio & Video Equipment
  • Home Appliances
  • Cameras & Imaging Devices
  • Others

By Distribution Channel

  • Online Retail
  • Offline Retail
  • Direct-to-Consumer (D2C)
  • Wholesale / Distributors

By End-user

  • Residential Consumers
  • Commercial Users
  • Industrial & Corporate Users
  • Educational Institutions
  • Entertainment & Gaming Centers

Region

  • North America
  • Europe
  • Asia Pacific
  • Latin America
  • Middle East & Africa

Related Reports

  1. Executive Summary
    1. Global Consumer Electronics Market Snapshot 2026 and 2033
    2. Market Opportunity Assessment, 2026-2033, US$ Bn
    3. Key Market Trends
    4. Industry Developments and Key Market Events
    5. Demand Side and Supply Side Analysis
    6. PMR Analysis and Recommendations
  2. Market Overview
    1. Market Scope and Definitions
    2. Value Chain Analysis
    3. Macro-Economic Factors
      1. Global GDP Outlook
      2. Global Electrical Industry Overview
      3. Global Consumer Goods Industry Overview
    4. Forecast Factors – Relevance and Impact
    5. COVID-19 Impact Assessment
    6. PESTLE Analysis
    7. Porter's Five Forces Analysis
    8. Geopolitical Tensions: Market Impact
    9. Regulatory and Technology Landscape
  3. Market Dynamics
    1. Drivers
    2. Restraints
    3. Opportunities
    4. Trends
  4. Price Trend Analysis, 2020 – 2033
    1. Region-wise Price Analysis
    2. Price by Segments
    3. Price Impact Factors
  5. Global Consumer Electronics Market Outlook: Historical (2020 – 2025) and Forecast (2026 – 2033)
    1. Key Highlights
    2. Global Consumer Electronics Market Outlook: By Product Type
      1. Introduction/Key Findings
      2. Historical Market Size (US$ Bn) and Volume (Units) Analysis by By Product Type, 2020-2025
      3. Current Market Size (US$ Bn) and Volume (Units) Forecast, by By Product Type, 2026-2033
        1. Smartphones & Mobile Devices
        2. Laptops & Tablets
        3. Televisions & Display Devices
        4. Audio & Video Equipment
        5. Home Appliances
        6. Cameras & Imaging Devices
        7. Others
      4. Market Attractiveness Analysis: By Product Type
    3. Global Consumer Electronics Market Outlook: By Distribution Channel
      1. Introduction/Key Findings
      2. Historical Market Size (US$ Bn) and Volume (Units) Analysis by By Distribution Channel, 2020-2025
      3. Current Market Size (US$ Bn) and Volume (Units) Forecast, by By Distribution Channel, 2026-2033
        1. Online Retail
        2. Offline Retail
        3. Direct-to-Consumer (D2C)
        4. Wholesale / Distributors
      4. Market Attractiveness Analysis: By Distribution Channel
    4. Global Consumer Electronics Market Outlook: By End User
      1. Introduction/Key Findings
      2. Historical Market Size (US$ Bn) and Volume (Units) Analysis by By End User, 2020-2025
      3. Current Market Size (US$ Bn) and Volume (Units) Forecast, by By End User, 2026-2033
        1. Residential Consumers
        2. Commercial Users
        3. Industrial & Corporate Users
        4. Educational Institutions
        5. Entertainment & Gaming Centers
      4. Market Attractiveness Analysis: By End User
  6. Global Consumer Electronics Market Outlook: Region
    1. Key Highlights
    2. Historical Market Size (US$ Bn) and Volume (Units) Analysis by Region, 2020-2025
    3. Current Market Size (US$ Bn) and Volume (Units) Forecast, by Region, 2026-2033
      1. North America
      2. Europe
      3. East Asia
      4. South Asia & Oceania
      5. Latin America
      6. Middle East & Africa
    4. Market Attractiveness Analysis: Region
  7. North America Consumer Electronics Market Outlook: Historical (2020 – 2025) and Forecast (2026 – 2033)
    1. Key Highlights
    2. Pricing Analysis
    3. North America Market Size (US$ Bn) and Volume (Units) Forecast, by Country, 2026-2033
      1. U.S.
      2. Canada
    4. North America Market Size (US$ Bn) and Volume (Units) Forecast, by By Product Type, 2026-2033
      1. Smartphones & Mobile Devices
      2. Laptops & Tablets
      3. Televisions & Display Devices
      4. Audio & Video Equipment
      5. Home Appliances
      6. Cameras & Imaging Devices
      7. Others
    5. North America Market Size (US$ Bn) and Volume (Units) Forecast, by By Distribution Channel, 2026-2033
      1. Online Retail
      2. Offline Retail
      3. Direct-to-Consumer (D2C)
      4. Wholesale / Distributors
    6. North America Market Size (US$ Bn) and Volume (Units) Forecast, by By End User, 2026-2033
      1. Residential Consumers
      2. Commercial Users
      3. Industrial & Corporate Users
      4. Educational Institutions
      5. Entertainment & Gaming Centers
  8. Europe Consumer Electronics Market Outlook: Historical (2020 – 2025) and Forecast (2026 – 2033)
    1. Key Highlights
    2. Pricing Analysis
    3. Europe Market Size (US$ Bn) and Volume (Units) Forecast, by Country, 2026-2033
      1. Germany
      2. Italy
      3. France
      4. U.K.
      5. Spain
      6. Russia
      7. Rest of Europe
    4. Europe Market Size (US$ Bn) and Volume (Units) Forecast, by By Product Type, 2026-2033
      1. Smartphones & Mobile Devices
      2. Laptops & Tablets
      3. Televisions & Display Devices
      4. Audio & Video Equipment
      5. Home Appliances
      6. Cameras & Imaging Devices
      7. Others
    5. Europe Market Size (US$ Bn) and Volume (Units) Forecast, by By Distribution Channel, 2026-2033
      1. Online Retail
      2. Offline Retail
      3. Direct-to-Consumer (D2C)
      4. Wholesale / Distributors
    6. Europe Market Size (US$ Bn) and Volume (Units) Forecast, by By End User, 2026-2033
      1. Residential Consumers
      2. Commercial Users
      3. Industrial & Corporate Users
      4. Educational Institutions
      5. Entertainment & Gaming Centers
  9. East Asia Consumer Electronics Market Outlook: Historical (2020 – 2025) and Forecast (2026 – 2033)
    1. Key Highlights
    2. Pricing Analysis
    3. East Asia Market Size (US$ Bn) and Volume (Units) Forecast, by Country, 2026-2033
      1. China
      2. Japan
      3. South Korea
    4. East Asia Market Size (US$ Bn) and Volume (Units) Forecast, by By Product Type, 2026-2033
      1. Smartphones & Mobile Devices
      2. Laptops & Tablets
      3. Televisions & Display Devices
      4. Audio & Video Equipment
      5. Home Appliances
      6. Cameras & Imaging Devices
      7. Others
    5. East Asia Market Size (US$ Bn) and Volume (Units) Forecast, by By Distribution Channel, 2026-2033
      1. Online Retail
      2. Offline Retail
      3. Direct-to-Consumer (D2C)
      4. Wholesale / Distributors
    6. East Asia Market Size (US$ Bn) and Volume (Units) Forecast, by By End User, 2026-2033
      1. Residential Consumers
      2. Commercial Users
      3. Industrial & Corporate Users
      4. Educational Institutions
      5. Entertainment & Gaming Centers
  10. South Asia & Oceania Consumer Electronics Market Outlook: Historical (2020 – 2025) and Forecast (2026 – 2033)
    1. Key Highlights
    2. Pricing Analysis
    3. South Asia & Oceania Market Size (US$ Bn) and Volume (Units) Forecast, by Country, 2026-2033
      1. India
      2. Southeast Asia
      3. ANZ
      4. Rest of SAO
    4. South Asia & Oceania Market Size (US$ Bn) and Volume (Units) Forecast, by By Product Type, 2026-2033
      1. Smartphones & Mobile Devices
      2. Laptops & Tablets
      3. Televisions & Display Devices
      4. Audio & Video Equipment
      5. Home Appliances
      6. Cameras & Imaging Devices
      7. Others
    5. South Asia & Oceania Market Size (US$ Bn) and Volume (Units) Forecast, by By Distribution Channel, 2026-2033
      1. Online Retail
      2. Offline Retail
      3. Direct-to-Consumer (D2C)
      4. Wholesale / Distributors
    6. South Asia & Oceania Market Size (US$ Bn) and Volume (Units) Forecast, by By End User, 2026-2033
      1. Residential Consumers
      2. Commercial Users
      3. Industrial & Corporate Users
      4. Educational Institutions
      5. Entertainment & Gaming Centers
  11. Latin America Consumer Electronics Market Outlook: Historical (2020 – 2025) and Forecast (2026 – 2033)
    1. Key Highlights
    2. Pricing Analysis
    3. Latin America Market Size (US$ Bn) and Volume (Units) Forecast, by Country, 2026-2033
      1. Brazil
      2. Mexico
      3. Rest of LATAM
    4. Latin America Market Size (US$ Bn) and Volume (Units) Forecast, by By Product Type, 2026-2033
      1. Smartphones & Mobile Devices
      2. Laptops & Tablets
      3. Televisions & Display Devices
      4. Audio & Video Equipment
      5. Home Appliances
      6. Cameras & Imaging Devices
      7. Others
    5. Latin America Market Size (US$ Bn) and Volume (Units) Forecast, by By Distribution Channel, 2026-2033
      1. Online Retail
      2. Offline Retail
      3. Direct-to-Consumer (D2C)
      4. Wholesale / Distributors
    6. Latin America Market Size (US$ Bn) and Volume (Units) Forecast, by By End User, 2026-2033
      1. Residential Consumers
      2. Commercial Users
      3. Industrial & Corporate Users
      4. Educational Institutions
      5. Entertainment & Gaming Centers
  12. Middle East & Africa Consumer Electronics Market Outlook: Historical (2020 – 2025) and Forecast (2026 – 2033)
    1. Key Highlights
    2. Pricing Analysis
    3. Middle East & Africa Market Size (US$ Bn) and Volume (Units) Forecast, by Country, 2026-2033
      1. GCC Countries
      2. South Africa
      3. Northern Africa
      4. Rest of MEA
    4. Middle East & Africa Market Size (US$ Bn) and Volume (Units) Forecast, by By Product Type, 2026-2033
      1. Smartphones & Mobile Devices
      2. Laptops & Tablets
      3. Televisions & Display Devices
      4. Audio & Video Equipment
      5. Home Appliances
      6. Cameras & Imaging Devices
      7. Others
    5. Middle East & Africa Market Size (US$ Bn) and Volume (Units) Forecast, by By Distribution Channel, 2026-2033
      1. Online Retail
      2. Offline Retail
      3. Direct-to-Consumer (D2C)
      4. Wholesale / Distributors
    6. Middle East & Africa Market Size (US$ Bn) and Volume (Units) Forecast, by By End User, 2026-2033
      1. Residential Consumers
      2. Commercial Users
      3. Industrial & Corporate Users
      4. Educational Institutions
      5. Entertainment & Gaming Centers
  13. Competition Landscape
    1. Market Share Analysis, 2025
    2. Market Structure
      1. Competition Intensity Mapping
      2. Competition Dashboard
    3. Company Profiles
      1. Samsung Electronics Co. Ltd.
        1. Company Overview
        2. Product Portfolio/Offerings
        3. Key Financials
        4. SWOT Analysis
        5. Company Strategy and Key Developments
      2. LG Electronics Co. Ltd.
      3. Apple Inc.
      4. Hitachi Ltd.
      5. Koninklijke Philips N.V.
      6. Sony Corporation
      7. Hewlett-Packard Inc. (HP)
      8. Toshiba Corporation
      9. Panasonic Corporation
      10. Canon Inc.
      11. Dell Technologies
      12. Lenovo
      13. LG Electronics
      14. Motorola Mobility LLC
      15. Nikon
  14. Appendix
    1. Research Methodology
    2. Research Assumptions
    3. Acronyms and Abbreviations

Research Methodology Framework for Market Research Excellence

At Persistence Market Research, we implement a comprehensive, validated, and multi-dimensional approachto market analysis that delivers actionable insights across complex market landscapes. Our methodology combines the analytical rigor of leading consulting firms with innovative research techniques, ensuring robust market assessments that guide strategic decision-making with confidence.

Core Research Philosophy

Our methodology is built on four foundational pillars:

Research Philosophy Image

At Persistence Market Research, our methodology is designed to transcend conventional market studies by combining analytical rigor, multi-source validation, and future-focused insights.

We integrate advanced research frameworks, robust data collection strategies, cutting-edge analytics, and innovative technologies to deliver a 360-degree view of complex markets.

We integrate advanced research frameworks, robust data collection strategies, cutting-edge analytics, and innovative technologies to deliver a 360-degree view of complex markets.

Each stage spanning from strategic scoping and hypothesis-building to competitive intelligence, quality validation, and actionable recommendations is engineered to provide clients with unmatched clarity, precision, and confidence in decision-making.

By embedding innovation and technology at the core, our approach ensures that insights are not only comprehensive but also predictive, empowering businesses to seize opportunities, mitigate risks, and achieve sustainable growth

Research Philosophy Image

Capturing Key Information and Events

During this phase, key research objectives focus on essential information and data points for assessing the market, including:

Research Philosophy Image

TAM-SAM-SOM Framework Implementation

We employ both top-down and bottom-up approaches to ensure accurate market sizing.

Top-Down Market SizingBottom-Up Market Sizing
Universe Definition: Total global/regional market identificationUnit Economics: Average transaction values, purchase frequencies, customer lifecycle
Segmentation Filters: Geographic, demographic, and behavioral constraintsCustomer Segmentation: Detailed buyer persona development and sizing
Market Share Analysis: Competitive landscape assessment and share allocationPenetration Analysis: Market penetration rates by segment and geography
Growth Rate Application: Historical trends and forward-looking growth assumptionsScaling Methodology: Extrapolation techniques with confidence intervals

Validation & Cross-Verification

  • Triangulation: Comparing top-down and bottom-up results for consistency
  • Sensitivity Analysis: Testing key assumptions and parameter variations
  • Peer Benchmarking: Comparison with analogous markets and industry benchmarks
  • Expert Review: External validation through industry specialist consultation

Research Philosophy Image

Forecasting & Projection Modeling

Our proprietary forecasting models incorporate multiple variables and scenarios.

Forecasting Components

  • Historical Trend Analysis: 10-year historical growth patterns and cyclical variations
  • Driver-Based Modeling: Economic indicators, demographic shifts, technology adoption
  • Scenario Planning: Base case, optimistic, and conservative projections
  • Monte Carlo Simulations: Probability-weighted outcomes and risk assessments

Model Validation

  • Back-Testing: Historical accuracy assessment over 3–5-year periods
  • Cross-Validation: Multiple modeling approaches for result comparison
  • External Benchmarking: Comparison with established market forecasts
  • Continuous Calibration: Quarterly model updates based on new data

Comprehensive Data Collection Strategy

Our secondary research phase establishes a robust knowledge base utilizing diverse, credible sources.

Secondary Data Sourcess

  • Industry Publications & Reports
  • Government & Regulatory Data
  • Financial Intelligence (filings & reports)
  • Academic Research & Digital Intelligence

Quality Assurance Protocol

  • Source credibility assessment and publication date validation
  • Data consistency checks across multiple sources
  • Bias identification and neutralization techniques
  • Information gap tracking for primary research prioritization

Research Philosophy Image

Primary Research Excellence

Our primary research methodology employs best-in-class techniques to capture unique market insights.

Quantitative Research Methods

  • Large-Scale Surveys: Statistically representative samples with 95% confidence intervals
  • Survey Methodology: Multi-channel deployment (online, telephone, in-person)
  • Question Architecture and Response Optimization

Qualitative Research Methods

  • Executive Interviews
  • Focus Groups
  • Expert Consultations

Quality Assurance & Validation Framework

Multi-Stage Validation Process

  • Source Verification and Consistency Testing
  • Outlier Detection and Bias Assessment
  • Peer Review Process and External Validation
  • Sensitivity Analysis and Confidence Intervals

Research Philosophy Image

Methodology Validation & Credibility

Our research methodology has been extensively validated through:

  • Academic Partnerships: Collaborations with top-tier business schools and research institutions
  • Client Success Stories: Documented case studies demonstrating research impact and ROI
  • Continuous Benchmarking: Performance comparison with leading global research firms

This comprehensive methodology framework positions Persistence Market Research at the forefront of market intelligence, combining the analytical sophistication of top-tier consulting firms with innovative research techniques. Our approach ensures that every market assessment delivers precise, actionable, and strategically valuable insights that drive business success in competitive market environments.

Ready to unlock your market potential? Contact our research experts to discuss how our validated methodology can transform your strategic decision-making with data-driven market intelligence.

Copyright © 2026 Persistence Market Research. All Rights Reserved

Connect With Us -