Nano Bubble Generators Market Size, Share, and Growth Forecast 2026 - 2033

Nano Bubble Generators Market by Gas Type (Oxygen Nano Bubble Generators, Ozone Nano Bubble Generators, Air Nano Bubble Generators, Others), Technology Type (Hydrodynamic Cavitation Systems, Electrolytic Nano Bubble Generators, Ultrasonic Nano Bubble Generators, Others), Application, and Regional Analysis, 2026 - 2033

ID: PMRREP36135
Calendar

February 2026

188 Pages

Author : Sayali Mali

Nano Bubble Generators Market Size and Trend Analysis

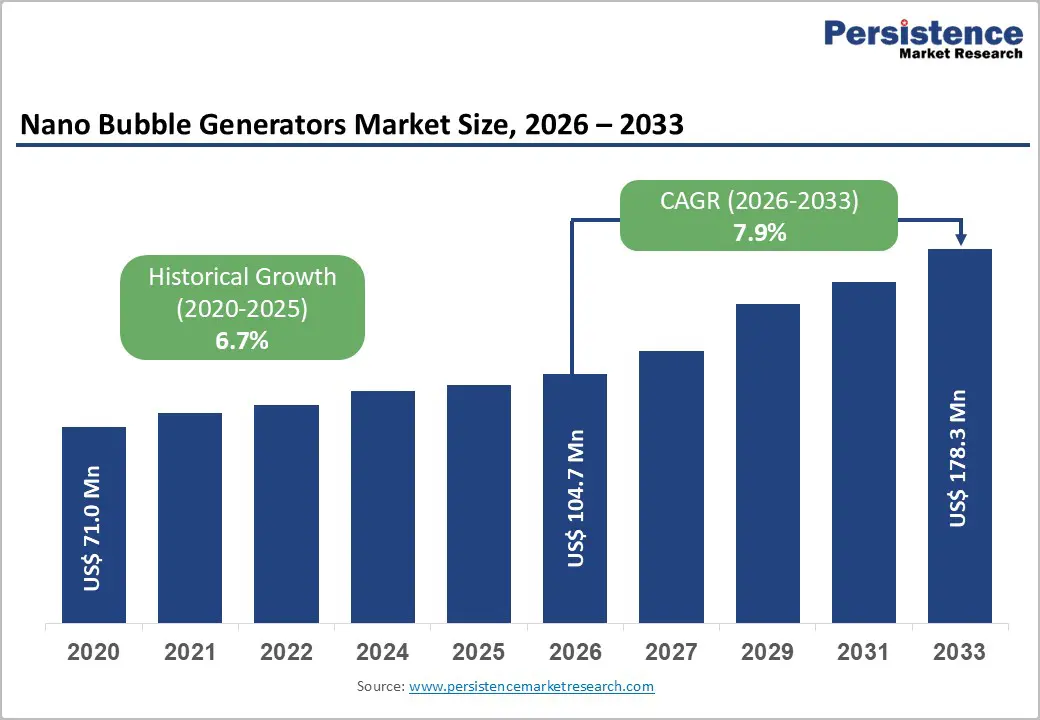
The global nano bubble generators market size is expected to be valued at US$ 104.7 million in 2026 and projected to reach US$ 178.3 million by 2033, growing at a CAGR of 7.9% between 2026 and 2033.

This growth is primarily driven by rising demand for sustainable water treatment technologies, as nano-bubbles enhance oxygen transfer and pollutant removal more efficiently than conventional methods. The expansion of aquaculture activities worldwide, particularly in leading fish-producing countries such as China and Norway, further supports adoption. Nano bubble aeration has been associated with significantly improved yields and healthier aquatic environments. Moreover, stringent environmental regulations and increasing global water scarcity are accelerating investments in energy-efficient nano bubble solutions.

Key Market highlights

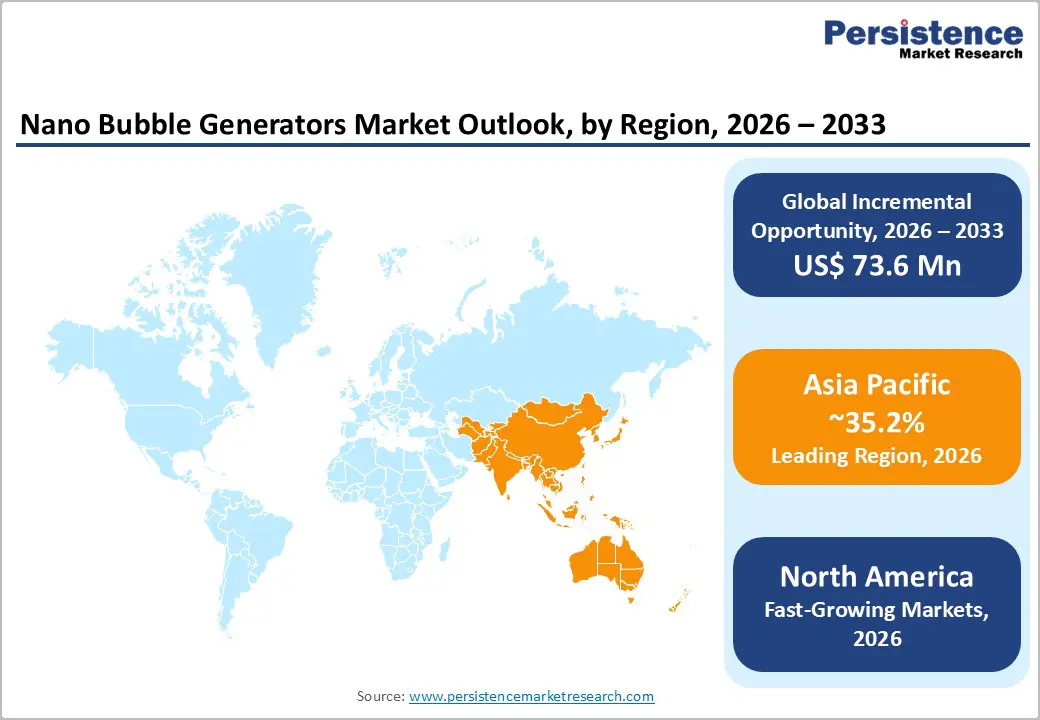
  • Leading Region: Asia Pacific dominates the market with 35.2% share in 2025, supported by strong manufacturing capacity and expanding aquaculture adoption.
  • Fastest-Growing Region: Europe is projected to grow at a strong 8.2% CAGR, driven by stringent wastewater reuse regulations and aquaculture innovation.
  • Leading Gas Type Category: Oxygen Nano Bubble Generators lead with a 45% share in 2025, driven by superior dissolved oxygen performance in aquaculture.
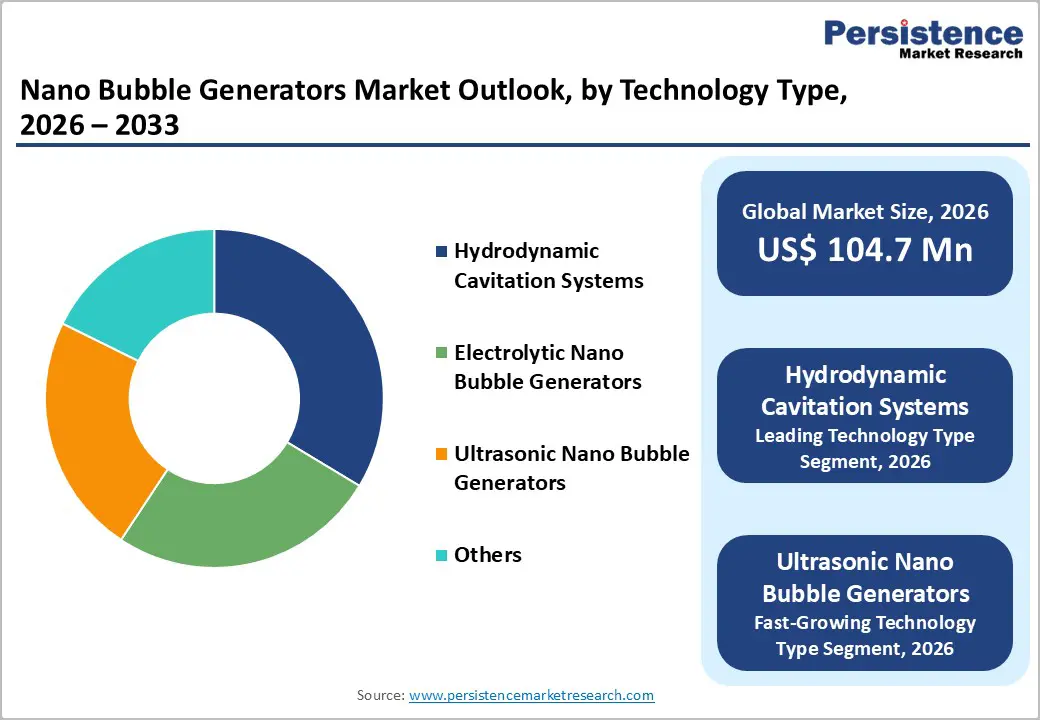
  • Leading Technology Category: Hydrodynamic Cavitation Systems command 40% share, favored for scalable, energy-efficient nano-bubble generation.
  • Key Growth Opportunity Area: Precision agriculture is emerging as a major opportunity, delivering up to 30% gains in irrigation efficiency in water-scarce regions.
Key Insights Details
Nano Bubble Generators Size (2026E) US$ 104.7 million
Market Value Forecast (2033F) US$ 178.3 million
Projected Growth CAGR (2026 - 2033) 7.9%
Historical Market Growth (2020 - 2025) 6.7%

nano-bubble-generators-market-size-2026–2033

Market Dynamics

Drivers - Expanding Aquaculture Industry Requiring Advanced Oxygenation Systems

Global aquaculture output surpassed 120 million tons in 2024 (FAO), driving strong demand for nano-bubble generators to maintain higher dissolved oxygen levels in intensive fish farming. Nano-bubbles remain suspended longer due to neutral buoyancy, thereby improving nutrient circulation and reducing fish mortality by up to 30% relative to conventional aerators. This enhanced efficiency is especially valuable in major aquaculture hubs such as China and Norway.

Additionally, nano-bubble aeration can lower energy consumption by nearly 50%, making it a cost-effective solution for large-scale operations. With rising global seafood consumption fueled by population growth and dietary shifts, farms increasingly adopt nano-bubble systems to improve yields, water quality, and sustainability.

Rising Need for Efficient and Sustainable Water Treatment Technologies

UNESCO estimates that 2.2 billion people still lack access to safely managed drinking water, prompting municipalities to adopt advanced treatment technologies such as nanobubble technology. Nano bubbles support advanced oxidation processes by generating free radicals that degrade contaminants such as VOCs more effectively, thereby reducing reliance on heavy chemical dosing. This aligns with EPA-driven sustainability goals in water infrastructure.

Moreover, nanobubbles exhibit 10–100 times higher mass-transfer efficiency due to their extremely large surface area. This improves disinfection performance, reduces sludge generation, and lowers operational costs for wastewater and drinking water utilities, making nano-bubble generators an increasingly attractive technology amid global water scarcity concerns.

Restraints - High Initial Capital Investments Limiting Adoption by Smaller Users

Nano bubble generators involve upfront costs 20–50% higher than conventional aerators, mainly due to specialized components such as cavitation nozzles and high-pressure pumps. This higher capital requirement often discourages small- and medium-scale aquaculture and industrial operators from adopting the technology. NIFA studies also highlight that maintenance of electrolytic systems, including electrode replacement and wear management, can increase annual operating expenses by 15–25%.

The lack of standardization across different nano-bubble technologies further complicates procurement and deployment, particularly in emerging markets. Without uniform performance benchmarks, companies face challenges in planning large-scale installations, thereby limiting adoption despite the long-term efficiency and sustainability benefits of nano-bubble systems.

Technical Scalability and Performance Challenges at Industrial Volumes

Consistently producing stable nano-bubbles at industrial-scale volumes remains a key technical challenge. Ultrasonic generation methods, while effective in labs, can consume up to twice as much energy as hydrodynamic systems, increasing operational costs. Moreover, variability in bubble size, ranging from 1 to 100 nanometers, can affect oxygen transfer efficiency and disinfection performance across diverse applications, including aquaculture, water treatment, and food processing.

These inconsistencies in performance and energy requirements slow large-scale deployment. Even with proven laboratory results, industries are cautious about investing in nano-bubble technology without assurances of consistent efficacy and cost-effectiveness under real-world, high-volume conditions.

Opportunity - Growing Opportunities in Precision Agriculture Through Enhanced Irrigation Efficiency

The expansion of precision agriculture presents significant opportunities for nano-bubble technology, as these systems improve irrigation efficiency by up to 30%, particularly in water-stressed regions such as India. USDA-funded trials demonstrate that nano bubbles enhance root oxygenation, promoting healthier plant growth and reducing fertilizer requirements by approximately 20%.

Additionally, the rise of hydroponic and controlled-environment farming is driving demand for ozone-based nanobubble generators, which help control pathogens without excessive chemical use. By improving water and nutrient utilization, nano-bubble systems align with sustainable agriculture initiatives and support farmers in maximizing yields while conserving resources.

Policy-Driven Opportunities in Wastewater Recycling and Industrial Treatment

Stringent wastewater recycling mandates, such as the EU Water Framework Directive, which requires 50% reuse by 2030, are creating opportunities for the adoption of nano-bubbles. These systems facilitate advanced oxidation and pollutant removal processes, achieving up to 99% contaminant elimination with lower chemical inputs.

Innovations like electric-field-based nano-bubble generators, exemplified by AquaB’s technology, allow industrial users, especially in the Asia Pacific, to meet regulatory standards while minimizing energy consumption. As governments increasingly promote water sustainability and energy-efficient treatment solutions, nano-bubble generators are becoming an attractive option for both municipal and industrial wastewater management.

Category-wise Analysis

Gas Type Insights

Oxygen nano bubble generators lead the market with a 45% share in 2025, driven by their superior solubility and ability to maintain dissolved oxygen (DO) levels above 8 mg/L in aquaculture. NIFA aquaponic trials show that they outperform conventional macro bubbles by a factor of 3. High adoption is fueled by improved fish health and reduced mortality, addressing oxygen deficits that cause 20-30% annual losses globally (FAO).

Ozone and air-based nano-bubble generators are emerging rapidly in applications such as pathogen control, water sterilization, and wastewater treatment. Their ability to generate reactive oxygen species without chemical reagents positions them as promising alternatives for sustainable aquaculture and industrial water management, thereby supporting disease reduction, water quality improvement, and energy-efficient operation.

Technology Type Insights

Hydrodynamic cavitation systems account for the largest share (40%) in 2025, owing to their energy efficiency and scalability. ScienceDirect reviews confirm that they use approximately 30% less power than ultrasonic methods while generating stable nanobubbles via pressure drops. Their reliability makes them dominant in industrial water treatment, municipal wastewater management, and large-scale aquaculture operations.

Ultrasonic and electrolysis-based nano-bubble technologies are emerging as the fastest-growing segments. Their precise control over bubble size and reactive gas generation allows specialized applications in laboratories, medical sterilization, and high-value food processing. Continuous innovation in these methods enhances versatility, enabling adoption across diverse industries where traditional cavitation systems may be less effective.

Application Insights

Aquaculture accounts for the largest application share at 35% in 2025, driven by nano bubbles’ ability to boost yields by 25-45% in systems such as Norway’s salmon farms. Enhanced dissolved oxygen levels, pathogen control, and improved wastewater management reduce disease outbreaks and increase survival rates, which are critical as global aquaculture output reaches 120 million tons.

Water treatment is the fastest-growing application, as nano-bubble systems enhance oxidation, pollutant degradation, and disinfection without heavy chemical use. Municipal and industrial facilities increasingly deploy these technologies for sustainable wastewater recycling, energy-efficient aeration, and advanced oxidation processes, thereby meeting stringent regulatory requirements and addressing global water scarcity.

nano-bubble-generators-market-outlook-by-technology-type-2026–2033

Regional Insights

North America Nano Bubble Generators Market Trends and Insights

North America holds a significant share of the global nano bubble generators market, with the U.S. leading adoption due to the EPA's endorsement of nano bubbles as non-chemical disinfectants. Municipal water treatment facilities increasingly integrate these systems in response to Clean Water Act updates, while companies like Moleaer drive innovation in oil & gas water recycling and industrial applications. California’s drought policies have also accelerated agricultural adoption, improving irrigation efficiency by up to 25% in almond farms through nano-bubble aeration trials.

Canada and Mexico are gradually adopting nano-bubble technology for aquaculture and wastewater management, thereby expanding regional deployment. Growing awareness of sustainable water management, coupled with R&D incentives and supportive state-level policies, positions North America as a strong, stable market, accounting for approximately 30.6% of the market.

Europe Nano Bubble Generators Market Trends and Insights

Europe is witnessing steady growth, with a projected CAGR of 8.2%, driven by environmental regulations and aquaculture initiatives. Germany and Norway lead in salmon and shellfish farming using nanobubble systems, supported by €10 million in EU funding for nanotechnology R&D under Horizon programs. The UK and France harmonize standards through REACH, encouraging wastewater recycling, while Spain’s hydroponics sector grows 15% annually, leveraging ozone-based generators to enhance greenhouse production in line with the Water Framework Directive.

The region’s emphasis on regulatory compliance, energy-efficient water treatment, and sustainable aquaculture drives adoption across multiple industries. Investments in R&D and pilot projects for industrial and municipal water applications are accelerating, solidifying Europe as a key growth region in the global nano bubble market.

Asia Pacific Nano Bubble Generators Market Trends and Insights

Asia-Pacific dominates the global market with an estimated 35.2% share, led by China’s manufacturing capacity and export dominance, which account for 60% of global nano bubble generators. Japan focuses on R&D, particularly in ultrasonic nanobubble technology, to advance precision water treatment and industrial cleaning applications. India’s NAMO scheme supports the adoption of agri-irrigation, with reported crop yield improvements of up to 30%, while ASEAN countries benefit from cost-effective hydrodynamic systems, supporting regional aquaculture growth at an approximately 10% CAGR (FAO).

Rapid industrialization, population growth, and rising seafood demand are driving adoption across aquaculture, agriculture, and municipal water treatment. Government incentives, technological innovation, and cost-effective solutions are strengthening the Asia-Pacific market, which is the largest regional contributor to global nano bubble generator deployment.

nano-bubble-generators-market-outlook-by-region-2026–2033

Competitive Landscape

The nano bubble generators market is highly fragmented, with numerous manufacturers competing across regions. Leading players focus on innovation through R&D collaborations and expanding their presence in key manufacturing hubs, particularly in Asia. Product differentiation is largely driven by energy efficiency, operational reliability, and adaptability to diverse applications, ranging from aquaculture to wastewater treatment.

Emerging models increasingly incorporate smart features, including IoT-enabled sensors for real-time monitoring, predictive maintenance, and remote control. Companies are also customizing solutions to meet specific industrial, agricultural, and municipal requirements, enhancing adoption in both established and emerging markets while responding to sustainability and efficiency demands.

Key Developments:

  • In July 2025, Moleaer unveiled a nanobubble process for thin films, enhancing battery efficiency and improving water filtration performance, marking a significant advancement in both energy storage and sustainable water treatment applications.
  • In December 2025, AquaB commissioned Vulcan-500 nano bubble generators at Saudi Aramco, enabling more sustainable oil recovery operations by improving water reuse, reducing chemical usage, and enhancing overall process efficiency in large-scale industrial applications.
  • In February 2025, Acniti expanded exports of its GaLF series nano bubble generators to over 50 countries, supporting aquaculture oxygenation, improving dissolved oxygen levels, and promoting healthier fish farming practices across international markets.

Companies Covered in Nano Bubble Generators Market

  • Moleaer Inc.
  • acniti LLC
  • Agrona B.V.
  • Nano Technical Center
  • Newman Technology
  • OxyDoser
  • NANOBBLE (Energenius Technologies Pvt Ltd)
  • Asuplus Nanobubble Technology
  • Pacific Water Technology
  • Qingdao Ozonier Purification Equipment Co., Ltd.
  • Holly Technology Co., Ltd.
  • Dino Purification
  • Rapid Water Technologies
  • Shanghai Mutao Environmental Technology Co., Ltd.
  • Nanobubble Systems Inc.
Frequently Asked Questions

The global nano bubble generators market is expected to reach US$ 104.7 million in 2026.

Rising aquaculture demand is driving adoption, with nano bubbles boosting yields by 25-45% through improved oxygenation.

Asia Pacific leads with 35.2% share in 2025, supported by strong manufacturing and aquaculture growth.

Precision agriculture offers a major opportunity, delivering up to 30% irrigation efficiency gains in water-scarce regions.

Leading players Moleaer Inc., acniti LLC, Agrona B.V., Nano Technical Center, and Newman Technology, focusing on sustainable innovations.

Nano Bubble Generators Market Report Scope
Report Attribute Details
Historical Data/Actuals 2020 - 2025
Forecast Period 2026 - 2033
Market Analysis Value: US$ Mn, Volume: As Applicable
Geographical Coverage
  • North America
  • Europe
  • Asia Pacific
  • Latin America
  • Middle East & Africa
Segmental Coverage
  • Gas Type
  • Technology Type
  • Application
  • Region
Competitive Analysis
  • Moleaer Inc.
  • acniti LLC
  • Agrona B.V.
  • Nano Technical Center
  • Newman Technology
  • OxyDoser
  • NANOBBLE (Energenius Technologies Pvt Ltd)
  • Asuplus Nanobubble Technology
  • Pacific Water Technology
  • Qingdao Ozonier Purification Equipment Co., Ltd.
  • Holly Technology Co., Ltd.
  • Dino Purification
  • Rapid Water Technologies
  • Shanghai Mutao Environmental Technology Co., Ltd.
  • Nanobubble Systems Inc.
Report Highlights
  • Market Forecast and Trends
  • Competitive Intelligence & Share Analysis
  • Growth Factors and Challenges
  • Strategic Growth Initiatives
  • Pricing Analysis
  • Future Opportunities and Revenue Pockets
  • Market Analysis Tools
Market Segmentation

By Gas Type

  • Oxygen Nano Bubble Generators
  • Ozone Nano Bubble Generators
  • Air Nano Bubble Generators
  • Others

By Technology Type

  • Hydrodynamic Cavitation Systems
  • Electrolytic Nano Bubble Generators
  • Ultrasonic Nano Bubble Generators
  • Others

By Application

  • Water & Wastewater Treatment
  • Agriculture & Irrigation
  • Aquaculture
  • Industrial Cleaning
  • Food & Beverage Processing
  • Others

By Region

  • North America
  • Europe
  • Asia Pacific
  • Latin America
  • Middle East & Africa

Related Reports

  1. Executive Summary
    1. Global Nano Bubble Generators Market Snapshot 2026 and 2033
    2. Market Opportunity Assessment, 2026-2033, US$ Mn
    3. Key Market Trends
    4. Industry Developments and Key Market Events
    5. Demand Side and Supply Side Analysis
    6. PMR Analysis and Recommendations
  2. Market Overview
    1. Market Scope and Definitions
    2. Market Dynamics
      1. Driver
      2. Restraint
      3. Opportunities
      4. Trends
    3. Macro-Economic Factors
      1. Global GDP Outlook
      2. Global Prison Growth Outlook
      3. Global Crime Rates by Country
      4. Global Prison Population by Country
      5. Global Private Prison Market Growth Outlook
      6. Other Macro-economic Factors
    4. Forecast Factors – Relevance and Impact
    5. COVID-19 Impact Assessment
  3. Value Added Insights
    1. Value Chain analysis
    2. Key Market Players
    3. Product Adoption Analysis
    4. Key Promotional Strategies by key players
    5. PESTLE Analysis
    6. Porter's Five Forces Analysis
    7. Regulatory and Technology Landscape
  4. Price Trend Analysis, 2025
    1. Region-wise Price Analysis
    2. Price by Segments
    3. Price Impact Factors
  5. Global Nano Bubble Generators Market Outlook: Historical (2020 – 2025) and Forecast (2026 – 2033)
    1. Key Highlights
    2. Global Nano Bubble Generators Market Outlook: Gas Type
      1. Introduction/Key Findings
      2. Historical Market Size (US$ Mn) and Volume (Units) Analysis by Gas Type, 2020-2025
      3. Current Market Size (US$ Mn) and Volume (Units) Forecast, by Gas Type, 2026-2033
        1. Oxygen Nano Bubble Generators
        2. Ozone Nano Bubble Generators
        3. Air Nano Bubble Generators
        4. Others
      4. Market Attractiveness Analysis: Gas Type
    3. Global Nano Bubble Generators Market Outlook: Technology Type
      1. Introduction/Key Findings
      2. Historical Market Size (US$ Mn) and Volume (Units) Analysis by Technology Type, 2020-2025
      3. Current Market Size (US$ Mn) and Volume (Units) Forecast, by Technology Type, 2026-2033
        1. Hydrodynamic Cavitation Systems
        2. Electrolytic Nano Bubble Generators
        3. Ultrasonic Nano Bubble Generators
        4. Others
      4. Market Attractiveness Analysis: Technology Type
    4. Global Nano Bubble Generators Market Outlook: Application
      1. Introduction/Key Findings
      2. Historical Market Size (US$ Mn) and Volume (Units) Analysis by Application , 2020-2025
      3. Current Market Size (US$ Mn) and Volume (Units) Forecast, by Application , 2026-2033
        1. Water & Wastewater Treatment
        2. Agriculture & Irrigation
        3. Aquaculture
        4. Industrial Cleaning
        5. Food & Beverage Processing
        6. Others
      4. Market Attractiveness Analysis: Application
  6. Global Nano Bubble Generators Market Outlook: Region
    1. Key Highlights
    2. Historical Market Size (US$ Mn) and Volume (Units) Analysis by Region, 2020-2025
    3. Current Market Size (US$ Mn) and Volume (Units) Forecast, by Region, 2026-2033
      1. North America
      2. Europe
      3. East Asia
      4. South Asia & Oceania
      5. Latin America
      6. Middle East & Africa
    4. Market Attractiveness Analysis: Region
  7. North America Nano Bubble Generators Market Outlook: Historical (2020 – 2025) and Forecast (2026 – 2033)
    1. Key Highlights
    2. Pricing Analysis
    3. North America Market Size (US$ Mn) and Volume (Units) Forecast, by Country, 2026-2033
      1. U.S.
      2. Canada
    4. North America Market Size (US$ Mn) and Volume (Units) Forecast, by Gas Type, 2026-2033
      1. Oxygen Nano Bubble Generators
      2. Ozone Nano Bubble Generators
      3. Air Nano Bubble Generators
      4. Others
    5. North America Market Size (US$ Mn) and Volume (Units) Forecast, by Technology Type, 2026-2033
      1. Hydrodynamic Cavitation Systems
      2. Electrolytic Nano Bubble Generators
      3. Ultrasonic Nano Bubble Generators
      4. Others
    6. North America Market Size (US$ Mn) and Volume (Units) Forecast, by Application , 2026-2033
      1. Water & Wastewater Treatment
      2. Agriculture & Irrigation
      3. Aquaculture
      4. Industrial Cleaning
      5. Food & Beverage Processing
      6. Others
  8. Europe Nano Bubble Generators Market Outlook: Historical (2020 – 2025) and Forecast (2026 – 2033)
    1. Key Highlights
    2. Pricing Analysis
    3. Europe Market Size (US$ Mn) and Volume (Units) Forecast, by Country, 2026-2033
      1. Germany
      2. Italy
      3. France
      4. U.K.
      5. Spain
      6. Russia
      7. Rest of Europe
    4. Europe Market Size (US$ Mn) and Volume (Units) Forecast, by Gas Type, 2026-2033
      1. Oxygen Nano Bubble Generators
      2. Ozone Nano Bubble Generators
      3. Air Nano Bubble Generators
      4. Others
    5. Europe Market Size (US$ Mn) and Volume (Units) Forecast, by Technology Type, 2026-2033
      1. Hydrodynamic Cavitation Systems
      2. Electrolytic Nano Bubble Generators
      3. Ultrasonic Nano Bubble Generators
      4. Others
    6. Europe Market Size (US$ Mn) and Volume (Units) Forecast, by Application , 2026-2033
      1. Water & Wastewater Treatment
      2. Agriculture & Irrigation
      3. Aquaculture
      4. Industrial Cleaning
      5. Food & Beverage Processing
      6. Others
  9. East Asia Nano Bubble Generators Market Outlook: Historical (2020 – 2025) and Forecast (2026 – 2033)
    1. Key Highlights
    2. Pricing Analysis
    3. East Asia Market Size (US$ Mn) and Volume (Units) Forecast, by Country, 2026-2033
      1. China
      2. Japan
      3. South Korea
    4. East Asia Market Size (US$ Mn) and Volume (Units) Forecast, by Gas Type, 2026-2033
      1. Oxygen Nano Bubble Generators
      2. Ozone Nano Bubble Generators
      3. Air Nano Bubble Generators
      4. Others
    5. East Asia Market Size (US$ Mn) and Volume (Units) Forecast, by Technology Type, 2026-2033
      1. Hydrodynamic Cavitation Systems
      2. Electrolytic Nano Bubble Generators
      3. Ultrasonic Nano Bubble Generators
      4. Others
    6. East Asia Market Size (US$ Mn) and Volume (Units) Forecast, by Application , 2026-2033
      1. Water & Wastewater Treatment
      2. Agriculture & Irrigation
      3. Aquaculture
      4. Industrial Cleaning
      5. Food & Beverage Processing
      6. Others
  10. South Asia & Oceania Nano Bubble Generators Market Outlook: Historical (2020 – 2025) and Forecast (2026 – 2033)
    1. Key Highlights
    2. Pricing Analysis
    3. South Asia & Oceania Market Size (US$ Mn) and Volume (Units) Forecast, by Country, 2026-2033
      1. India
      2. Southeast Asia
      3. ANZ
      4. Rest of SAO
    4. South Asia & Oceania Market Size (US$ Mn) and Volume (Units) Forecast, by Gas Type, 2026-2033
      1. Oxygen Nano Bubble Generators
      2. Ozone Nano Bubble Generators
      3. Air Nano Bubble Generators
      4. Others
    5. South Asia & Oceania Market Size (US$ Mn) and Volume (Units) Forecast, by Technology Type, 2026-2033
      1. Hydrodynamic Cavitation Systems
      2. Electrolytic Nano Bubble Generators
      3. Ultrasonic Nano Bubble Generators
      4. Others
    6. South Asia & Oceania Market Size (US$ Mn) and Volume (Units) Forecast, by Application , 2026-2033
      1. Water & Wastewater Treatment
      2. Agriculture & Irrigation
      3. Aquaculture
      4. Industrial Cleaning
      5. Food & Beverage Processing
      6. Others
  11. Latin America Nano Bubble Generators Market Outlook: Historical (2020 – 2025) and Forecast (2026 – 2033)
    1. Key Highlights
    2. Pricing Analysis
    3. Latin America Market Size (US$ Mn) and Volume (Units) Forecast, by Country, 2026-2033
      1. Brazil
      2. Mexico
      3. Rest of LATAM
    4. Latin America Market Size (US$ Mn) and Volume (Units) Forecast, by Gas Type, 2026-2033
      1. Oxygen Nano Bubble Generators
      2. Ozone Nano Bubble Generators
      3. Air Nano Bubble Generators
      4. Others
    5. Latin America Market Size (US$ Mn) and Volume (Units) Forecast, by Technology Type, 2026-2033
      1. Hydrodynamic Cavitation Systems
      2. Electrolytic Nano Bubble Generators
      3. Ultrasonic Nano Bubble Generators
      4. Others
    6. Latin America Market Size (US$ Mn) and Volume (Units) Forecast, by Application , 2026-2033
      1. Water & Wastewater Treatment
      2. Agriculture & Irrigation
      3. Aquaculture
      4. Industrial Cleaning
      5. Food & Beverage Processing
  12. OthersMiddle East & Africa Nano Bubble Generators Market Outlook: Historical (2020 – 2025) and Forecast (2026 – 2033)
    1. Key Highlights
    2. Pricing Analysis
    3. Middle East & Africa Market Size (US$ Mn) and Volume (Units) Forecast, by Country, 2026-2033
      1. GCC Countries
      2. South Africa
      3. Northern Africa
      4. Rest of MEA
    4. Middle East & Africa Market Size (US$ Mn) and Volume (Units) Forecast, by Gas Type, 2026-2033
      1. Oxygen Nano Bubble Generators
      2. Ozone Nano Bubble Generators
      3. Air Nano Bubble Generators
      4. Others
    5. Middle East & Africa Market Size (US$ Mn) and Volume (Units) Forecast, by Technology Type, 2026-2033
      1. Hydrodynamic Cavitation Systems
      2. Electrolytic Nano Bubble Generators
      3. Ultrasonic Nano Bubble Generators
      4. Others
    6. Middle East & Africa Market Size (US$ Mn) and Volume (Units) Forecast, by Application , 2026-2033
      1. Water & Wastewater Treatment
      2. Agriculture & Irrigation
      3. Aquaculture
      4. Industrial Cleaning
      5. Food & Beverage Processing
      6. Others
  13. Competition Landscape
    1. Market Share Analysis, 2025
    2. Market Structure
      1. Competition Intensity Mapping
      2. Competition Dashboard
    3. Company Profiles
      1. Moleaer Inc.
        1. Company Overview
        2. Product Portfolio/Offerings
        3. Key Financials
        4. SWOT Analysis
        5. Company Strategy and Key Developments
      2. acniti LLC
      3. Agrona B.V.
      4. Nano Technical Center
      5. Newman Technology
      6. OxyDoser
      7. NANOBBLE (Energenius Technologies Pvt Ltd)
      8. Asuplus Nanobubble Technology
      9. Pacific Water Technology
      10. Qingdao Ozonier Purification Equipment Co., Ltd.
      11. Holly Technology Co., Ltd.
      12. Dino Purification
      13. Rapid Water Technologies
      14. Shanghai Mutao Environmental Technology Co., Ltd.
      15. Nanobubble Systems Inc.
  14. Appendix
    1. Research Methodology
    2. Research Assumptions
    3. Acronyms and Abbreviations

Research Methodology Framework for Market Research Excellence

At Persistence Market Research, we implement a comprehensive, validated, and multi-dimensional approachto market analysis that delivers actionable insights across complex market landscapes. Our methodology combines the analytical rigor of leading consulting firms with innovative research techniques, ensuring robust market assessments that guide strategic decision-making with confidence.

Core Research Philosophy

Our methodology is built on four foundational pillars:

Research Philosophy Image

At Persistence Market Research, our methodology is designed to transcend conventional market studies by combining analytical rigor, multi-source validation, and future-focused insights.

We integrate advanced research frameworks, robust data collection strategies, cutting-edge analytics, and innovative technologies to deliver a 360-degree view of complex markets.

We integrate advanced research frameworks, robust data collection strategies, cutting-edge analytics, and innovative technologies to deliver a 360-degree view of complex markets.

Each stage spanning from strategic scoping and hypothesis-building to competitive intelligence, quality validation, and actionable recommendations is engineered to provide clients with unmatched clarity, precision, and confidence in decision-making.

By embedding innovation and technology at the core, our approach ensures that insights are not only comprehensive but also predictive, empowering businesses to seize opportunities, mitigate risks, and achieve sustainable growth

Research Philosophy Image

Capturing Key Information and Events

During this phase, key research objectives focus on essential information and data points for assessing the market, including:

Research Philosophy Image

TAM-SAM-SOM Framework Implementation

We employ both top-down and bottom-up approaches to ensure accurate market sizing.

Top-Down Market SizingBottom-Up Market Sizing
Universe Definition: Total global/regional market identificationUnit Economics: Average transaction values, purchase frequencies, customer lifecycle
Segmentation Filters: Geographic, demographic, and behavioral constraintsCustomer Segmentation: Detailed buyer persona development and sizing
Market Share Analysis: Competitive landscape assessment and share allocationPenetration Analysis: Market penetration rates by segment and geography
Growth Rate Application: Historical trends and forward-looking growth assumptionsScaling Methodology: Extrapolation techniques with confidence intervals

Validation & Cross-Verification

  • Triangulation: Comparing top-down and bottom-up results for consistency
  • Sensitivity Analysis: Testing key assumptions and parameter variations
  • Peer Benchmarking: Comparison with analogous markets and industry benchmarks
  • Expert Review: External validation through industry specialist consultation

Research Philosophy Image

Forecasting & Projection Modeling

Our proprietary forecasting models incorporate multiple variables and scenarios.

Forecasting Components

  • Historical Trend Analysis: 10-year historical growth patterns and cyclical variations
  • Driver-Based Modeling: Economic indicators, demographic shifts, technology adoption
  • Scenario Planning: Base case, optimistic, and conservative projections
  • Monte Carlo Simulations: Probability-weighted outcomes and risk assessments

Model Validation

  • Back-Testing: Historical accuracy assessment over 3–5-year periods
  • Cross-Validation: Multiple modeling approaches for result comparison
  • External Benchmarking: Comparison with established market forecasts
  • Continuous Calibration: Quarterly model updates based on new data

Comprehensive Data Collection Strategy

Our secondary research phase establishes a robust knowledge base utilizing diverse, credible sources.

Secondary Data Sourcess

  • Industry Publications & Reports
  • Government & Regulatory Data
  • Financial Intelligence (filings & reports)
  • Academic Research & Digital Intelligence

Quality Assurance Protocol

  • Source credibility assessment and publication date validation
  • Data consistency checks across multiple sources
  • Bias identification and neutralization techniques
  • Information gap tracking for primary research prioritization

Research Philosophy Image

Primary Research Excellence

Our primary research methodology employs best-in-class techniques to capture unique market insights.

Quantitative Research Methods

  • Large-Scale Surveys: Statistically representative samples with 95% confidence intervals
  • Survey Methodology: Multi-channel deployment (online, telephone, in-person)
  • Question Architecture and Response Optimization

Qualitative Research Methods

  • Executive Interviews
  • Focus Groups
  • Expert Consultations

Quality Assurance & Validation Framework

Multi-Stage Validation Process

  • Source Verification and Consistency Testing
  • Outlier Detection and Bias Assessment
  • Peer Review Process and External Validation
  • Sensitivity Analysis and Confidence Intervals

Research Philosophy Image

Methodology Validation & Credibility

Our research methodology has been extensively validated through:

  • Academic Partnerships: Collaborations with top-tier business schools and research institutions
  • Client Success Stories: Documented case studies demonstrating research impact and ROI
  • Continuous Benchmarking: Performance comparison with leading global research firms

This comprehensive methodology framework positions Persistence Market Research at the forefront of market intelligence, combining the analytical sophistication of top-tier consulting firms with innovative research techniques. Our approach ensures that every market assessment delivers precise, actionable, and strategically valuable insights that drive business success in competitive market environments.

Ready to unlock your market potential? Contact our research experts to discuss how our validated methodology can transform your strategic decision-making with data-driven market intelligence.

Copyright © 2026 Persistence Market Research. All Rights Reserved

Connect With Us -