


- Marine
- Marine Propulsion Engine Market
Marine Propulsion Engine Market Size, Share, and Growth Forecast, 2026- 2033
Marine Propulsion Engine Market by Power Range (Above 20,000 HP 10,001-20,000 HP, Upto 1,000 HP, 1,001-5,000 HP, and 5,001-10,000 HP), By Fuel Type (Diesel, Heavy Fuel Oil, Natural Gas, and Other Fuels), By Application (Commercial, Defense, and Passenger), and Regional Analysis for 2026 - 2033
Marine Propulsion Engine Market Size and Trends Analysis
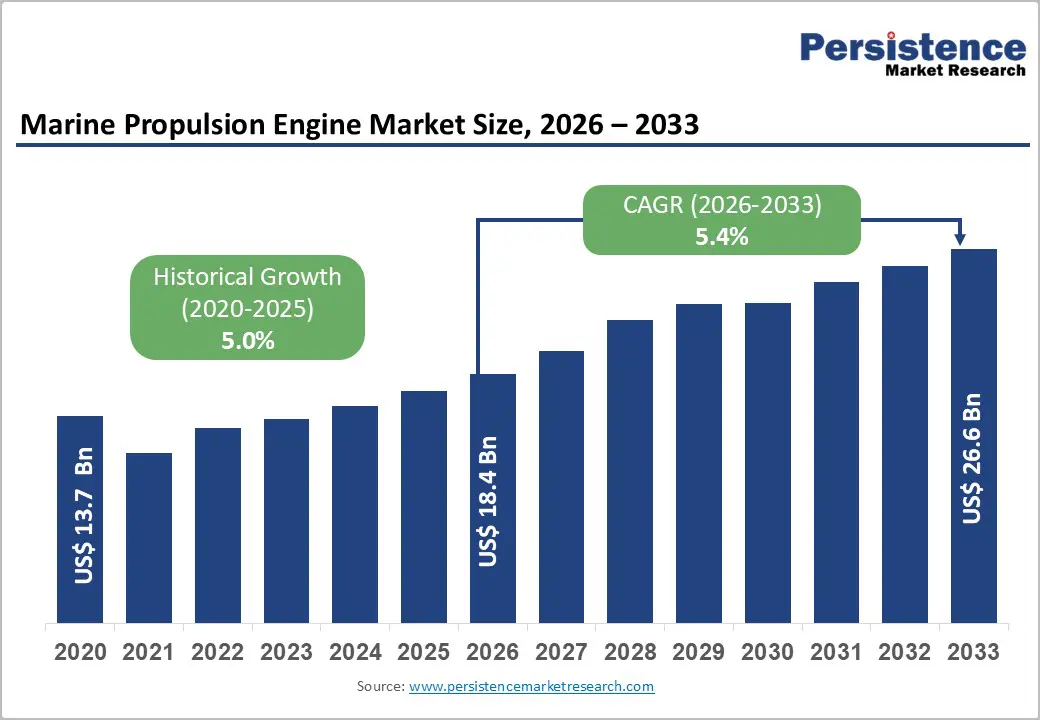
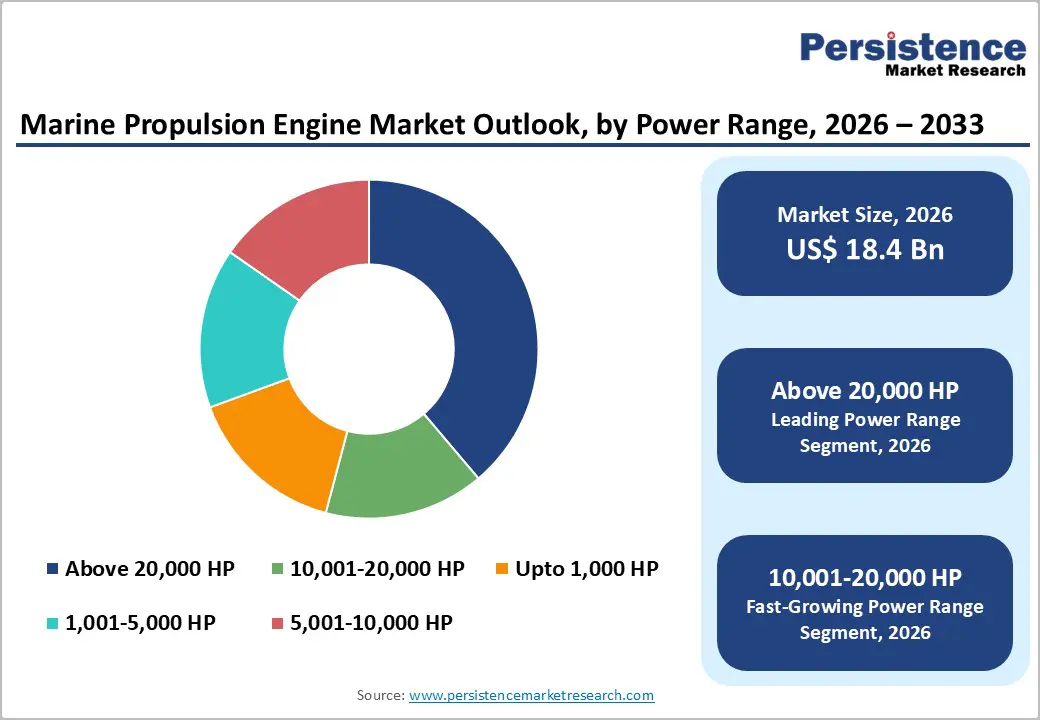
The global marine propulsion engine market size is likely to be valued at US$ 18.4 billion in 2026 and is projected to reach US$ 26.6 billion by 2033, growing at a CAGR of 5.4% during the forecast period (2026 - 2033).
This substantial growth trajectory reflects the maritime industry's transformation driven by the rise in international seaborne trade, stringent environmental regulations mandating decarbonization, and accelerating technological innovations in propulsion systems. The market demonstrates resilience supported by the recovery of global shipping post-pandemic, increased investment in fleet modernization, and the strategic pivot toward fuel-efficient and low-emission engines. Rising demand from commercial shipping applications, coupled with emerging opportunities in defense and passenger vessel segments, positions the marine propulsion engine market as a critical component of maritime infrastructure development globally.
Key Industry Highlights:
- Dominant Power Range Segment: The Above 20,000 HP segment commands over 30% revenue share, driven by ultra-large container ship construction (15,000-20,000+ TEU capacity) and major bulk carrier fleet expansion. The fastest-growing power range is 10,001-20,000 HP with 6.2% CAGR, reflecting medium-sized vessel construction and retrofit market expansion in emerging maritime corridors.
- Diesel Engine Market Leadership and Alternative Fuel Growth: Diesel propulsion engines represent over 70% revenue share, reinforced by global fuel infrastructure, mature technology reliability, and cost-effective operation. Heavy fuel oil propulsion is the fastest-growing fuel type at 6.5% CAGR, supported by environmental compliance technologies and retrofit opportunities on existing fleet.
- Commercial Shipping Dominance and Defense Sector Acceleration: Commercial shipping applications command over 40% revenue share, reflecting fundamental global trade dependency on maritime transportation. The defense application segment demonstrates fastest growth at 6.6% CAGR, driven by geopolitical tensions and sustained naval modernization programs across multiple regions.
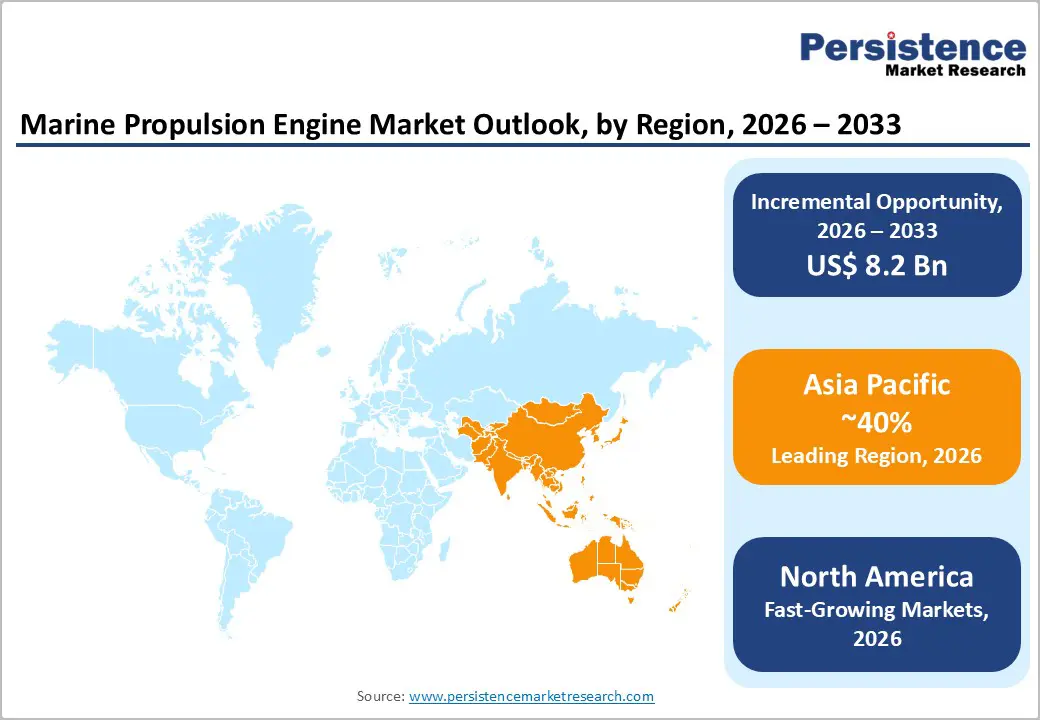
- Asia Pacific Regional Leadership with North America Acceleration: Asia Pacific dominates with over 40% global market share, supported by dominant shipbuilding concentration in China, Japan, and South Korea. North America demonstrates accelerated growth at 6.3% CAGR, substantially exceeding global average, driven by U.S. naval modernization and offshore energy development.
- Emerging Alternative Propulsion Technology Opportunities: LNG dual-fuel propulsion represents the fastest-growing fuel segment at 6.5% CAGR, with natural gas-powered vessels expanding from the current 8-12% market penetration toward 25-30% by 2035. Hybrid and fuel cell propulsion systems demonstrate 12-15% annual growth, positioning emerging technologies as the primary long-term growth drivers and strategic opportunity concentration for propulsion manufacturers through 2033 - 2050.
| Key Insights | Details |
|---|---|
| Marine Propulsion Engine Market Size (2026E) | US$ 18.4 Bn |
| Market Value Forecast (2033F) | US$ 26.6 Bn |
| Projected Growth (CAGR 2026 to 2033) | 5.4% |
| Historical Market Growth (CAGR 2020 to 2025) | 5.0% |
Market Dynamics
Drivers - Rise in International Seaborne Trade and Fleet Expansion
Global maritime commerce continues its upward trajectory, with the United Nations Conference on Trade and Development confirming that international shipping accounts for approximately 80% of world trade by volume and 70% by revenue. This extraordinary dependency on maritime transport drives persistent demand for new vessel construction and fleet modernization. The expansion of containerized cargo routes, growth in tanker demand for petroleum products and liquefied natural gas (LNG), and increasing bulk carrier deployments collectively stimulate demand for advanced marine propulsion engines. Developing economies in the Asia Pacific and Southeast Asia are experiencing accelerated industrialization, generating substantial cargo volumes requiring efficient maritime transportation. Consequently, shipyards across China, South Korea, and Japan are operating at elevated capacity utilization rates, directly translating to heightened procurement of marine engines. The commercial shipping segment, accounting for above 40% of market revenue share, represents the dominant application driver, with container shipping alone requiring sophisticated propulsion systems capable of maintaining operational efficiency across diverse maritime routes and weather conditions.
Restraint - High Capital Requirements and Extended Development Timelines
The marine propulsion engine industry exhibits structural barriers to entry characterized by substantial research and development expenditure requirements, protracted engine certification and validation processes, and significant manufacturing infrastructure investments. New engine development programs typically require 3-5 years of intensive R&D, combined with comprehensive testing protocols and regulatory approvals from classification societies, including DNV GL, Lloyd's Register, and the American Bureau of Shipping (ABS). These extended timelines create competitive advantages for incumbent manufacturers while constraining new market entrants and limiting supply-side competition. The capital intensity of manufacturing facilities, specialized testing infrastructure, and after-sales service networks necessitates substantial financial commitment, effectively restricting market participation to well-capitalized global players. Cost overruns in development programs or delays in regulatory approval can significantly impact financial returns, creating risk aversion among potential market participants and limiting innovation velocity within the competitive landscape.
Opportunities - Defense Sector Modernization and Naval Vessel Expansion Programs
The defense application segment, currently accounting for a smaller revenue share but demonstrating the fastest growth trajectory at 6.6% CAGR through 2033, represents a concentrated opportunity within geopolitically sensitive maritime regions. Elevated geopolitical tensions, particularly in the South China Sea, Indo-Pacific region, and Eastern European maritime zones, are driving sustained military modernization investments in advanced naval vessel fleets. Navies worldwide are prioritizing multi-mission frigate construction, advanced destroyer development, and littoral combat ship deployment, all requiring sophisticated propulsion systems balancing power requirements, operational flexibility, and long-range endurance.
The U.S. Navy's sustained modernization programs, European naval expansion initiatives, and emerging market navy expansion in India, Japan, and Southeast Asian nations collectively represent a substantial defense procurement opportunity. Advanced propulsion technologies including integrated power systems, hybrid diesel-electric configurations, and fuel cell systems for stealth operation, are achieving accelerated adoption in military vessel construction. Defense budgets, characterized by longer-term commitments and lower price sensitivity compared to commercial shipping, provide stable revenue streams and support premium pricing for advanced propulsion systems. The defense segment opportunity is estimated at US$ 1.5-2 billion through 2033, with particular concentration in Asia Pacific naval modernization programs.
Marine Propulsion Engine Market Insights and Trends
Power Range Insights
High-Power Marine Propulsion Engines Drive Efficiency, Fleet Modernization, and Regional Trade Growth
The marine propulsion engine market shows clear differentiation by power range, with distinct demand drivers shaping segment performance. The above 20,000 HP segment leads the market, accounting for over 30% of total revenue, as it serves large ocean-going vessels such as mega container ships, bulk carriers, and LNG carriers. These engines, predominantly based on slow-speed diesel technology, are optimized for long-haul intercontinental operations, offering superior fuel efficiency and extended operational endurance. Strong order backlogs for vessels exceeding 15,000 TEU underline the segment’s stability. Continuous advancements in turbocharging, fuel injection, and combustion control have delivered 3-5% fuel efficiency improvements, directly lowering total cost of ownership. Mature standards and large-scale production further support competitive pricing while preserving manufacturer margins.
In contrast, the 10,001-20,000 HP segment represents the fastest-growing category, expanding at a CAGR of 6.2% through 2033. Growth is driven by rising demand for medium-sized vessels supporting regional trade, offshore operations, and emerging maritime corridors. Strong activity in Asia Pacific regional shipping, combined with retrofitting and repowering needs for aging fleets, is accelerating adoption. Modular engine designs and technology transfer from higher-power platforms are enhancing performance, flexibility, and cost efficiency, strengthening this segment’s growth trajectory.
Fuel Type Insights
Diesel Dominance and HFO Growth Reshape Marine Propulsion Fuel Dynamics Globally
Diesel-powered marine propulsion engines continue to dominate the global market, accounting for over 70% of total revenue and retaining a clear leadership position despite the emergence of alternative fuel technologies. This dominance is underpinned by several structural advantages, including the widespread availability of marine diesel infrastructure, proven and mature engine technology, consistent performance, and a long-standing reliability record across varied maritime conditions. With a global installed base exceeding 90,000 diesel-powered vessels, strong path dependency further reinforces diesel’s market position. Continuous technological advancements-such as improved combustion chamber designs, piezo-electric fuel injection, variable valve timing, and selective catalytic reduction systems-enable modern diesel engines to meet stringent emission regulations while delivering high thermal efficiency. OEM strategies focus on enhancing reliability, extending maintenance intervals, and optimizing lifecycle costs, aligning well with the operational priorities of risk-averse shipping operators.
In contrast, heavy fuel oil (HFO) engines represent the fastest-growing fuel segment, expanding at a CAGR of 6.5% through 2033. Growth is driven primarily by fuel cost economics and compliance strategies following IMO 2020 regulations. The adoption of exhaust gas scrubbers allows HFO-powered vessels to meet sulfur limits while preserving cost advantages on long-haul routes. Additionally, the development of hybrid HFO-LNG dual-fuel systems provides operational flexibility, supporting HFO adoption in cost-sensitive maritime applications where total cost of ownership remains the decisive factor.
Commercial Shipping Dominance and Defense Modernization Shape Global Marine Propulsion Demand
Application analysis indicates a clear divergence between market leadership and growth momentum across end-use segments. Commercial shipping remains the dominant application, accounting for over 40% of total market revenue and serving as the core demand driver for marine propulsion engine procurement. This segment spans a wide range of vessel categories, including container ships supporting global trade routes, bulk carriers transporting dry commodities, tankers handling petroleum and chemical cargoes, general cargo vessels, and specialized ships such as reefers and heavy-lift vessels. Its dominance is underpinned by the fundamental economics of maritime transport, which offers unmatched cost efficiency for large-scale and long-distance cargo movement. Commercial shipping also attracts the highest R&D investments, as operators prioritize fuel efficiency, emissions compliance, operational reliability, and lifecycle cost optimization. International and regional regulations, particularly IMO-led environmental standards, further reinforce technology adoption and standardization across this segment.
In contrast, the defense segment represents the fastest-growing application, expanding at a CAGR of 6.6% through 2033. Accelerating naval modernization programs across the Indo-Pacific, Europe, and emerging economies are driving demand for advanced propulsion systems. Programs led by organizations such as the United States Navy and the Indian Navy emphasize integrated power systems, stealth, endurance, and high reliability. Defense applications command premium pricing due to stringent performance specifications and long-term government-backed procurement, creating structurally resilient growth independent of commercial shipping cycles.
Regional Insights and Trends
Asia Pacific Dominance Driven by Shipbuilding Concentration, LNG Leadership, and Regulatory Alignment
The Asia Pacific region stands as the global leader in the marine propulsion engine market, accounting for over 40% of total revenue and maintaining its dominance through the 2033 forecast period. The market was valued at approximately US$ 7.3 billion in 2026 and is projected to reach US$ 10.6 billion by 2033, growing at a solid CAGR of 5.1%. This leadership is underpinned by the region’s overwhelming shipbuilding concentration, with China, South Korea, and Japan collectively producing nearly 90% of global commercial vessel tonnage. China alone contributes around 40% of global merchant ship orders, translating directly into strong propulsion engine demand, while Japan and South Korea drive premium and technologically advanced system adoption, particularly in LNG carriers.
China leads regional growth through high shipyard utilization, strong domestic OEM capabilities, and supportive government policies promoting propulsion technology self-reliance. Japan’s market remains premium-focused, emphasizing reliability, automation, and LNG propulsion, while India is emerging rapidly, supported by government-led shipbuilding programs and technology partnerships. Growth is further reinforced by expanding intra-Asian trade, large-scale maritime infrastructure investments, and increasing alignment with IMO environmental regulations. Together, these factors sustain Asia Pacific’s long-term leadership and create substantial opportunities across advanced, hybrid, and LNG-based propulsion systems.
North America Marine Propulsion Engines Market Driven by Defense, Offshore, and Innovation
North America represents a secondary yet rapidly expanding marine propulsion engine market, valued at approximately US$ 1.8 billion in 2026 and projected to reach US$ 2.8 billion by 2033, registering a strong CAGR of 6.3% that significantly exceeds the global average. This growth reflects region-specific drivers that differ from mature European markets. Expanding U.S. naval modernization programs, rising offshore energy activity, and increasing maritime trade continue to strengthen demand. Notably, the U.S. marine propulsion engine market alone is expected to surpass US$ 2.5 billion by 2034, underscoring sustained momentum and attractive structural opportunities.
The United States dominates regional performance, accounting for nearly US$ 1.5 billion in 2026 and expanding at a 6.4% CAGR. Demand is concentrated in high-value defense, offshore, and technologically advanced applications. Naval fleet upgrades, offshore exploration in the Gulf of Mexico, and the adoption of hybrid and digitally enabled propulsion systems are key growth catalysts. Strict environmental regulations have further accelerated investments in advanced combustion, emissions control, and fuel-efficient propulsion architectures.
North America’s competitive landscape is defined by global OEM presence, premium pricing, and strong aftermarket support. Looking ahead, investment opportunities are concentrated in autonomous propulsion technologies, offshore renewable energy vessel development, and retrofitting of the existing U.S. merchant and inland fleet, collectively representing multi-billion-dollar long-term potential.
Competitive Landscape
The global marine propulsion engine market is characterized by a moderately consolidated competitive landscape, with a high degree of concentration among well-established international original equipment manufacturers (OEMs). The top ten players collectively account for approximately 65-70% of global market share, reflecting strong entry barriers driven by advanced technological capabilities, capital-intensive manufacturing infrastructure, stringent certification requirements, and long-standing customer relationships.
The competitive environment can be broadly segmented into three tiers. Tier-1 global OEMs, including leading multinational manufacturers, dominate the market with an estimated 45-50% collective share. These companies maintain premium positioning through continuous technological innovation, broad product portfolios, and extensive global service and aftermarket networks. Tier-2 regional specialists, particularly manufacturers based in China, Japan, and South Korea, capture around 20-25% of the market by leveraging competitive pricing, localized production, and strong regional demand.
Tier-3 players consist of emerging competitors and niche specialists that focus on specific vessel types, applications, or geographic markets, operating at comparatively smaller scales. Ongoing market consolidation is accelerating, supported by mergers and acquisitions among Tier-2 and Tier-3 companies seeking scale, R&D efficiency, and regulatory compliance. Overall, high capital requirements and long development cycles continue to reinforce durable competitive advantages for established manufacturers.
Key Industry Developments:
- On 27 October 2025, Rolls-Royce successfully tested its first pure methanol-powered marine engine, marking a major milestone toward low-carbon and climate-friendly marine propulsion.
- On 6 November 2025, Perkins Marine launched its next-generation propulsion engine range at Metstrade 2025, designed to deliver robust and dependable performance for both commercial vessels and leisure boats.
- On 1 November 2025, in India, the Indian Register of Shipping (IRS) and Neptunus Power Plant signed an MoU during Maritime India Week to introduce the world’s first indigenous marine engine condition-monitoring technology, supporting the Atmanirbhar Bharat and Viksit Bharat initiatives.
Companies Covered in Marine Propulsion Engine Market
- Caterpillar
- Daihatsu Diesel MFG Co. Ltd.
- General Electric Company
- Hyundai Heavy Industries Co. Ltd.
- IHI Power Systems Co. Ltd.
- Mitsubishi Heavy Industries Ltd.
- Rolls Royce Plc
- Volkswagen Group (MAN Energy Solutions S.E.)
- Volvo Penta
- Wartsila
- Yanmar Holdings Co. Ltd.
- Other Market Players
Frequently Asked Questions
The Marine Propulsion Engine market is estimated to be valued at US$ 18.4 Bn in 2026.
The key demand driver for the Marine Propulsion Engine market is the sustained growth in global maritime trade and vessel fleet expansion, driven by rising seaborne transportation of energy, commodities, and manufactured goods.
In 2026, the Asia Pacific region will dominate the market with an exceeding 40% revenue share in the global Marine Propulsion Engine market.
Among power range, above 20,000 HP has the highest preference, capturing beyond 40% of the market revenue share in 2026, surpassing other power range.
Caterpillar, Daihatsu Diesel MFG Co. Ltd., General Electric Company, Hyundai Heavy Industries Co. Ltd., IHI Power Systems Co. Ltd., Mitsubishi Heavy Industries Ltd., and Rolls Royce Plc. There are a few leading players in the Marine Propulsion Engine market.


