


- Animal Feed & Additives
- Fish Feed Market
Fish Feed Market Size, Share, Growth, and Regional Forecast, 2026 to 2033
Fish Feed Market by Product Type (Plant Based, Fish & Fish Products, Microorganism), Form (Pellet, Granules, Flakes, Sticks, Powder), Application (Commercial, Household), Distribution Channel (B2B, B2C), and Regional Analysis from 2026 to 2033
Fish Feed Market Share and Trends Analysis
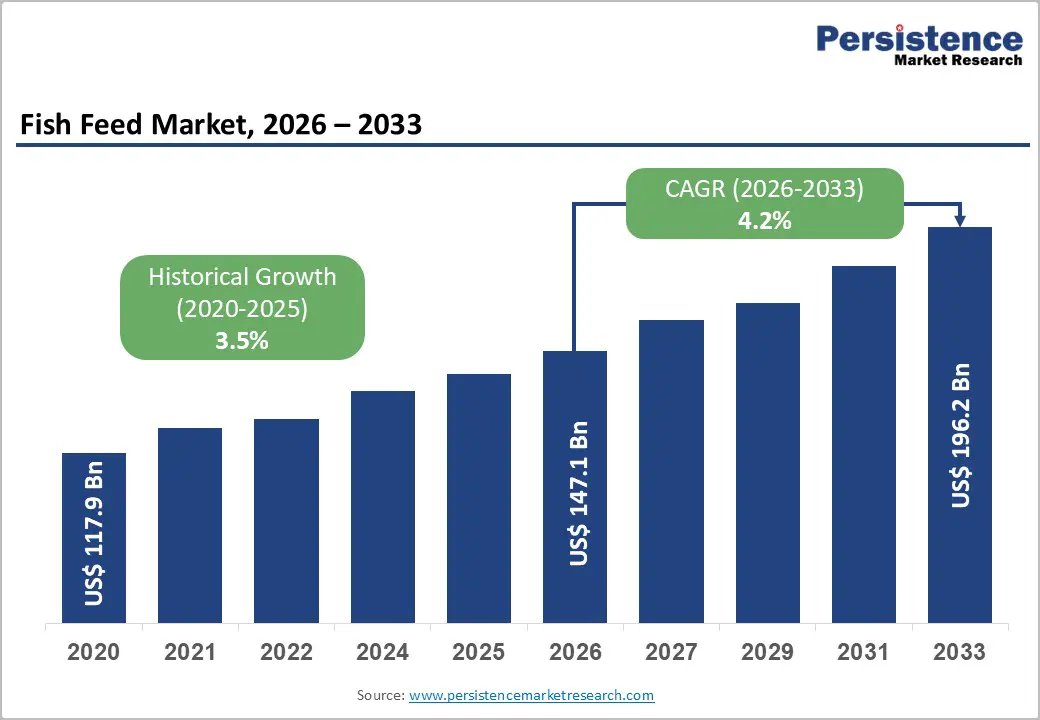
The global fish feed market is projected to grow from US$147.1 billion in 2026 to US$196.2 billion by 2033, at a CAGR of 4.2% over the forecast period. The global market is growing steadily, driven by expanding aquaculture production, rising seafood demand, and improved feed formulations.
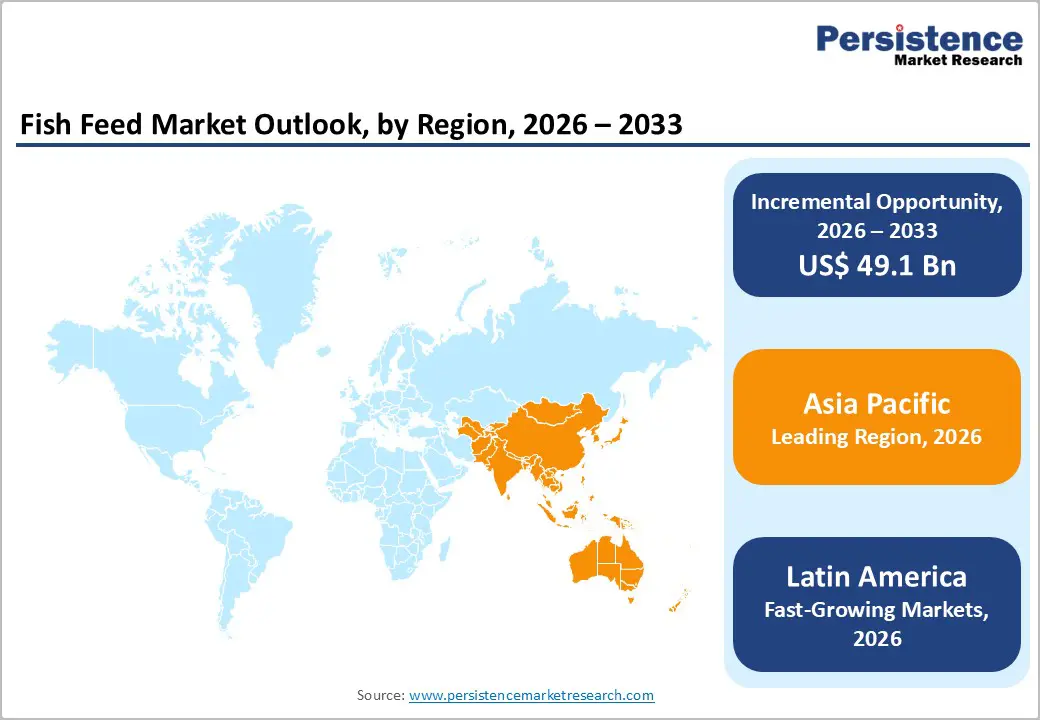
Asia-Pacific dominates the market due to large-scale aquaculture activities, while it is also the fastest-growing region, supported by increasing fish consumption, government support for aquaculture, and the rapid expansion of commercial fish farming practices.
Key Industry Highlights:
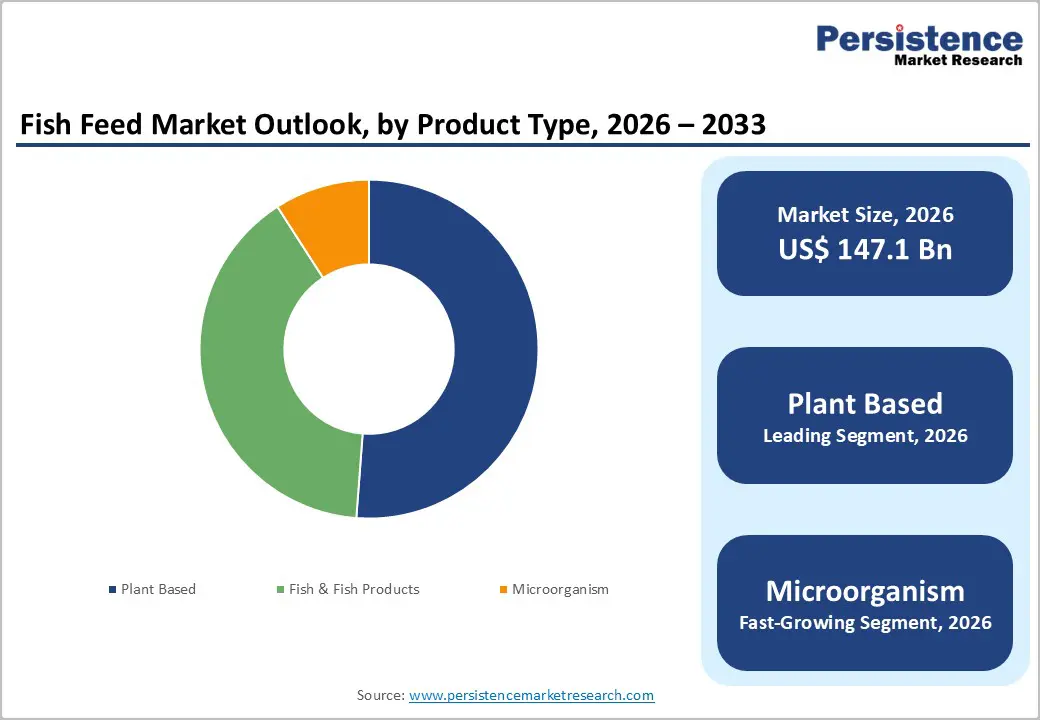
- Dominant Segment: Pelleted fish feed dominates the market with the 60.7% share in 2025, driven by high nutritional efficiency, ease of handling, and widespread use in commercial aquaculture. Plant-based feed ingredients are the fastest-growing segment, supported by sustainability concerns, cost efficiency, and reduced dependence on fishmeal.
- Dominant Region: The Asia-Pacific region holds the largest share at 51.3% in 2025, driven by large aquaculture production volumes in China, India, and Southeast Asia. It is also the fastest-growing region, supported by rising seafood demand, government support for aquaculture, and expanding feed manufacturing capacity.
- Market Drivers: Growth is driven by rising global seafood consumption, the expansion of commercial aquaculture, advances in feed formulation, and a focus on improving feed conversion efficiency and fish health.
- Market Opportunity: Key opportunities include alternative protein sources (plant-based and microorganism feeds), functional and medicated feeds, sustainable aquaculture practices, technological innovation in feed efficiency, and strong growth potential in emerging aquaculture markets.
| Key Insights | Details |
|---|---|
| Fish Feed Market Size (2026E) | US$ 147.1 Bn |
| Market Value Forecast (2033F) | US$ 196.2 Bn |
| Projected Growth (CAGR 2026 to 2033) | 4.2% |
| Historical Market Growth (CAGR 2020 to 2025) | 3.5% |
Market Dynamics
Driver - Rapid expansion of global aquaculture to meet rising seafood consumption
The rapid expansion of global aquaculture is a primary driver of the Fish Feed Market because aquaculture has become the dominant source of seafood production worldwide. According to the FAO’s State of World Fisheries and Aquaculture, global aquaculture output reached approximately 130.9 million tonnes in 2022, surpassing capture fisheries for the first time and contributing about 51 percent of total aquatic animal production. This milestone reflects sustained growth in the farming of finfish, shrimp, carp, salmon, and other species that rely heavily on formulated feed to achieve consistent growth, survival, and nutritional outcomes.
Rising seafood consumption underpins this aquaculture expansion, thereby increasing demand for high-quality feed inputs. FAO data show that apparent global per capita seafood consumption has more than doubled since the 1960s, rising from about 9.1 kg per person to over 20 kg per person in recent years. This shift demonstrates strong consumer demand for aquatic foods as a protein source, a nutritional enhancer, and a dietary staple, thereby stimulating aquaculture producers to scale operations. As farmed production grows, so does the demand for feed - both volume and more advanced formulations tailored to specific species.
Restraints - Volatility in raw material prices, especially fishmeal and fish oil
Volatility in raw material prices, particularly for fishmeal and fish oil, significantly constrains the Fish Feed Market because these marine ingredients are key feed components for many aquaculture species, yet their supply and pricing are highly unpredictable. Fishmeal and fish oil prices have fluctuated sharply in recent years due to environmental and catch variability. For example, Peruvian fishmeal prices ranged approximately between USD 1,400 and USD 2,200 per tonne in 2023 and 2024, reflecting unstable supplies from Peru and Chile, two primary producers. Price instability increases feed manufacturing costs and complicates budgeting for aquaculture operations.
Much of this volatility stems from the sensitivity of forage fish populations to climate phenomena such as El Niño, which reduce anchovy stocks and depress fishmeal and fish oil output, causing sharp price shifts. In 2023, global fishmeal production fell by about 23 percent, and fish oil output declined by about 21 percent compared with the previous year, driven by poor catches of Peruvian anchoveta, a major raw material source. These declines directly reduce feed-ingredient availability, making pricing unpredictable and pressuring feed formulators to seek alternative proteins or absorb higher input costs, thereby constraining fish feed market growth.
Opportunity - Growing adoption of plant-based and alternative protein feed ingredients
The shift toward plant-based and alternative protein ingredients in aquaculture feed represents a major opportunity for the Fish Feed Market because it addresses sustainability and cost pressures associated with traditional fishmeal. Soybean meal, peas, and other plant-derived proteins have long been evaluated as viable replacements for fishmeal due to their high protein content and broader availability; soybean meal typically contains 44-48 percent crude protein and is widely used in aquafeed formulations across species. Studies show that inclusion levels of plant proteins in fish diets can vary widely and are technically feasible, enabling partial to substantial replacement of fishmeal without compromising nutritional balance when properly blended. This diversification supports more resilient feed supply chains and reduces dependency on marine resources.
This transition is supported by broader industry data indicating a significant shift away from reliance on marine ingredients. For example, in Norwegian salmon feed, the use of marine ingredients declined from nearly 90 percent in the 1990s to around 25 percent by 2020, reflecting increased incorporation of plant proteins and other alternatives into commercial diets. This historical trend reflects clear industry momentum toward sustainable formulations that lower pressure on wild fish stocks while supporting rapid expansion of farmed production. Reducing reliance on fishmeal through plant and alternative proteins also aligns with global efforts to improve feed efficiency and environmental outcomes in aquaculture, creating a substantial opportunity for innovation and market growth.
Category-wise Analysis
By Product Type, Plant-Based Dominates the Fish Feed Market
Plant-based products account for 51.2% of the global market in 2025, as they provide a sustainable, cost-effective alternative to marine proteins while meeting the nutritional requirements of many cultured species. Soybean meal and corn gluten are among the most widely used plant proteins; for example, global soybean production exceeded 360 million tonnes in 2024, making soy a readily available protein source for aquafeed formulations. The FAO’s State of World Fisheries and Aquaculture reports that aquaculture now supplies over 50 percent of all fish for human consumption, thereby increasing demand for scalable feed ingredients. Plant proteins reduce dependence on fishmeal and fish oil, whose supply fluctuates with wild fish stocks, and align with environmental goals by lowering pressure on forage fish populations. These factors position plant-based formulations as the primary product type in fish feeds.
By Form, Pellet is gaining traction due to efficient nutrient delivery, reduced waste, and compatibility with mechanized feeding systems
Pellet form dominates the fish feed market because it offers superior nutritional delivery, greater uniformity, and more efficient feed conversion, all of which are critical to commercial aquaculture productivity. Pellets minimize feed waste and maintain nutrient integrity in water longer than other feed forms, thereby supporting higher growth rates in species such as salmon, tilapia, and carp. The FAO reports that global aquaculture production reached approximately 130.9 million tonnes in 2022, underscoring the scale of intensive farming systems in which pellets are preferred for mechanized feeding and to optimize feed conversion ratios. Additionally, globally available grain and protein feedstocks (e.g., soybean and corn) are readily processed into pellets, thereby enhancing consistency and reducing costs in large-scale operations. These technical and operational advantages make pellets the dominant feed form.
Regional Insights
Asia-Pacific Fish Feed Market Trends
The Asia-Pacific region dominates the fish feed market, accounting for 51.3% of the market in 2025, owing to its vast share of global aquaculture production, which drives high feed demand to support large-scale farming of fish and shrimp. According to FAO data, Asia accounts for about 70 percent of the world’s aquatic animal production, with China, India, Vietnam, and Indonesia as leading contributors, making the region critical to global aquaculture output. This concentration means feed producers must cater to extensive aquaculture operations that require formulated diets for species such as carp, tilapia, and shrimp, thereby increasing the region’s share of global fish feed consumption. The scale of seafood production and reliance on aquaculture in Asia Pacific underpin its dominance in the fish feed market.
Europe Fish Feed Market Trends
Europe is a key region in the Fish Feed Market due to its substantial and diverse aquaculture sector, which requires high-quality feed to sustain production of species such as trout, seabass, seabream, carp, mussels, and oysters. The EU produces over a million tonnes of aquaculture products annually, creating consistent demand for formulated feeds that meet the nutritional needs of different species. Countries like Spain, France, Greece, and Italy contribute significantly to this output. Additionally, European aquaculture emphasizes sustainability, animal health, and feed efficiency, with policies and practices promoting responsible farming. These factors together make Europe an important and influential market for fish feed.
North America Fish Feed Market Trends
North America is among the fastest-growing regions in the fish feed market, as its aquaculture industry is expanding to meet rising domestic demand and reduce reliance on imports. In the United States, aquaculture sales reached $1.9 billion in 2023, up 26 percent from 2018, with growth in food fish and mollusk production driving higher feed use. USDA data also show that the number of aquaculture farms increased by 18 percent over that period, supporting sustained feed demand. Additionally, U.S. per capita seafood consumption has risen from approximately 15.6 pounds in 2002 to 20.5 pounds in 2021, indicating a stronger consumer preference for seafood, which in turn promotes domestic aquaculture production and feed requirements. Canadian salmon and trout farming further contribute to this growth trend, reinforcing North America’s expanding fish feed consumption.
Competitive Landscape
Leading companies in the fish feed market focus on high-quality, nutritious, and sustainable feed, investing in pellet formulation, nutrient stability, and species-specific diets. R&D emphasizes growth efficiency, feed conversion, and health benefits, while collaborations with aquaculture experts enhance product performance, sustainability, and adoption, driving market growth, innovation, and improved aquaculture productivity globally.
Key Industry Developments:
- In September 2025, Archer Daniels Midland (ADM) and Alltech finalized a joint venture to combine their North American animal feed businesses, bringing together decades of experience and extensive manufacturing capabilities. The partnership integrated Alltech’s Hubbard Feeds and Masterfeeds operations in the United States and Canada with ADM’s U.S. feed mills, with Alltech holding majority ownership and equal board representation.
- In June 2025, IFB Agro acquired Cargill India’s shrimp and freshwater fish feed business in a strategic move to strengthen its presence in the aquafeed sector. The acquisition allowed IFB Agro to expand its product portfolio, enhance market reach, and capitalize on growing demand in India’s aquaculture industry, positioning the company as a stronger competitor in both shrimp and freshwater fish feed segments.
Companies Covered in Fish Feed Market
- Cargill, Inc.
- Zeigler Bros., Inc.
- Archer Daniels Midland
- Alltech Inc
- Skretting AS
- Aller Aqua A/S
- Sonac B.V.
- BioMar Group
- Nutreco N.V.
- Biomin Holding GmbH
- Ridley Corp.Ltd
- Others
Frequently Asked Questions
The global fish feed market is projected to be valued at us$ 147.1 billion in 2026.
Global fish feed market is driven by rising aquaculture, seafood demand, sustainable feed, and technological advancements.
The global fish feed market is poised to witness a CAGR of 4.2% between 2026 and 2033.
Key opportunities include plant-based proteins, alternative feeds, functional diets, sustainable practices, emerging markets, and technological innovation.
Cargill, Inc., Zeigler Bros., Inc., Archer Daniels Midland, Alltech Inc, Skretting AS, Aller Aqua A/S.


