


- Travel and Tourism
- Event Tourism Market
Event Tourism Market Size, Share, and Growth Forecast, 2025 - 2032
Event Tourism Market By Event Type (Conferences & Exhibitions, Sports Events), Revenue Source (Sponsorship & exhibitor fees, Ticketing & F&B), Delivery Mode, End-user, and Regional Analysis for 2025 - 2032
Event Tourism Market Size and Trends Analysis
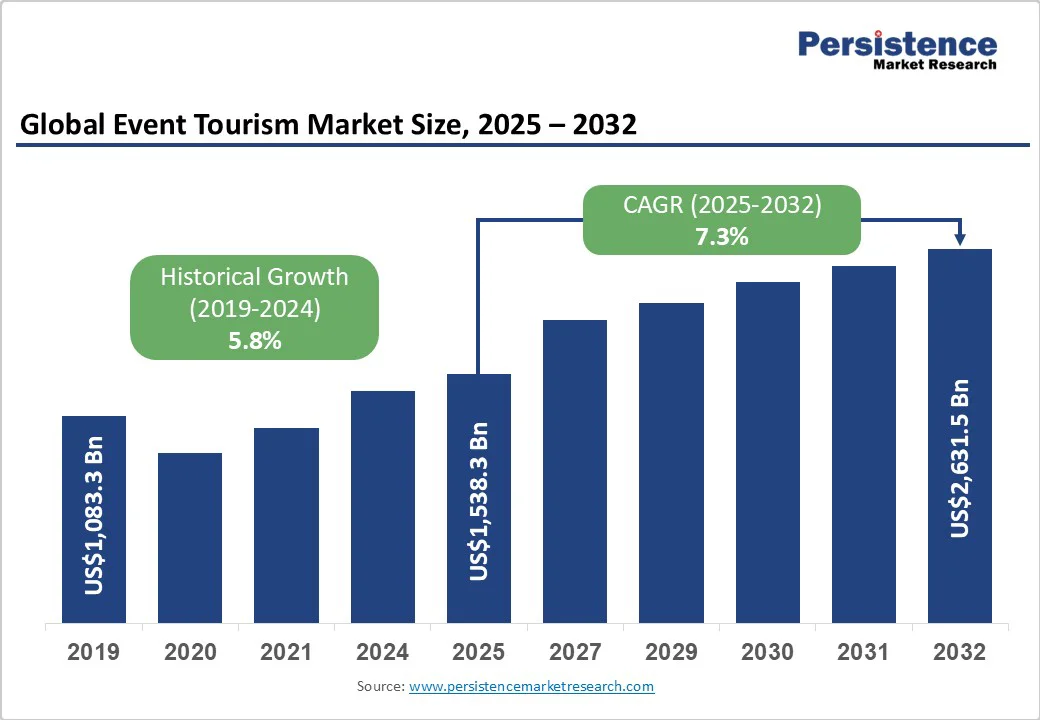
The global event tourism market size is likely to be valued at US$1,538.3 Bn in 2025 and is expected to reach US$2631.5 Bn by 2032, growing at a CAGR of 7.3% during the forecast period from 2025 to 2032, driven by the resurgence of international travel, the expansion of global sporting and cultural event calendars, and the commercialization of hybrid event formats. Rising sponsorship revenues, data-driven monetization models, and government investments in destination marketing are further accelerating momentum.
Key Industry Highlights
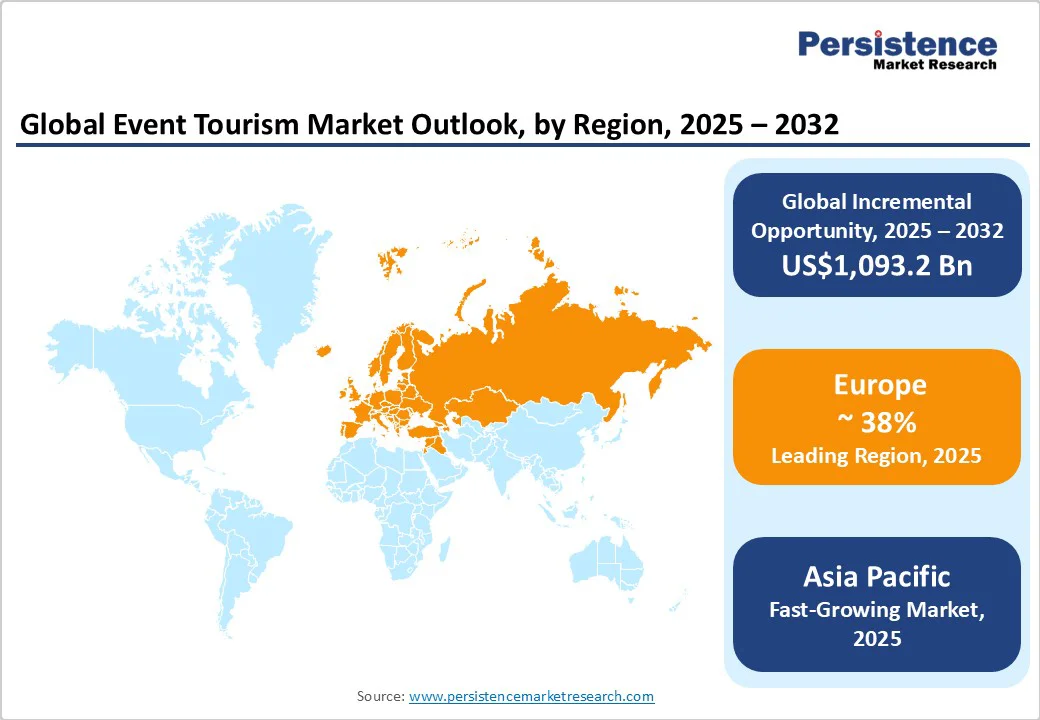
- Leading Region: Europe, accounting for approximately 38% of global event tourism revenues in 2025, supported by Germany, the U.K., France, and Spain, with major exhibition centers and cultural events.
- Fastest-Growing Region: Asia Pacific, projected to grow at a CAGR of 9% from 2025 to 2032, driven by China, India, Japan, and ASEAN countries investing heavily in MICE infrastructure and large-scale events.
- Investment Plans: Multi-billion-dollar investments in convention centers, hybrid event technologies, and ESG-compliant facilities across North America, Europe, and Asia Pacific; examples include Los Angeles Convention Centre expansion (US$1.2 Bn, 2024) and India’s IICC in New Delhi (2023).
- Dominant Event Type: Conferences & Exhibitions, contributing 38% of global revenues in 2025, benefiting from corporate sponsorship, multi-day attendance, and international exhibitor participation.
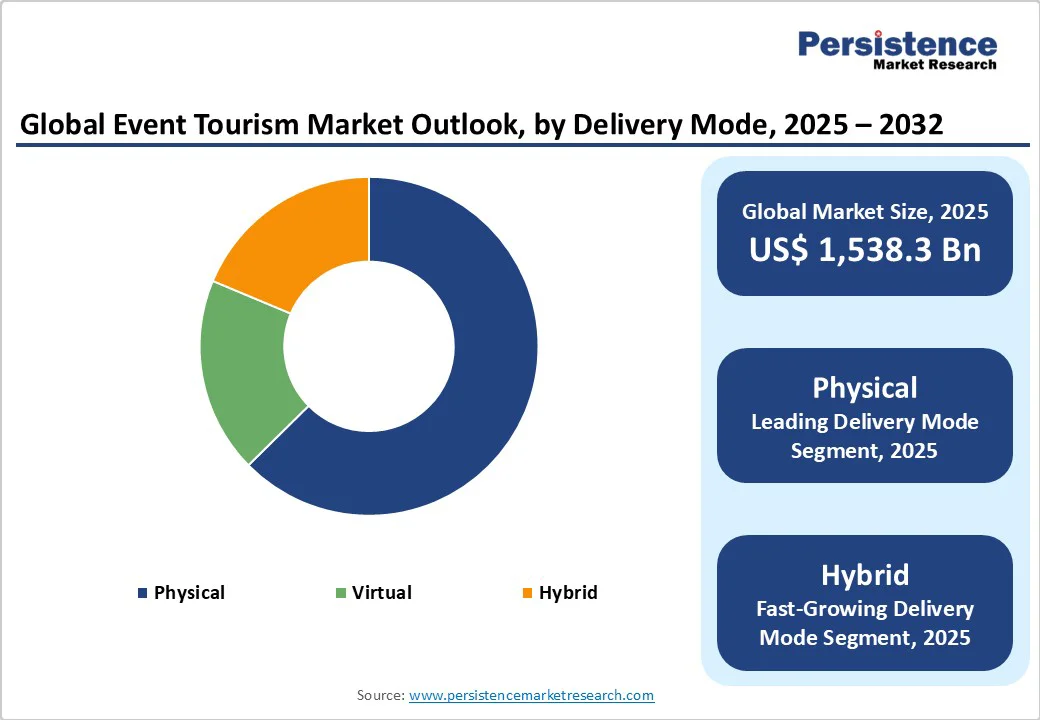
- Leading Delivery Mode: Physical Events, representing 67% of global revenues, generating significant economic impact through in-person attendance.
| Key Insights | Details |
|---|---|
|
Event Tourism Market Size (2025E) |
US$1,538.3 Bn |
|
Market Value Forecast (2032F) |
US$2631.5 Bn |
|
Projected Growth (CAGR 2025 to 2032) |
7.3% |
|
Historical Market Growth (CAGR 2019 to 2024) |
5.8% |
Market Factors - Growth, Barriers, and Opportunity Analysis
Growth Analysis - Rebound in International Travel and Business Events
Global tourism and business travel have recovered close to pre-pandemic levels, restoring the large attendee base required for conferences, exhibitions, and festivals. The World Travel and Tourism Council noted that travel and tourism contributed over US$10 Tn to global GDP in 2024. This surge has translated directly into higher event attendance, stronger exhibitor participation, and more robust sponsorship pipelines, creating a firm foundation for sustained growth in the event tourism sector.
Commercialization through Sponsorship and Premium Experiences
Event organizers are diversifying their revenue streams by packaging tiered sponsorships, premium hospitality, and branded on-site activations. Corporate sponsors increasingly view events as high-value platforms for measurable brand exposure. Premium segments such as VIP lounges, curated experiences, and exclusive hospitality packages are commanding higher ticket prices, raising the per-attendee revenue significantly. This trend is reshaping the profitability profile of event tourism.
Digital Platforms and Hybrid Events Expanding Reach
The rapid growth of digital and hybrid events has broadened participation beyond geographic limits. Virtual event platforms are projected to more than double in value by 2032, enabling sponsors to reach global audiences at lower incremental costs. Hybrid formats, combining live and virtual participation, provide stronger analytics for sponsors, improving return on investment while creating recurring revenue opportunities for organizers.
Barrier Analysis - Venue and Infrastructure Bottlenecks
Major hubs such as New York, London, Paris, and Singapore are facing infrastructure constraints, including limited venue capacity and hotel supply during peak event seasons. Overcrowding in popular destinations often leads to capped attendance and rising costs. These bottlenecks restrict organizers’ ability to scale large events and may divert opportunities to secondary cities with better capacity.
Macroeconomic Sensitivity of Event Spending
Event tourism remains highly exposed to shifts in corporate budgets and consumer discretionary income. During economic downturns, companies reduce spending on conferences and incentives, while individuals cut back on leisure travel to festivals and sports events. Currency fluctuations also affect inbound tourism flows, creating revenue volatility in key markets.
Opportunity Analysis - Growth of Hybrid and Virtual Monetization
Hybrid and virtual events represent one of the most lucrative growth opportunities. By 2032, these formats are expected to contribute an additional US$200 - US$600 Bn to the global market, driven by digital ticketing, streaming, on-demand content sales, and data-driven sponsorships. This evolution ensures that organizers can extend event lifecycles and reach participants who may never attend in person.
Emerging Markets and Secondary Cities
Rapid economic growth and government investment in Asia Pacific, the Middle East, and Latin America are opening new frontiers for event tourism. Countries, including China, India, and Singapore, are building large convention centers and easing visa restrictions to attract international exhibitions and sporting events. Secondary cities are also capitalizing on congestion in established hubs, creating fresh opportunities for organizers willing to expand beyond traditional markets.
Sustainability and ESG-Certified Events
The demand for environmentally responsible events is rising. Organizers that provide measurable sustainability credentials, such as low-carbon production, zero-waste initiatives, and socially responsible programs, can command higher sponsorship premiums. Early movers in ESG-certified events are expected to benefit from a 3% to 5% uplift in average revenue per attendee.
Category-wise Analysis
Event Type Insights
Conferences and exhibitions dominate the event tourism market, accounting for 38% of total revenue in 2025. Mature economies such as the U.S., Germany, and China host some of the world’s largest conventions, with individual events generating multi-billion-dollar impacts. For instance, CES Las Vegas 2024 welcomed over 135,000 attendees, generating US$600 Mn in direct spending. These events benefit from repeat attendance, corporate sponsorship, and multi-day duration, strengthening their share of the market. With stable demand from trade and industry associations, conferences and exhibitions are expected to maintain their leading position through 2032.
Sports events are forecast to grow at the fastest rate, with a projected CAGR of 8% between 2025 and 2032, outpacing other event categories. In 2025, sports accounted for roughly 22% of global event tourism revenues, but their share is rising steadily due to mega tournaments. The 2026 FIFA World Cup in North America and the 2032 Brisbane Olympics are expected to drive record-breaking tourism flows. Spending per attendee is often 1.5–2 times higher than at conferences, driven by ticket pricing, hospitality, and merchandise sales, making sports a powerful growth driver.
Delivery Mode Insights
Physical events continue to dominate, representing 67% of global event tourism revenues in 2025. Festivals, concerts, and international exhibitions drive large-scale travel, with each physical attendee spending an average of US$1,200 to US$1,800 on accommodation, dining, retail, and transport. The Coachella Festival 2023 alone generated more than US$400 Mn in economic activity in California. While digital platforms provide scale, the experiential nature of live gatherings underpins their leadership.
Hybrid events, combining live and digital participation, are growing rapidly at an estimated CAGR of 13% between 2025 and 2032. This model extends geographic reach, offers greater sponsor visibility, and enhances revenue diversification. For example, Salesforce Dreamforce has successfully scaled hybrid engagement, with online participation often exceeding in-person numbers. Corporations and associations increasingly prefer hybrid formats due to cost efficiency and sustainability benefits, positioning them as the fastest-growing delivery mode in global event tourism.
Regional Market Insights
Europe Event Tourism Market Trends - ESG Innovation and Strong Organizer Ecosystem
Europe commands approximately 38% of revenue in 2025, making it the largest regional market. Germany leads with world-class exhibition hubs like Messe Frankfurt and Messe Berlin, followed by the U.K., France, and Spain. Major events such as Mobile World Congress (Barcelona) and Paris Fashion Week reinforce Europe’s cultural and economic influence in global tourism. Regulatory harmonization within the EU is driving sustainability, accessibility, and data compliance standards, which, while raising operational costs, are spurring innovation in greener and more inclusive event models.
Recent investments include London’s Excel Centre expansion (completed 2024) and Messe Frankfurt’s retrofitting initiatives to meet ESG standards. Spain’s tourism ministry announced in early 2025 a €250 Mn (US$292 Mn) fund to upgrade secondary city convention infrastructure, boosting regional competitiveness. Country insights reveal that Germany remains Europe’s largest event tourism hub, with more than 320,000 exhibitors in 2023 across trade fairs, while France continues to capitalize on global cultural events like the 2024 Paris Olympics, which attracted over 15 million visitors. Overall, Europe’s strength lies in its diverse cultural appeal, robust infrastructure, and strong organizational presence, though rising regulatory compliance and cost pressures remain key considerations.
Asia Pacific Event Tourism Market Trends - MICE Investment and Sports-Led Demand
Asia Pacific is the fastest-growing regional market, with a projected CAGR of 9% from 2025 to 2032. Rising middle-class populations, improving air connectivity, and government investments in MICE infrastructure are central to expansion. China, India, and Japan dominate, while Singapore, Thailand, and Malaysia act as competitive regional convention hubs. Large-scale sports and cultural events, visa facilitation programs, and tourism promotion campaigns are further accelerating demand.
Recent developments include India’s International Exhibition and Convention Centre (IICC) in Dwarka, New Delhi, inaugurated in 2023, and Japan’s upgrades to Osaka’s Yumeshima site ahead of Expo 2025. China continues to lead, with Shanghai’s National Exhibition and Convention Center hosting events that attract millions of domestic and international participants. Country insights highlight that China holds the largest share of APAC event tourism revenues (30–35% of the regional total), powered by massive government-backed exhibitions. India, meanwhile, is emerging as a sports tourism hub, with the 2023 Cricket World Cup contributing US$3 Bn to its economy. ASEAN markets such as Singapore remain vital due to their efficient infrastructure and global connectivity, supported by government-backed initiatives such as the Singapore Tourism Board’s 2024 MICE incentive scheme. Asia Pacific’s trajectory positions it as the most dynamic region in event tourism globally.
North America Event Tourism Market Trends - Infrastructure Expansion, and Mega Events Drive the Market
North America maintains a mature position in the market, with the U.S. as the regional leader. Flagship cities such as Las Vegas, Orlando, Chicago, and New York host global conventions and exhibitions that generate billions in economic activity. For instance, CES Las Vegas 2024 welcomed more than 135,000 attendees, contributing over US$600 Mn in local economic impact. The region benefits from advanced infrastructure, extensive airline connectivity, and strong corporate sponsorship ecosystems.
Recent developments include Los Angeles’ US$1.2 Bn expansion of its convention center (2024) and investments in hybrid event technologies by leading organizers such as Freeman and Cvent. Risks persist around ticketing regulations following the U.S. Department of Justice scrutiny into exclusive vendor arrangements in 2023. Canada is also strengthening its role, with Toronto’s Metro Convention Centre reporting record event bookings in 2024, reflecting growing international demand. Mexico is emerging as a sports tourism hotspot, boosted by preparations for the 2026 FIFA World Cup across North American host cities. Overall, North America continues to prioritize innovation and scale, ensuring its global leadership in event tourism.
Competitive Landscape
The global event tourism market is moderately consolidated. Large international organizers such as Informa, Reed Exhibitions, and Messe Frankfurt dominate the exhibition and conference space, while Live Nation leads in live entertainment. In contrast, the virtual and hybrid event technology segment remains fragmented but is consolidating rapidly through mergers and acquisitions.
Market leaders are focusing on portfolio consolidation, digital integration, premium experiences, ESG-compliant offerings, and expansion into fast-growing regions such as Asia Pacific and the Middle East.
Key Industry Developments
- In September 2025, the UAE introduced four new specialized Visit Visas targeting professionals in Artificial Intelligence (AI), the cruise industry, events, and entertainment sectors. This initiative aims to attract skilled talent and support the growth of emerging industries.
- In October 2024, Informa PLC completed the acquisition of Ascential plc, adding marquee events such as Cannes Lions to its portfolio and enhancing its data-driven event solutions. The acquisition strengthens Informa’s global footprint in conferences and exhibitions.
Companies Covered in Event Tourism Market
- Informa PLC
- Live Nation Entertainment
- Cvent (Blackstone-owned)
- Reed Exhibitions / RELX
- Messe Frankfurt
- GL Events
- Eventbrite
- MCI Group
- BCD Meetings & Events
- ATPI Group
- Freeman
- Marriott International
- Hilton Worldwide
- Accor Group
- TUI Group
- dmg events
- Clarion Events
- Emerald Expositions
- Informa Markets
- Messe München
Frequently Asked Questions
The event tourism market is estimated at US$1,538.3 Bn in 2025.
The event tourism market is projected to reach US$2,631.5 Bn by 2032, reflecting robust growth across multiple event segments and regions.
Key trends are the growth of hybrid events combining physical and virtual participation and the expansion of sports tourism through mega events such as the FIFA World Cup and the Olympics.
The leading segment is Conferences & Exhibitions, accounting for 35–40% of global revenues in 2025, driven by corporate sponsorship and multi-day international gatherings.
The event tourism market is expected to grow at a CAGR of 7.3% from 2025 to 2032.
Some key players in the event tourism market include Informa PLC, Live Nation Entertainment, Cvent (Blackstone-owned), Reed Exhibitions / RELX, and Messe Frankfurt.


