


- Medical Devices
- Smart Stethoscope Market
Smart Stethoscope Market Size, Share, and Growth Forecast, 2026 - 2033
Smart Stethoscope Market by Product Type (Wireless Smart Stethoscopes, Others), Application (Cardiovascular, Respiratory Monitoring, Others), End-user (Hospitals, Clinics, Homecare Settings, Ambulatory Surgical Centers (ASCs), Others), and Regional Analysis for 2026 - 2033
Smart Stethoscope Market Share and Trends Analysis
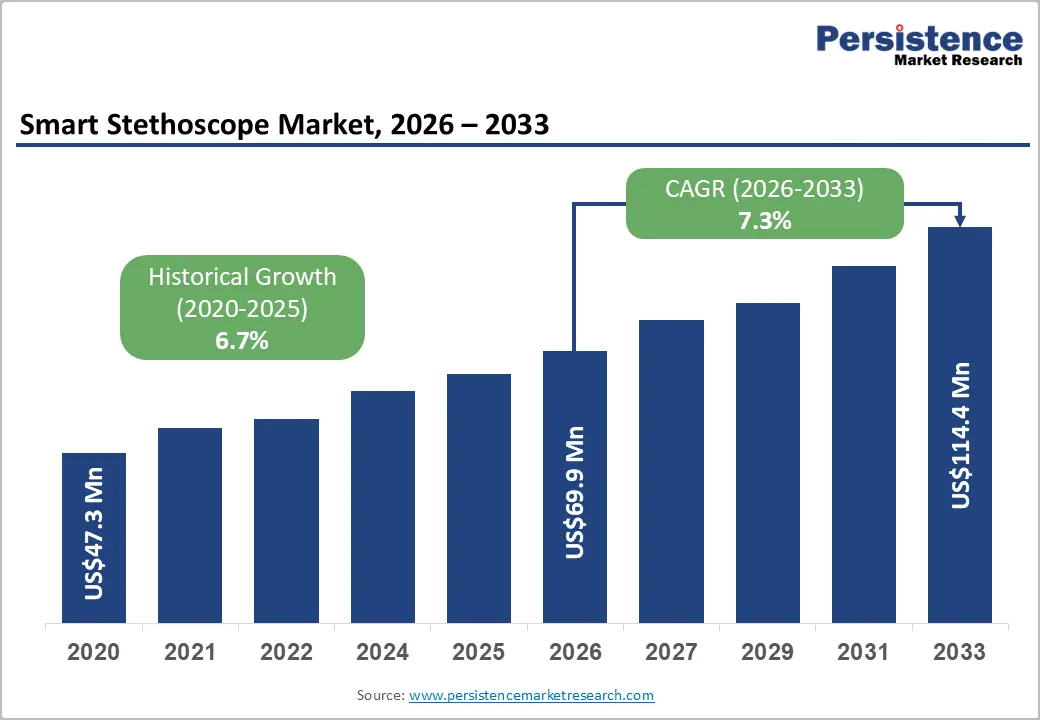
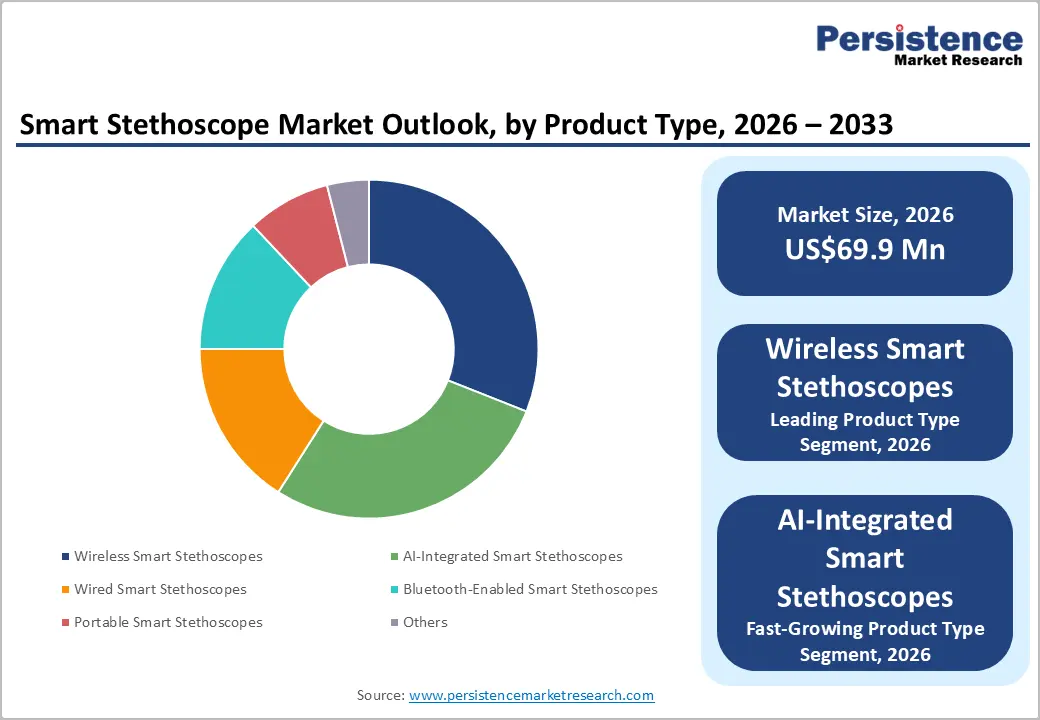
The global smart stethoscope market size is likely to be valued at US$69.9 million in 2026 and is estimated to reach US$114.4 million by 2033, growing at a CAGR of 7.3% during the forecast period from 2026 to 2033, driven by rising adoption of digital diagnostic technologies, increasing cardiovascular and respiratory disease burden, and expansion of connected healthcare infrastructure.
Growth momentum is supported by aging population demographics that require continuous cardiopulmonary monitoring across clinical and home care settings. Regulatory emphasis on telehealth integration and remote patient management is accelerating procurement of AI-enabled diagnostic devices across hospitals and outpatient networks.
Key Industry Highlights:
- Leading Product Type: Wireless smart stethoscopes are anticipated to hold around 31% revenue share in 2026, driven by expanding telemedicine integration.
- Fastest-growing Product Type: AI-integrated smart stethoscopes are projected as the fastest-growing segment, driven by increasing adoption of automated cardiopulmonary analysis.
- Leading Application: Cardiovascular is estimated to hold over 34% revenue share in 2026, driven by rising cardiac disease screening requirements.
- Fastest-growing Application: Telemedicine is forecast to record the fastest growth, driven by the expansion of remote healthcare delivery infrastructure.
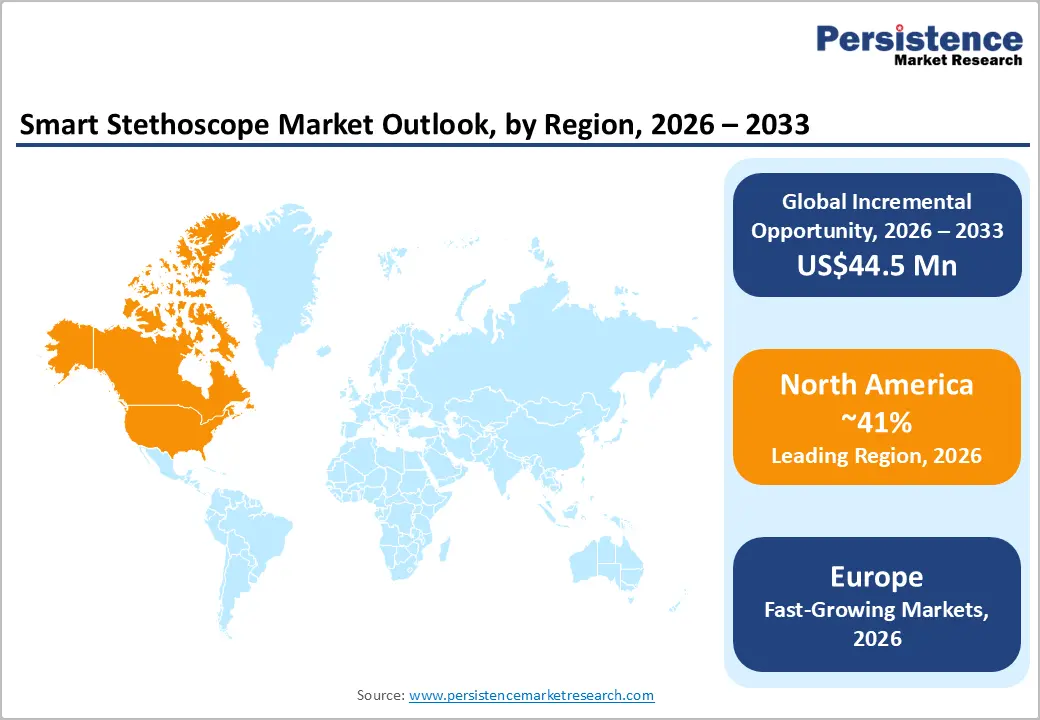
- Regional Leadership: North America is projected to capture around 41% of the market share by 2026, driven by strong healthcare digitization investments.
- Competitive Environment: The market reflects a moderately fragmented structure, with companies focusing on AI-enabled diagnostics and interoperable healthcare platforms.
- Innovation Trends: Technological advancements in wireless connectivity, cloud-based auscultation, and predictive acoustic analytics are shaping long-term industry evolution.
DRO Analysis
Driver - Rising Burden of Cardiovascular and Respiratory Diseases
The increasing prevalence of chronic cardiovascular and pulmonary disorders is strengthening demand for digital auscultation technologies capable of improving diagnostic precision and clinical workflow efficiency. Smart stethoscopes support real-time sound amplification, AI-assisted interpretation, and remote data transmission, enabling faster detection of heart murmurs, wheezing, and lung abnormalities. According to the World Health Organization, cardiovascular diseases caused nearly 19.8 million deaths globally in 2022, reinforcing demand for advanced monitoring technologies across primary and acute care settings.
Growing patient volumes within emergency departments and outpatient clinics are encouraging healthcare providers to adopt connected diagnostic tools that reduce examination variability and support electronic medical record integration. Digital auscultation systems improve care continuity across telemedicine platforms and geographically dispersed healthcare facilities. Expanding clinical focus on preventive cardiology and respiratory monitoring is creating sustained procurement opportunities for portable and wireless diagnostic devices across hospitals, ambulatory facilities, and home healthcare networks.
Restraint - High Device Acquisition and Integration Costs
Advanced smart stethoscopes incorporate AI software, wireless communication modules, digital sensors, and cloud integration capabilities that increase overall procurement expenses for healthcare facilities. Smaller clinics and independent practitioners often face budget constraints that limit adoption of premium diagnostic systems. High implementation costs reduce scalability across low-resource healthcare environments and slow purchasing decisions among cost-sensitive institutions.
Recurring expenses related to software licensing, cybersecurity compliance, maintenance contracts, and interoperability upgrades create additional financial pressure for healthcare providers. Limited reimbursement coverage for digital auscultation procedures in several healthcare systems affects return-on-investment calculations. Margin pressure intensifies for manufacturers managing semiconductor procurement costs and continuous software development requirements within competitive pricing environments.
Opportunity - Expansion of AI-assisted Diagnostics in Primary Healthcare
Growing emphasis on early disease detection is creating strong opportunities for AI-integrated smart stethoscopes within primary care and outpatient settings. Automated sound analysis algorithms can assist clinicians in identifying abnormal heart and lung sounds with improved consistency and reduced examination variability. Healthcare providers can expand diagnostic accessibility across underserved communities through portable and connected auscultation technologies integrated with telehealth ecosystems and cloud-based consultation platforms.
Medical device companies are investing in machine learning models capable of identifying respiratory distress, arrhythmias, and valvular abnormalities through real-time acoustic analysis. Integration of predictive analytics within digital stethoscopes can strengthen preventive healthcare initiatives and reduce unnecessary hospital admissions. Regulatory encouragement for AI-enabled medical technologies and rising physician acceptance of clinical decision-support systems are expected to create long-term commercialization opportunities across multispecialty healthcare environments.
Category-wise Analysis
Product Type Insights
Wireless smart stethoscopes are anticipated to secure around 31% of the smart stethoscope market share in 2026, reflecting increasing preference for untethered diagnostics and seamless telehealth integration across clinical environments. Physicians are adopting mobile-enabled auscultation tools to improve examination flexibility and workflow efficiency. In 2025, 3M expanded digital connectivity features within Littmann electronic stethoscope platforms, supporting remote consultations and cloud-based acoustic sharing across healthcare systems.
AI-integrated smart stethoscopes are expected to be the fastest-growing segment, propelled by the rising deployment of machine learning algorithms for automated cardiopulmonary sound analysis and clinical decision support applications. Healthcare institutions are prioritizing diagnostic standardization and early disease detection capabilities. In 2026, Eko Health strengthened AI-enabled murmur detection functionality within connected auscultation systems, supporting physician workflow optimization and preventive cardiac screening initiatives.
Application Insights
Cardiovascular is poised to dominate with a forecast market share of over 34% in 2026, powered by the increasing prevalence of heart disease and expanding demand for early cardiac abnormality detection across outpatient and emergency care environments. Digital auscultation systems improve detection consistency and clinical documentation efficiency. Eko Health's advanced AI-assisted cardiac screening tools support physicians during remote and in-person cardiovascular examinations within integrated healthcare systems.
Telemedicine is estimated to be the fastest-growing segment, fueled by increasing physician reliance on connected diagnostic devices for remote consultations and decentralized healthcare delivery models. Wireless sound transmission capabilities improve clinical accessibility across geographically dispersed patient populations. Thinklabs Medical expanded cloud-compatible digital stethoscope integration supporting telehealth providers delivering cardiopulmonary assessments through virtual healthcare platforms and remote patient monitoring networks internationally.
Distribution Channel
Hospitals are likely to be the leading segment with a projected 38% of the smart stethoscope market share in 2026, due to expanding investment in connected diagnostic infrastructure and rising emergency care patient volumes globally. Large healthcare institutions prioritize interoperable medical technologies, improving examination efficiency and digital documentation. In 2025, Philips strengthened deployment partnerships supporting the integration of digital auscultation systems within hospital-based patient monitoring and clinical workflow environments internationally.
Telehealth providers are anticipated to be the fastest-growing segment, fueled by the expansion of virtual consultation services and increasing reimbursement support for remote healthcare delivery models. Connected auscultation technologies improve diagnostic reliability during physician-patient interactions conducted through digital healthcare platforms. In 2026, TytoCare enhanced remote examination ecosystems through AI-enabled digital stethoscope integration supporting home-based cardiopulmonary assessments and chronic disease monitoring programs across distributed healthcare networks.
Regional Insights
North America Smart Stethoscope Market Trends
North America is expected to lead with an estimated 41% of the smart stethoscope market share in 2026, supported by advanced healthcare digitization, strong telemedicine penetration, and large-scale deployment of connected diagnostic infrastructure. Expansion of remote patient monitoring programs is increasing demand for AI-enabled auscultation systems across hospitals and virtual care networks.
U.S. Smart Stethoscope Market Insights
The U.S. is expected to account for nearly 78% of the North American smart stethoscope market share in 2026 due to high healthcare technology adoption and strong digital infrastructure. Federal healthcare digitization initiatives are encouraging the deployment of interoperable diagnostic technologies within hospitals and primary care networks. Healthcare providers increased investment in AI-assisted auscultation platforms supporting remote cardiopulmonary monitoring.
Canada Smart Stethoscope Market Insights
Canada is projected to contribute around 22% of the North American smart stethoscope market share in 2026, supported by growing telehealth infrastructure investments. Provincial telemedicine programs are encouraging healthcare facilities to deploy connected diagnostic technologies capable of supporting remote consultations across geographically dispersed communities. Expected growth in chronic respiratory disease monitoring is increasing adoption of digital auscultation systems among hospitals and outpatient clinics.
Europe Smart Stethoscope Market Trends
Europe is forecast to be the fastest-growing market for smart stethoscopes, stimulated by the expansion of digital healthcare policies, the increasing aging population, and rising integration of AI-assisted diagnostics within public healthcare systems. Healthcare providers are prioritizing connected diagnostic tools that improve remote patient monitoring efficiency and clinical documentation. Philips and Meditech Equipment are strengthening regional presence through connected auscultation technologies and telehealth-compatible platforms.
Germany Smart Stethoscope Market Insights
Germany is forecast to account for nearly 24% of the European smart stethoscope market share in 2026 due to rapid digital healthcare integration. Government-backed digital health transformation programs are encouraging the integration of connected diagnostic systems within primary care and specialist practices. Forecast expansion of remote cardiac monitoring services is strengthening demand for digital stethoscopes supporting cloud-based data sharing.
U.K. Smart Stethoscope Market Insights
The U.K. is likely to secure around 18% of the European smart stethoscope market share in 2026, supported by virtual healthcare expansion and connected care investments. Healthcare institutions are integrating wireless diagnostic tools to improve physician collaboration and remote examination quality. Virtual consultation programs expanded the deployment of digital auscultation systems supporting community healthcare services.
Asia Pacific Smart Stethoscope Market Trends
Asia Pacific is forecast to capture nearly 28% of the smart stethoscope market share in 2026, stimulated by expanding healthcare digitization, rising telemedicine penetration, and increasing investment in connected diagnostic infrastructure across emerging healthcare systems. Government-backed digital health programs are accelerating adoption of AI-enabled auscultation technologies within hospitals, clinics, and community healthcare centers.
China Smart Stethoscope Market Insights
China is projected to capture approximately 36% of the Asia Pacific smart stethoscope market share in 2026 due to strong domestic medical device manufacturing capabilities. Public health modernization programs are encouraging the adoption of connected diagnostic systems supporting remote consultations and chronic disease management. The expected increase in cardiovascular screening initiatives is strengthening the procurement of portable auscultation devices within community healthcare centers.
India Smart Stethoscope Market Insights
India is expected to hold nearly 19% of the Asia Pacific smart stethoscope market share in 2026, supported by rapid healthcare digitalization initiatives. Government-backed digital health initiatives are encouraging the deployment of connected medical devices within primary healthcare facilities. Healthcare providers expanded remote consultation capabilities supporting chronic respiratory and cardiac disease monitoring.
Competitive Landscape
The global smart stethoscope market is moderately fragmented, characterized by competition among digital diagnostic technology providers, AI-enabled medical device manufacturers, and connected healthcare platform developers. Companies are focusing on wireless integration, AI-assisted sound analysis, and cloud-enabled clinical workflows to strengthen commercial positioning. Key participants include 3M, Eko Health, Philips, Thinklabs Medical, and TytoCare.
Competitive intensity is increasing due to rapid innovation in telemedicine-compatible diagnostic technologies and expansion of AI-driven clinical decision-support applications. Market participants are investing in strategic partnerships with healthcare providers and telehealth platforms to strengthen distribution capabilities and recurring revenue opportunities. Product differentiation is increasingly based on acoustic precision, interoperability, cybersecurity compliance, and integration with electronic health record ecosystems across hospitals and remote monitoring environments.
Key Industry Developments:
- In October 2025, Lapsi Health launched Keikku 2.0, the world’s first FDA-cleared digital stethoscope with an integrated AI scribe, enabling real-time auscultation, automated clinical documentation, and AI-assisted diagnostic insights within a single connected medical device.
- In September 2025, Sanolla launched the FDA-certified VoqX smart AI-powered stethoscope featuring full-spectrum auscultation and real-time cardiopulmonary analysis capabilities, strengthening innovation within connected diagnostic technologies.
Companies Covered in Smart Stethoscope Market
- 3M
- Eko Health
- Philips
- Thinklabs Medical
- TytoCare
- HD Medical
- M3DICINE
- American Diagnostic Corporation
- Cardionics
- Clinicloud
- Meditech Equipment
- Hill-Rom Holdings
- Dongjin Medical
- Sonavi Labs
StethoMe
Frequently Asked Questions
The global smart stethoscope market is projected to reach US$69.9 million in 2026.
Rising prevalence of cardiovascular and respiratory diseases, rapid adoption of telemedicine, and integration of AI-enabled diagnostic technologies in connected healthcare systems are driving the smart stethoscope market.
The smart stethoscope market is poised to witness a CAGR of 7.3% from 2026 to 2033.
Expansion of AI-assisted remote diagnostics, growth of home healthcare monitoring, and increasing deployment of telehealth infrastructure across primary and specialty care settings are creating key market opportunities.
Some of the key market players include 3M, Eko Health, Philips, Thinklabs Medical, and TytoCare.


