


- Transportation & Logistics
- Reverse Logistics Market
Reverse Logistics Market Size, Share, and Growth Forecast, 2025 - 2032
Reverse Logistics Market By Return Type (Commercial Returns, Others), Service Type (Transportation, Warehousing, Others), End-user Industry (E-Commerce, Automotive, Retail, Consumer Electronics, Pharmaceuticals, Others), and Regional Analysis for 2025 - 2032
Reverse Logistics Market Share and Trends Analysis
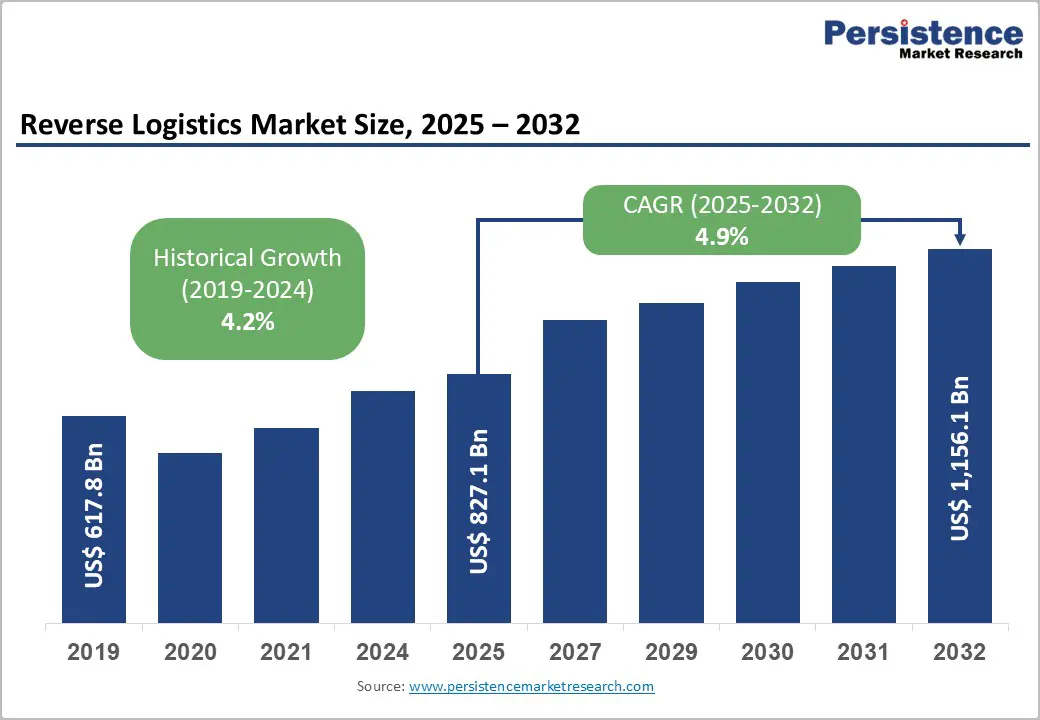
The global reverse logistics market size is likely to be valued at US$827.1 Billion in 2025, and is estimated to reach US$1,156.1 Billion by 2032, growing at a CAGR of 4.9% during the forecast period 2025 - 2032, driven by the proliferation of e-commerce operations, tightening sustainability regulations, and technological advancements in supply chain management.
Market growth is driven by rising product returns, stricter recycling regulations, and a stronger focus on circular economy principles. Companies are adopting advanced reverse logistics solutions powered by automation and analytics to optimize returns, cut waste, and recover value from end-of-life assets.
Key Industry Highlights
- Leading Return Type: Commercial returns lead the market at an estimated 43% share in 2025, with end-of-life returns growing fastest.
- Leading Service Type: Transportation services dominate with approximately 38% of the market revenue share in 2025, while reselling services are the fastest-growing through 2032.
- Dominant End-User Industry: E-commerce represents the largest end-user vertical with an estimated 41% market share in 2025, whereas automotive is the fastest-growing sector from 2025 to 2032.
- Regional Dynamics: North America commands the largest regional market share at 34% in 2025, with Asia Pacific showing the highest CAGR between 2025 and 2032.
- Key Market Driver: Enforcement of extended producer responsibility (EPR) and Waste Electrical and Electronic Equipment Directive (WEEE) regulations has accelerated reverse logistics adoption, particularly in Europe and North America.
- Industry Scenario: Recent industry developments include the introduction of AI-driven logistics platforms, strategic acquisitions in Asia Pacific by logistics giants, and blockchain implementation for sustainability by leading players.
- Competitive Environment: Market consolidation is ongoing, with the top 10 players holding nearly half the market, focusing on technological innovation and geographic expansion.
- January 2025: DHL Supply Chain acquired Inmar Supply Chain Solutions to enhance its reverse logistics capabilities in North America, expanding its returns processing, recall management, and supply chain analytics to better serve the growing e-commerce market.
| Key Insights | Details |
|---|---|
| Reverse Logistics Market Size (2025E) | US$827.1 Bn |
| Market Value Forecast (2032F) | US$1,156.1 Bn |
| Projected Growth (CAGR 2025 to 2032) | 4.9% |
| Historical Market Growth (CAGR 2019 to 2024) | 4.2% |
Market Factors - Growth, Barriers, and Opportunity Analysis
Regulatory Push toward Extended Producer Responsibility
Governments worldwide are increasingly enforcing EPR regulations, compelling manufacturers to take accountability for the entire lifecycle of their products, including post-consumer waste management. For instance, the European Union (EU)’s Waste Electrical and Electronic Equipment Directive (WEEE) mandates strict take-back and recycling targets, with penalties for non-compliance.
According to the United Nations Environment Programme (UNEP), approximately 53.6 million metric tons of e-waste were generated globally in 2019. These policies are driving companies to invest heavily in reverse logistics operations to meet legal requirements and mitigate environmental impact.
This regulatory environment is accelerating the adoption of circular supply chain practices, making reverse logistics a critical compliance and competitive strategy. The increased complexity of managing product returns and recycling streams demands advanced logistics planning, contributing significantly to market expansion.
Operational and Infrastructure Cost Barriers
Despite growing demand, the reverse logistics market growth is considerably hindered by the high operational and infrastructure costs. Managing reverse flows involves complex coordination across transportation, warehousing, and processing activities, often requiring customized facilities to handle sorting, refurbishment, or disposal.
For example, warehousing capital expenditures constitute up to 30% of total reverse logistics costs due to the need for specialized equipment and automation technology for sorting and repackaging. Transportation costs are further inflated by the fragmented and unpredictable nature of product returns, necessitating flexible routing and handling.
Compliance with diverse national regulations on waste handling imposes additional administrative burdens. These cost dynamics can limit the ability of smaller players to participate fully in the market and can also deter investment in emerging markets. Businesses must therefore optimize cost efficiency through technology and strategic partnerships to overcome these structural challenges.
Growth in Developing Economies and Circular Economy Adoption
Emerging economies of India, Southeast Asia, and several others across Latin America, Asia, and Africa hold bright growth prospects for reverse logistics, owing to rapid e-commerce expansion and increasing governmental focus on waste management.
India’s e-commerce market is expected to grow at a high CAGR through 2030, fueling demand for reverse logistics for handling returns and end-of-life products. Policy initiatives such as India’s Plastic Waste Management Rules are driving manufacturers to improve reverse supply chains and recycling programs.
Simultaneously, global trends toward circular economy models present lucrative opportunities for companies offering refurbishment, remanufacturing, and value recovery services.
Refurbishment and remanufacturing sub-segments are slated for substantial growth through 2032 on the back of rising consumer acceptance and cost benefits. Investments integrating IoT, blockchain, and AI for tracking product life cycles enhance transparency and efficiency, further unlocking growth possibilities.
Category-wise Analysis
Return Type Insights
The commercial returns segment is forecasted to command an estimated 43% of the reverse logistics market revenue share by 2025. This dominance is largely rooted in the unprecedented growth of e-commerce and omnichannel retail sectors worldwide, which routinely face elevated return rates of sold products in core consumer categories such as fashion and electronics.
Commercial returns encompass retail customer returns, B2B returns, and unsold goods, creating demand for robust reverse flow management, including product inspection, grading, refurbishment, and remanufacturing. Integrated logistics platforms combined with advanced warehouse automation are critical to handle the volatility and volume of returns efficiently.
The end-of-life returns segment is forecast to be the fastest-growing from 2025 to 2032. This growth is fueled primarily by increasing regulatory pressure for responsible product disposal and recycling, especially in electronics, automotive, and industrial equipment sectors.
Companies are embedding circular economy principles into product development and lifecycle management, which mandates effective reverse flow systems to maximize material recovery and environmental compliance. Growth in this segment is further supported by technological advancements in waste sorting and automated refurbishment, enabling cost-efficient recovery of end-of-life assets.
Service Type Insights
Transportation is likely to remain the largest segment, accounting for an estimated 38% share of the market in 2025. This leadership position is due to the unparalleled role transportation plays in connecting disparate collection points, warehouses, and refurbishing centers globally.
Transportation expenses often represent up to 40-50% of reverse logistics operational costs. Innovations in route optimization, real-time tracking, and the use of green logistics are continuously refining service efficiency. Increased cross-border trade complexities and last-mile delivery challenges are also strengthening the importance of tailored transportation solutions.
Reselling services are set to lead between 2025 and 2032, driven by rising consumer demand for sustainable consumption and cost-effective alternatives through refurbished and second-hand goods.
The accelerated adoption of e-commerce resale platforms, combined with growing brand initiatives to resell returned goods, is expanding this segment markedly. Advances in diagnostics, certification, and refurbishment techniques are boosting consumer confidence and market acceptance, elevating the profitability and strategic significance of reselling services within the reverse logistics domain.
End-user Industry Insights
The e-commerce vertical is poised to maintain its position as the largest end-user, projected to represent approximately 41% of the reverse logistics market share in 2025. The growth of this sector has been propelled by pandemic-induced shifts in consumer purchasing behavior, greater online product assortment, and liberal return policies by major online retailers.
High return rates in fashion and electronics have driven significant reverse flows requiring sophisticated reverse logistics infrastructure to manage sorting, inspection, processing, and reshipment. Real-time data analytics for return pattern prediction is becoming standard to optimize inventory and reduce costs.
The automotive sector is expected to be the fastest-growing end-user, driven by an increasing number of product recalls due to rigorous safety regulations. The rising adoption of EVs has introduced new reverse logistics challenges and opportunities related to battery recycling and parts remanufacturing.
The sector’s stringent quality and safety standards compel the adoption of integrated reverse supply chains, enhancing visibility and traceability in returns, facilitating compliance, risk reduction, and cost optimization.
Regional Insights
North America Reverse Logistics Market Trends
North America is anticipated to secure an estimated 34% of the reverse logistics market share in 2025, led predominantly by the U.S. The region’s leadership is bolstered by a mature e-commerce market and stringent environmental regulations from the U.S. Environmental Protection Agency (EPA) aimed at the product life cycle and packaging.
The U.S. also harbors a robust innovation ecosystem with wide-scale adoption of automation, AI, and blockchain technologies within supply chains, promoting transparency and efficiency.
The market is projected to grow at a healthy pace through 2032, supported by sustained investments in return logistics hubs, last-mile delivery networks optimized for returns, and green logistics solutions reducing the carbon emissions footprint. Regulatory frameworks such as the Toxic Substances Control Act and state-level electronic waste mandates drive demand for compliant reverse logistics services.
Competitive dynamics feature a cluster of globally integrated logistics providers and emerging startups focused on niche return segments such as pharmaceuticals and electronics, creating opportunities for strategic partnerships and technology-driven scaling.
Europe Reverse Logistics Market Trends
Europe is predicted to capture approximately 28% of the global market by 2025, with Germany, the U.K., France, and Spain as major contributors. The regional market benefits from harmonized regulatory oversight under EU directives such as the Circular Economy Action Plan and WEEE Directive, which impose strict end-of-life product handling, fostering demand for efficient and compliant reverse logistics solutions.
Aggressive developments in collection infrastructure, recycling facilities, and integrated IT solutions for real-time reverse supply chain management are favoring market growth.
Public-private partnerships and innovation funding under the Horizon Europe program have stimulated investment in sustainable logistics technologies, with focus areas including electric vehicle battery recycling and packaging waste reduction.
European markets are characterized by a mix of large multinational logistics companies and agile small & medium enterprises (SMEs) delivering specialized services, often leveraging collaborative logistics frameworks to optimize return flows. The competitive landscape favors providers with strong environmental credentials and digital integration capabilities.
Asia Pacific Reverse Logistics Market Trends
Asia Pacific is the fastest-expanding regional market between 2025 and 2032. China’s massive manufacturing and consumption base is a key driver, intensifying demand for reverse logistics in electronics, automotive, and consumer goods sectors.
India and ASEAN countries contribute via rapidly growing e-commerce markets, with Indian e-commerce expanding by over 20% annually, driving corresponding returns and reverse processing. Regulatory initiatives such as India’s Plastic Waste Management Rules and China’s waste import restrictions reinforce the necessity for efficient reverse supply chains.
The regional competitive environment is fragmented, featuring a growing number of third-party logistics providers investing in technology upgrades, automation, and network capacity expansion. Strategic investments focus on warehouse modernization, IoT-enabled tracking, and AI-based return prediction to reduce costs and improve service quality.
Government-backed policies encouraging circular economy adoption have also produced enormous opportunities for market entrants offering sustainable reverse logistics solutions.

Competitive Landscape
The global reverse logistics market structure exhibits moderate fragmentation, with the top 10 players collectively commanding roughly 45-50% of the market share.
Key players such as DHL Supply Chain, UPS Supply Chain Solutions, FedEx Logistics, DB Schenker, and Ryder leverage extensive global networks, vertically integrated service models, and advanced technology implementations to maintain leadership positions.
Concentration is increasing as these companies engage in strategic acquisitions and partnerships aimed at bolstering geographic coverage, service breadth, and technological capabilities focused on digitalization and sustainability.
Competitive positioning emphasizes comprehensive service integration spanning transportation, warehousing, refurbishment, and resale, augmented by data analytics and environmental compliance solutions. While large incumbents target multinational clients and large-scale operations, niche providers focus on specialized segments such as pharmaceuticals, electronics, or automotive to differentiate service offerings.
Key Industry Developments
- In September 2025, Ceva Logistics launched a reverse logistics solution for EV batteries across Europe, streamlining collection, transport, and recycling to enhance sustainability, enable efficient end-of-life management, recover resources, and ensure compliance with evolving environmental regulations.
- In July 2025, SEKO Logistics opened an 8,000-square-foot hub in Singapore’s Changi Free Trade Zone to strengthen Asia Pacific operations, enhancing e-commerce fulfillment, multimodal freight, and warehousing with real-time inventory, reverse logistics, and integration with Shopify and Lazada.
- In July 2025, GEODIS launched two reverse logistics solutions: a customer-friendly returns workflow portal for self-generated shipping labels, reducing costs and processing time, and a returns management module streamlining warehouse handling, inventory visibility, and reporting for reintegration, refurbishment, or disposal.
Companies Covered in Reverse Logistics Market
- DHL Supply Chain
- UPS Supply Chain Solutions
- FedEx Logistics
- DB Schenker Logistics
- Ryder System Inc.
- Kuehne + Nagel International AG
- XPO Logistics Inc.
- CEVA Logistics
- Nippon Express Co., Ltd.
- Expeditors International of Washington
- Penske Logistics
- Geodis SA
- Yusen Logistics
- DB Group
- Toll Group
Frequently Asked Questions
The global reverse logistics market is projected to reach US$827.1 Billion in 2025.
Proliferation of e-commerce operations, tightening sustainability regulations, and technological advancements in supply chain management are driving the market.
The reverse logistics market is poised to witness a CAGR of 4.9% from 2025 to 2032.
A rising number of consumer returns, stringent government mandates for product disposal and recycling, and an intensified focus on circular economy principles among both enterprises and regulators are key market opportunities.
DHL Supply Chain, UPS Supply Chain Solutions, and FedEx Logistics are a few of the key players in the market.


