


- Industrial Automation
- Pan Concrete Mixer Market
Pan Concrete Mixer Market Size, Share, and Growth Forecast, 2026- 2033
Pan Concrete Mixer Market by Capacity (<100 liters, 100–200 liters, 200–300 liters, >300 liters), Application (Residential construction, Commercial construction, Infrastructure, Industrial construction), Power Source (Diesel, Electric, Hybrid, and others), and Regional Analysis for 2026 – 2033
Pan Concrete Mixer Market Size and Trends Analysis
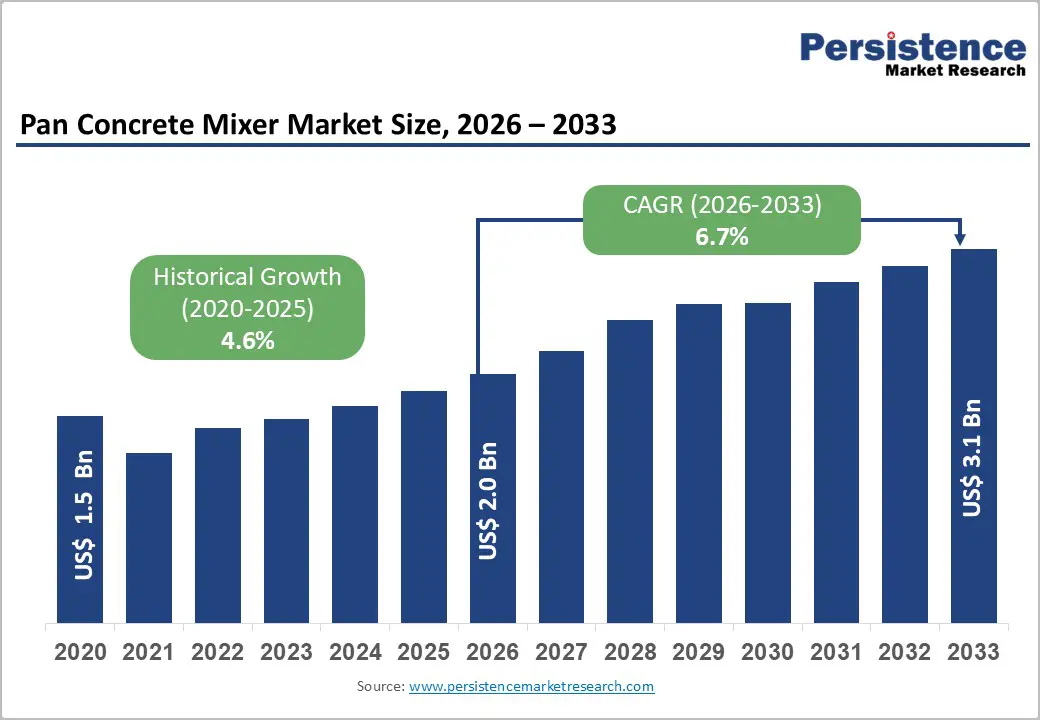
The global Pan Concrete Mixer market size was valued at US$ 1.5 billion in 2020 and reached US$ 2.0 billion in 2026, with projections to attain US$ 3.1 billion by 2033, expanding at a compound annual growth rate (CAGR) of 6.7% during the 2026-2033 forecast period. The market's expansion is driven by accelerating infrastructure development across emerging economies, rising residential and commercial construction activity, and the increasing adoption of mechanized mixing equipment in developing regions. Technological advancements in mixer efficiency and durability, combined with growing emphasis on operational safety and productivity, are reinforcing market expansion. The historical CAGR of 4.6% (2020-2025) underscores market acceleration, reflecting post-pandemic recovery and sustained capital investment in construction infrastructure globally.
Key Industry Highlights:
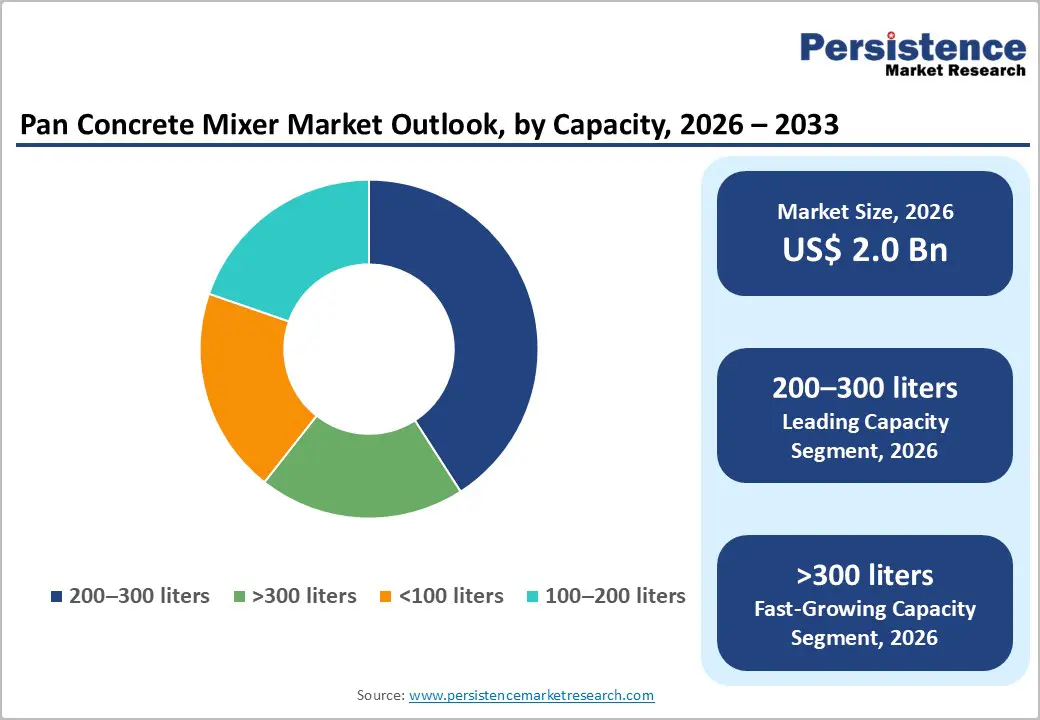
- Capacity Segment Leadership: The 200-300 liter capacity segment commands 30%+ market revenue share and dominance across diverse applications; however, the >300 liter capacity segment is the fastest-growing category at 7.3% CAGR, indicating structural shift toward larger-scale construction projects.
- Application Segment Dynamics: Residential construction maintains 40%+ revenue share as foundational market driver; commercial construction emerges as fastest-growing application with 7.4% CAGR, reflecting urbanization trends and retail/hospitality sector expansion across emerging economies.
- Power Source Transformation: Diesel maintains 50%+ market dominance through infrastructure reliability; electric-powered equipment represents fastest-growing power source at 7.7% CAGR, projected to expand from current 12-15% to 22-25% market share by 2033 through advancing battery technology and regulatory drivers.
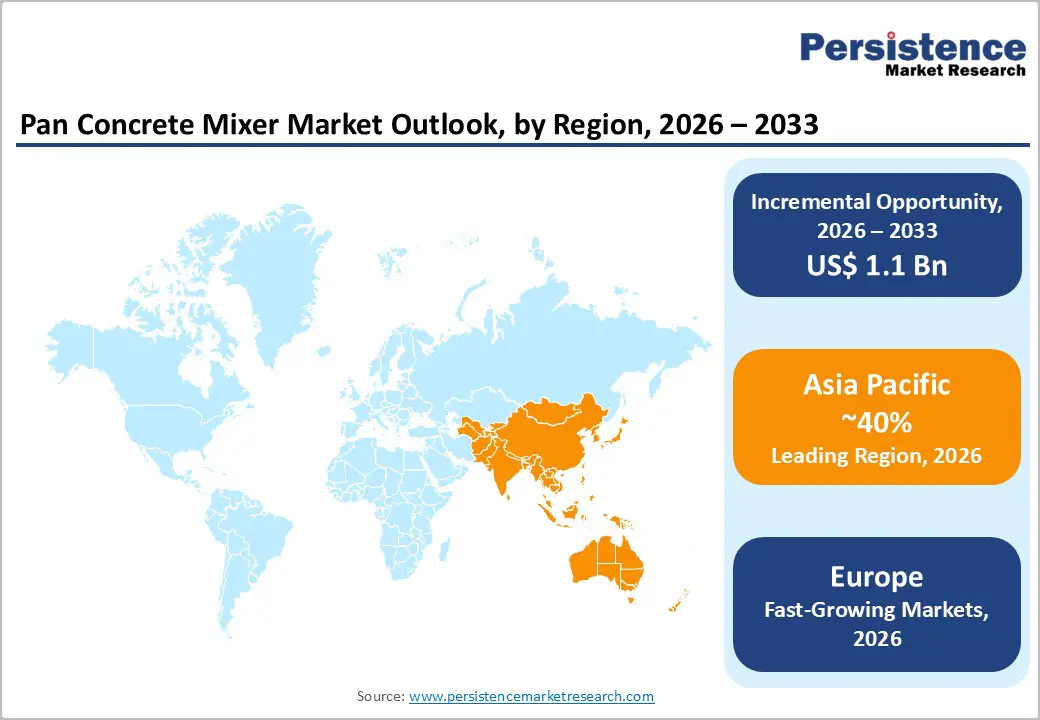
- Regional Leadership and Growth: Asia-Pacific commands 40%+ of global market revenue with 7.2-7.8% CAGR growth; Europe represents 22-24% of global market with accelerated 7.5% CAGR growth, driven by infrastructure modernization and environmental regulations; North America (15-16% of market) grows moderately at 5.2-5.8% CAGR, reflecting market maturity and equipment replacement cycles.
- Strategic Market Consolidation: Geographic expansion through regional manufacturing in India, Vietnam, and Indonesia; mergers and acquisitions targeting market consolidation; accelerated electric product platform development reflecting environmental regulation compliance and market demand evolution.
- Market Opportunity Assessment: Electric mixer technology and IoT integration represent premium-positioning growth opportunities valued at $150-300 million through 2033; emerging market expansion across Southeast Asia and Sub-Saharan Africa addresses underserved segments with minimal current penetration; technology convergence creating differentiation potential for manufacturers prioritizing innovation and digital capability integration.
| Global Market Attributes | Key Insights |
|---|---|
| Pan Concrete Mixer Market Size (2026E) | US$ 2.0 Bn |
| Market Value Forecast (2033F) | US$ 3.1 Bn |
| Projected Growth (CAGR 2026 to 2033) | 6.7% |
| Historical Market Growth (CAGR 2020 to 2025) | 4.6% |
Market Dynamics
Key Growth Drivers
Accelerating Infrastructure Modernization and Construction Activity
Global construction output is experiencing robust growth, with the World Bank and United Nations reporting substantial increases in infrastructure investments across developing nations. The Asia-Pacific region alone accounts for approximately 45% of global construction spending, with India, Vietnam, and Southeast Asian nations implementing massive infrastructure programs worth over $300 billion collectively. The United Nations estimates that emerging economies require $1.4 trillion annually in infrastructure investment through 2030 to achieve sustainable development targets. Pan concrete mixers represent essential equipment in this expansion, as mechanized mixing processes improve construction timelines by 25-35% compared to manual methods. Government initiatives such as India's "Housing for All" scheme and China's rural urbanization programs directly correlate to increased concrete mixer demand. The construction industry's productivity gains from mechanization translate into tangible cost reductions, making equipment investment financially justified for contractors and builders.
Market Restraining Factors
Environmental Regulations and Emissions Compliance Pressures
Increasingly stringent emissions regulations in developed markets and progressive implementation in emerging economies are creating compliance burdens for diesel-powered equipment manufacturers. The Euro V and Euro VI standards in Europe, combined with similar regulations in North America and rapidly advancing standards in China and India, require ongoing engineering investment and manufacturing process modifications. Compliance costs add approximately $2,000-5,000 to manufacturing expenses per unit, which manufacturers attempt to offset through pricing power. Stricter environmental regulations also accelerate the capital replacement cycle, as older equipment falls out of compliance. Contractors face potential operational restrictions in environmentally-sensitive regions, with several major cities implementing low-emission construction zones that restrict non-compliant equipment. These regulatory pressures create uncertainty regarding total cost of ownership and equipment utility lifespan.
Pan Concrete Mixer Market Trends and Opportunities
Electric and Hybrid Concrete Mixer Adoption for Premium Market Segments
Electric-powered concrete mixers represent the fastest-growing power source segment with a CAGR of 7.7%, supported by declining battery costs and improving charging infrastructure. Battery technology improvements have reduced electric mixer costs by 18-22% since 2020, with further declines anticipated as manufacturing scales. The electric mixer segment captures premium positioning, with equipment priced 15-25% above diesel equivalents but offering 40-50% lower operating costs and zero local emissions. Europe's electric mixer adoption rate has reached 35% of new sales, with North America advancing toward 28% penetration. The Asia-Pacific region, historically reluctant to adopt electric alternatives, is experiencing accelerating adoption driven by air quality concerns in major metropolitan areas and government incentive programs. India's promotion of electric construction equipment through reduced tariff rates and subsidized financing presents a market opportunity valued at $200-300 million through 2033. Hybrid solutions, combining diesel and electric power systems, address infrastructure limitations while reducing emissions by 60-70%.
Pan Concrete Mixer Market Insights and Trends
Capacity Insights
Concrete Mixer Capacity Trends Reflect Shifting Construction Scales And Contractor Investment Patterns
The capacity-based segmentation of the concrete mixer market highlights clear differences in demand dynamics, project scale, and contractor investment behavior. The 200–300 liters capacity segment dominates the market, accounting for over 30% of total revenue and functioning as the industry’s standard solution for a wide range of construction activities. Positioned between small residential jobs and mid-sized commercial projects, these mixers typically deliver 4–6 cubic meters of concrete per hour, allowing daily outputs of 20–50 cubic meters without deploying multiple units. Their affordability, generally ranging from USD 12,000 to 25,000, makes them highly accessible to small and medium-sized contractors. Strong adoption across Asia-Pacific and emerging European markets further reinforces this segment’s stability, supported by steady residential, commercial, and moderate-scale infrastructure development.
In contrast, the above-300 liters capacity segment represents the fastest-growing category, expanding at a CAGR of 7.3% and outpacing overall market growth. This momentum is driven by increasing project scale, particularly in large commercial developments and infrastructure programs. High-capacity mixers deliver 8–12 cubic meters per hour, significantly improving productivity and reducing labor intensity. Priced between USD 30,000 and 60,000, these units primarily attract large contractors, with demand concentrated in China, India, and Southeast Asia, reflecting a broader shift toward capital-intensive, high-output construction activity.
Application Insights
Residential Dominance and Rapid Commercial Expansion Shape Global Pan Concrete Mixer Demand
Residential construction remains the dominant application segment in the global pan concrete mixer market, accounting for over 40% of total revenue and forming the industry’s most stable demand base. This leadership reflects the universal need for housing across regions and the indispensable role of concrete mixing in residential projects ranging from single-family homes to large, multi-unit developments and affordable housing schemes. According to the United Nations, global housing demand is projected to rise by nearly 30% by 2030, with the sharpest increases concentrated in fast-urbanizing emerging economies. Residential projects typically rely on 100–300 liter capacity mixers, which fall within mid-range pricing brackets and ensure consistent, high-volume sales. Large-scale government housing programs in countries such as India, Indonesia, Nigeria, and Vietnam are expected to generate more than 50 million housing units by 2030, reinforcing the segment’s role as the market’s revenue anchor.
In contrast, commercial construction represents the fastest-growing application segment, expanding at a CAGR of 7.4%, outpacing overall market growth. This momentum is driven by accelerating urbanization, expanding retail and hospitality sectors, and rising demand for office space and logistics infrastructure. Commercial projects increasingly require higher-capacity mixers and continuous concrete supply, prompting a shift toward more advanced, large-scale mixing solutions. Rapid office development in Asia-Pacific and the growth of e-commerce warehouses underscore a structural move toward capital-intensive urban construction.
Power Source Insights
Diesel Dominance Persists as Electric Concrete Mixers Accelerate Global Transition Trends
Diesel-powered pan concrete mixers continue to dominate the global market, accounting for over 50% of total revenue, largely due to their compatibility with existing construction infrastructure and widespread adoption in emerging economies. Their ability to operate independently of grid electricity makes them highly reliable in regions with inconsistent or limited power supply. This advantage is particularly critical for remote and rural construction sites, which represent a significant share of infrastructure development across Asia-Pacific, Africa, and parts of emerging Europe. Additionally, diesel mixers benefit from mature, well-understood technology, extensive service networks, easy availability of spare parts, and a workforce already familiar with their operation. As a result, diesel’s market share is expected to remain relatively stable at 48–52% through 2033, despite increasing competition from alternative power sources.
In contrast, electric-powered concrete mixers are emerging as the fastest-growing segment, expanding at a CAGR of 7.7%. Growth is driven by falling battery costs, improving charging infrastructure, and tightening environmental regulations. Electric mixers offer 40–50% lower energy costs and significantly reduced maintenance requirements. Adoption is strongest in Europe and North America, with accelerating uptake in urban centers of emerging markets. Declining lithium-ion battery costs, falling 8–12% annually, are further enhancing economic viability. Consequently, electric mixers are projected to grow from 12–15% market share today to 22–25% by 2033.
Regional Insights and Trends
Asia-Pacific Leads Global Pan Concrete Mixer Market Through Infrastructure Expansion and Regulatory Momentum
Asia-Pacific dominates the global pan concrete mixer market, accounting for over 40% of worldwide revenue, valued at approximately USD 800–840 million in 2026. The region is projected to expand at a robust 7.2–7.8% CAGR through 2033, significantly outpacing global averages. China, India, and Southeast Asia together contribute nearly 85% of regional demand, supported by rapid urbanization, rising living standards, and sustained residential and commercial construction activity. Regional construction output is growing at 6.5–8.5% annually, with India emerging as the primary growth engine. India’s construction sector, expanding at 8.0–8.5% per year, is driving strong demand for cost-effective equipment, despite average selling prices remaining 35–45% lower than in developed markets. Southeast Asian countries such as Vietnam, Indonesia, and Thailand are witnessing construction growth of 9.0%, reflecting infrastructure expansion and urban development.
China’s relatively mature market continues to grow at 5.8–6.3% CAGR, supported by equipment modernization and stricter environmental regulations. India’s pan concrete mixer market is accelerating at 8.5–9.2% CAGR due to housing programs, Smart Cities initiatives, and highway development. Japan shows modest growth of 2.5–3.0% CAGR, driven mainly by replacement cycles and technological upgrades. Across ASEAN, over USD 500 billion in infrastructure investments through 2030, coupled with incentives for electric and low-emission equipment, are sustaining long-term demand, particularly within commercial construction, which represents 35–40% of regional market opportunities.
Europe’s Pan Concrete Mixer Market Driven by Infrastructure Modernization and Sustainability Regulations
Europe’s pan concrete mixer market accounts for approximately 22–24% of global revenue, valued at around USD 440–480 million in 2026, positioning the region as the world’s second-largest market. The market is projected to grow at a robust CAGR of about 7.5% through 2033, outpacing North America and closely aligning with global growth trends. This momentum is underpinned by large-scale infrastructure modernization in Central and Eastern Europe, renewed infrastructure development in Southeast Europe, and steady construction activity across Western Europe. Germany, the United Kingdom, France, Spain, and Italy collectively represent nearly 70% of regional market value, supported by overall European construction output growth of 4.5–5.2% annually, particularly in infrastructure, commercial real estate, and residential renovation.
Germany leads regional growth with annual construction expansion of 4.0–4.5%, driven by infrastructure spending, housing demand, and green building initiatives. The UK follows with 3.8–4.3% growth, supported by major transport and infrastructure projects despite economic uncertainty. France is growing at 3.5–4.0% through sustainable housing and urban renewal, while Spain and Italy are rebounding faster at 5.0–6.0%, aided by European funding. Stringent EURO VI emissions standards and EU Green Deal objectives are accelerating equipment modernization, with electric pan mixers already accounting for 30–35% of new sales in Western Europe. Manufacturers are responding with electric, hybrid, and IoT-enabled solutions, while higher regulatory and production costs keep equipment pricing 15–25% above emerging markets.
Pan Concrete Mixer Market Competitive Landscape
The pan concrete mixer market exhibits a moderately consolidated structure with 4-5 dominant international manufacturers controlling 50-60% of global market share, alongside 15-20 significant regional competitors and numerous localized manufacturers. Leading players in the global market include companies headquartered in Germany, Italy, China, and India, reflecting the geographic distribution of manufacturing and market demand. The market demonstrates characteristics of a capital equipment industry with moderate consolidation—higher than fragmented markets but less concentrated than monopolistic or duopolistic structures. Regional players maintain competitive positions through localized manufacturing, established distribution networks, and price optimization for regional market conditions. Market concentration is highest in North America and Europe (HHI > 2500, indicating significant concentration) and most fragmented across Asia-Pacific, where numerous regional manufacturers serve price-sensitive markets. Competitive differentiation emphasizes equipment reliability, total cost of ownership, technological capabilities, and service accessibility. Emerging market segments, particularly electric-powered equipment, attract new competitors and specialized manufacturers, reducing overall market concentration gradually.
Key Industry Developments
- In 2023, Volvo Trucks and CEMEX's landmark collaboration formalized in February 2023 introduced the world's first fully electric heavy-duty concrete mixer truck—the Volvo FMX electric platform deployed at Berlin's Spandau ready-mix facility.
Companies Covered in Pan Concrete Mixer Market
- Pledge International
- SM Engineering Works
- Primax Equipment
- Alankar Engineering Equipments Pvt. Ltd.
- EIE Instruments Private Limited
- Rising Industries
- Everon Impex
- Millennium Multi Trade Pvt. Ltd.
- Gayatri Engimech Pvt. Ltd.
- Global Impex
Frequently Asked Questions
The Pan Concrete Mixer market is estimated to be valued at US$ 2.0 Bn in 2026.
The key demand driver for the Pan Concrete Mixer market is accelerating construction activity driven by infrastructure development and urbanization.
In 2026, the Asia Pacific region will dominate the market with an exceeding 40% revenue share in the global Pan Concrete Mixer market.
Among applications, residential construction has the highest preference, capturing beyond 40% of the market revenue share in 2026, surpassing other applications.
Pledge International, SM Engineering Works, Primax Equipment, Alankar Engineering Equipments Pvt. Ltd., EIE Instruments Private Limited, and Rising Industries. There are a few leading players in the Pan Concrete Mixer market.


