Media Gateway Market Size, Share, and Growth Forecast for 2025 - 2032

Media Gateway Market by Type (Analog, Digital), by Technology (Wireline, Wireless, Hybrid), by Vertical (Telecommunication, BFSI, Healthcare, Government, Manufacturing, Transportation), and Regional Analysis

ID: PMRREP33447
Calendar

July 2025

298 Pages

Author : Rajat Zope

Media Gateway Market Size and Share Analysis

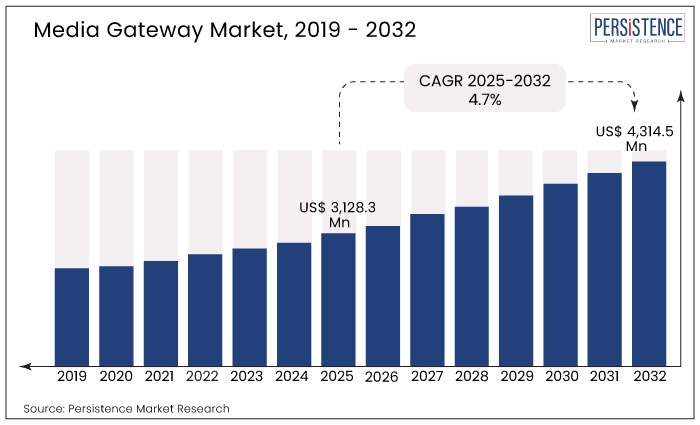
According to Persistence Market Research, the global media gateway market is expected to be worth US$ 3,128.3 million by 2025, growing at a CAGR of 4.7% from 2025 to 2032. According to projections, the market will reach US$ 4,314.5 Million by 2032.

The growing popularity of media streaming services and the penetration of smart devices are also expected to drive market growth. Market opportunities are anticipated to be generated by 5G technology and fiber-optic network deployment. Advanced media gateways, like virtual ones, are likely to be in high demand, which will create immense opportunities for players. Media gateways are, however, costly, which may restrict market development.

Increasing investments in communication networks, the growing popularity of cloud-based services, and the growing need for media gateways for integrating multiple VoIP networks are expected to drive the market for media gateways. Wired media gateways are commonly used by corporate and internet service providers to improve data security, performance, and reliability. In addition to VoIP access, wireline technology-based media gateways drive the market for media gateways. The media gateway market is likely to be dominated by these gateways during the forecast period.

media gateway market 2019-2032

Report Attributes Details

Media Gateway Market Size (2025)

US$ 3,128.3 Million

Media Gateway Projected Market Value (2032)

US$ 4,314.5 Million

Media Gateway Market CAGR (2025 to 2032)

4.7%

United States Market Absolute Dollar Growth

US$ 315.2 million

China Market Size (2025 to 2032)

US$ 291.1 million

2019 to 2024 Media Gateway Growth Analysis Compared to Demand Forecast from 2025 to 2032

According to Persistence Market Research, the media gateway market grew at a 4.2% CAGR from 2019 to 2024. Between 2023 and 2033, the market is expected to grow at a rate of 4.7%.

As IoT developments and 5G networks progress, the media gateway market in the telecommunications industry is expected to grow. Media gateways are being driven by increasing technological investments and internet penetration.

With the increasing complexity of the voice infrastructure, flexible and efficient solutions are needed to deal with a wide range of communications protocols and secure SIP trunks, which has led to an increase in the use of digital media gateways.

Growing demand for digital media services, such as streaming video, VoIP, IPTV, and video on demand, is expected to be the key driver of the future growth of the media gateway market. A large part of this can be attributed to the fact that multimedia applications have become increasingly popular across a variety of platforms, and the number of mobile phone users has increased greatly

What are the Market Factors Affecting the Media Gateway Market?

Increasing Adoption of Secure Network Connections are expected to Grow the Market

Market growth in the media gateway market is driven by rapid advancements in communications technologies, a growing subscriber base, and efficient information flow between disparate networks. The global telecommunication sector is also growing due to the increased use of media gateways, which offer a wide range of voice and multimedia services, replacement of costly legacy switching, and combining mobile and fixed networks.

Increasing numbers of data centers and advances in network processors drive the market for media gateway market. Growing operational expertise and a need for adequate gateway resources are driving growth in the media gateway market. The market for media gateway in the telecommunications industry is growing due to the increasing adoption of Internet Protocol (IP) phones and VoIP services.

With advanced management tools, media gateways can be integrated with modern architectural framework solutions, increasing the need for media gateways. Increasing demand for secure voice communications and high flexibility and redundancy are anticipated to drive market growth.

Country-wise Insights

How will the North American Media Gateway Market Grow?

Use of high-speed Internet to Drive Media Gateway in the United States

According to PMR, North America will dominate the global media gateway market. The North American media gateway industry is expected to reach US$ 1.36 billion by 2032.

With the advancement of digital platforms for portability and accessibility, it has seen a rise in 4G and 5G technologies, like smartphones, and the adoption of cloud computing. Digital media gateways are expected to grow significantly in North America over the forecast period. Streaming media, VoIP, and IPTV, among other digital media services, have contributed to this growth.

The United States media gateway market is expected to benefit from the growth of the Internet of Things (IoT). Furthermore, the growing demand for advanced services and the increase in the number of connected devices are expected to help boost the growth of the market over the next few years.

The advent of 5G technology is also expected to drive huge demand for digital media gateways in the region. In addition, the growing focus on improving user experience is expected to drive the growth of the United States media gateway market.

The United States is likely to account for 80% of all media gateway service deployment in 2025. Based on projected growth, the United States will grow by US$ 1.1 billion by 2032 at a CAGR of 3.6%. The United States will generate US$ 315.2 million in absolute dollar opportunities by 2032.

Why is Asia Pacific a Leading Market for Media Gateway?

With the Increasing Use of Mobile Devices, the Demand for Media Gateways is Expected to Increase

The media gateway market in the Asia Pacific is expected to reach US$ 836.4 million by 2032. According to the forecast, China will reach US$ 291.1 million by the end of the forecast period. The market will capture approximately 35% of the market by 2032.

Media gateway market growth is expected to be encouraging during the forecast period. In order to reduce costs related to technology infrastructure and streamline operations, both large and small companies are moving to cloud-based services. In the current market scenario, cloud-based solutions will have a significant impact on market growth.

With IP telephony currently serving as one of the most cost-effective options for connecting emerging markets, it is expected that the emerging markets in this area will contribute most to the long-term expansion of media gateways.

India, Japan, Singapore, and China are reliant on the Internet, and telecommunications services are expected to grow the market. Businesses can focus on their core business goals when these services are approved and adopted. Implementing 5G technology in countries like India, China, and Japan is increasing the adoption of the latest technologies. The market for media gateway in China is expected to hold a CAGR of 5.6% during the forecast period.

media gateway market by region 2019-2032

Category-wise Insights

Which Type of Media Gateway is Most Likely to Drive Global Market Growth?

Innovation in Growing Digital Technologies Demand to expand Scope for Media Gateway Market

By type, the market is segmented into analog and digital. Digital media gateways are expected to grow in the future. According to the forecast, the industry is expected to grow at a CAGR of 4.5% between 2025 and 2032.

Digital media gateways hold a huge share of the market mainly because they deliver media in an elegant manner, have low latency, and offer cloud security, which boosts the market. Along with converting streams between different interfaces using different technologies, the gateways can also allow video, voice, and fax services to be accessed.

Digital media gateways have also become increasingly sought after in an established voice infrastructure due to the growing demand for flexible and efficient solutions for a broad range of call-control protocols and secure SIP trunking.

As video streaming becomes more popular, and communication services become more sophisticated, there has been an increase in demand for high-quality streaming. 5G technology development, cloud-based service adoption, and the trend toward connected homes also contribute to the market growth.

The market continues to be driven by an increase in the need for services such as voice over internet protocol (VoIP) and multi-media messaging services (MMS). Moreover, the market for digital media gateways is expected to benefit from a rise in the demand for advanced digital media solutions and the emergence of new digital media technologies. With advances in artificial intelligence (AI) and machine learning (ML), the digital media gateway market is expected to grow significantly.

What Vertical is Expected to Drive Media Gateway Demand?

Telecommunications are Expected to Maintain Growth During the Forecast Period

The telecommunications segment grew at a 2.9% CAGR between 2019 and 2024. Over the next decade, this segment is expected to grow at a CAGR of 4.6%. With Voice Over Internet Protocol (VoIP) services becoming more popular, high-speed broadband services getting more popular, and cloud computing getting more popular, the telecommunications market is expected to grow big over the coming years.

Growing demand for these services has caused the telecommunication market to require reliable and efficient media gateways. VoIP and broadband services are delivered via media gateways, which are essential for VoIP services and for cable and DSL deployments.

Fiber optics, which are used for long-distance data transmission, will also drive the media gateway market since these gateways ensure data transmission over long distances. Moreover, wireless services and streaming media services will continue to grow in popularity, which will drive the demand for reliable and efficient media gateways. NEC Corporation, for instance, has developed a Charging Gateway Function (CGF) for DOCOMO to process billing information efficiently, which is becoming more sophisticated due to service menus becoming more sophisticated.

Competitive Landscape

Several technology companies are working together to develop media gateways. Market share will increase significantly for organizations with expansive product offerings, technological capabilities, and marketing efforts. Combining strengths can lead to innovative products from different companies.

Product improvement is most often achieved through research and development. Competitive advantage can be gained by improving existing products as well as introducing new ones.

  • In February 2023, Telefonica and Chairman of the Global Mobile Industry Alliance, Jose Maria Alvarez-Pallete, speaking during the Mobile World Congress (MWC) opening session, said that GSMA Open Gateway, an initiative of the Global Mobile Industry Alliance, bonds the mobile industry, big techs, and the digital future is being created by developers. As a result of the new digital era, Alvarez-Pallete urged companies to adopt a platform that is simpler than our businesses in order to survive. A platform such as the GSMA Open Gateway can be accessed.
  • In May 2023, Virsympay launched an innovative payment gateway as part of its global transaction processing offering. A wide range of payment options is provided by this cutting-edge technology, such as credit and debit card transactions, ACH payments, electronic checks, personal bank transfers, Apple Pay, Google Pay, and Virsympay wallets. With their recently launched gateway, Virsympay provides enterprises with a powerful tool that will help them expand and succeed.

Media Gateway Market Outlook by Category

By Type:

  • Analog
  • Digital

By Technology:

  • Wireline
  • Wireless
  • Hybrid

By Vertical:

  • Telecommunication
  • BFSI
  • Healthcare
  • Government
  • Manufacturing
  • Transportation

By Region:

  • North America
  • Europe
  • Asia Pacific
  • Middle East and Africa
  • Latin America

Companies Covered in Media Gateway Market

  • Nokia
  • AudioCodes
  • Avaya
  • Ribbon Communication
  • Ericsson
  • Huawei
  • Cisco Systems
  • Dialogic
  • Synway Information
  • ZTE
Frequently Asked Questions

The global media gateway market is expected to reach US$ 3,128.3 million by 2025.

The market is anticipated to grow to US$ 4,314.5 million by 2032.

The market is expected to grow at a CAGR of 4.7% during this period.

Growth is driven by media streaming servicessmart device penetration, and 5G deployment.

Wireline gateways are preferred for data security, performance, and VoIP integration, dominating the market.

Opportunities include virtual media gatewayscloud integration, and fiber-optic networks.

Media Gateway Industry Report Scope
Attribute Details

Forecast Period

2025 to 2032

Historical Data Available for

2019 to 2024

Market Analysis

US$ billion for value

Key Countries Covered

  • United States
  • Canada
  • Brazil
  • Mexico
  • Germany
  • United Kingdom
  • France
  • Spain
  • Italy
  • China
  • Japan
  • South Korea
  • Malaysia
  • Singapore
  • Australia
  • New Zealand
  • GCC Countries
  • South Africa
  • Israel

Key Market Segments Covered

  • Type
  • Technology
  • Vertical
  • Region

Key Companies Profiled

  • Nokia
  • AudioCodes
  • Avaya
  • Ribbon Communication
  • Ericsson
  • Huawei
  • Cisco Systems
  • Dialogic
  • Synway Information
  • ZTE

Customization & Pricing

Available upon Request

Related Reports

1. Executive Summary

    1.1. Global Market Outlook

    1.2. Demand-side Trends

    1.3. Supply-side Trends

    1.4. Technology Roadmap Analysis

    1.5. Analysis and Recommendations

2. Market Overview

    2.1. Market Coverage / Taxonomy

    2.2. Market Definition / Scope / Limitations

3. Market Background

    3.1. Market Dynamics

        3.1.1. Drivers

        3.1.2. Restraints

        3.1.3. Opportunity

        3.1.4. Trends

    3.2. Scenario Forecast

        3.2.1. Demand in Optimistic Scenario

        3.2.2. Demand in Likely Scenario

        3.2.3. Demand in Conservative Scenario

    3.3. Opportunity Map Analysis

    3.4. Product Life Cycle Analysis

    3.5. Supply Chain Analysis

        3.5.1. Supply Side Participants and their Roles

            3.5.1.1. Producers

            3.5.1.2. Mid-Level Participants (Traders/ Agents/ Brokers)

            3.5.1.3. Wholesalers and Distributors

        3.5.2. Value Added and Value Created at Node in the Supply Chain

        3.5.3. List of Raw Material Suppliers

        3.5.4. List of Existing and Potential Buyer’s

    3.6. Investment Feasibility Matrix

    3.7. Value Chain Analysis

        3.7.1. Profit Margin Analysis

        3.7.2. Wholesalers and Distributors

        3.7.3. Retailers

    3.8. PESTLE and Porter’s Analysis

    3.9. Regulatory Landscape

        3.9.1. By Key Regions

        3.9.2. By Key Countries

    3.10. Regional Parent Market Outlook

    3.11. Production and Consumption Statistics

    3.12. Import and Export Statistics

4. Global Media Gateway Market Analysis 2019-2024 and Forecast, 2025-2032

    4.1. Historical Market Size Value (US$ Mn) & Volume (Unit) Analysis, 2019-2024

    4.2. Current and Future Market Size Value (US$ Mn) & Volume (Unit) Projections, 2025-2032

        4.2.1. Y-o-Y Growth Trend Analysis

        4.2.2. Absolute $ Opportunity Analysis

5. Global Media Gateway Market Analysis 2019-2024 and Forecast 2025-2032, By Type

    5.1. Introduction / Key Findings

    5.2. Historical Market Size Value (US$ Mn) & Volume (Unit) Analysis By Type, 2019-2024

    5.3. Current and Future Market Size Value (US$ Mn) & Volume (Unit) Analysis and Forecast By Type, 2025-2032

        5.3.1. Analog

        5.3.2. Digital

    5.4. Y-o-Y Growth Trend Analysis By Type, 2019-2024

    5.5. Absolute $ Opportunity Analysis By Type, 2025-2032

6. Global Media Gateway Market Analysis 2019-2024 and Forecast 2025-2032, By Technology

    6.1. Introduction / Key Findings

    6.2. Historical Market Size Value (US$ Mn) & Volume (Unit) Analysis By Technology, 2019-2024

    6.3. Current and Future Market Size Value (US$ Mn) & Volume (Unit) Analysis and Forecast By Technology, 2025-2032

        6.3.1. Wireline

        6.3.2. Wireless

        6.3.3. Hybrid

    6.4. Y-o-Y Growth Trend Analysis By Technology, 2019-2024

    6.5. Absolute $ Opportunity Analysis By Technology, 2025-2032

7. Global Media Gateway Market Analysis 2019-2024 and Forecast 2025-2032, By Vertical

    7.1. Introduction / Key Findings

    7.2. Historical Market Size Value (US$ Mn) & Volume (Unit) Analysis By Vertical, 2019-2024

    7.3. Current and Future Market Size Value (US$ Mn) & Volume (Unit) Analysis and Forecast By Vertical, 2025-2032

        7.3.1. Telecommunication

        7.3.2. BFSI

        7.3.3. Healthcare

        7.3.4. Government

        7.3.5. Manufacturing

        7.3.6. Transportation

    7.4. Y-o-Y Growth Trend Analysis By Vertical, 2019-2024

    7.5. Absolute $ Opportunity Analysis By Vertical, 2025-2032

8. Global Media Gateway Market Analysis 2019-2024 and Forecast 2025-2032, By Region

    8.1. Introduction

    8.2. Historical Market Size Value (US$ Mn) & Volume (Unit) Analysis By Region, 2019-2024

    8.3. Current Market Size Value (US$ Mn) & Volume (Unit) Analysis and Forecast By Region, 2025-2032

        8.3.1. North America

        8.3.2. Latin America

        8.3.3. Europe

        8.3.4. Asia Pacific

        8.3.5. MEA

    8.4. Market Attractiveness Analysis By Region

9. North America Media Gateway Market Analysis 2019-2024 and Forecast 2025-2032, By Country

    9.1. Historical Market Size Value (US$ Mn) & Volume (Unit) Trend Analysis By Market Taxonomy, 2019-2024

    9.2. Market Size Value (US$ Mn) & Volume (Unit) Forecast By Market Taxonomy, 2025-2032

        9.2.1. By Country

            9.2.1.1. U.S.

            9.2.1.2. Canada

        9.2.2. By Type

        9.2.3. By Technology

        9.2.4. By Vertical

    9.3. Market Attractiveness Analysis

        9.3.1. By Country

        9.3.2. By Type

        9.3.3. By Technology

        9.3.4. By Vertical

    9.4. Key Takeaways

10. Latin America Media Gateway Market Analysis 2019-2024 and Forecast 2025-2032, By Country

    10.1. Historical Market Size Value (US$ Mn) & Volume (Unit) Trend Analysis By Market Taxonomy, 2019-2024

    10.2. Market Size Value (US$ Mn) & Volume (Unit) Forecast By Market Taxonomy, 2025-2032

        10.2.1. By Country

            10.2.1.1. Brazil

            10.2.1.2. Mexico

            10.2.1.3. Rest of Latin America

        10.2.2. By Type

        10.2.3. By Technology

        10.2.4. By Vertical

    10.3. Market Attractiveness Analysis

        10.3.1. By Country

        10.3.2. By Type

        10.3.3. By Technology

        10.3.4. By Vertical

    10.4. Key Takeaways

11. Europe Media Gateway Market Analysis 2019-2024 and Forecast 2025-2032, By Country

    11.1. Historical Market Size Value (US$ Mn) & Volume (Unit) Trend Analysis By Market Taxonomy, 2019-2024

    11.2. Market Size Value (US$ Mn) & Volume (Unit) Forecast By Market Taxonomy, 2025-2032

        11.2.1. By Country

            11.2.1.1. Germany

            11.2.1.2. U.K.

            11.2.1.3. France

            11.2.1.4. Spain

            11.2.1.5. Italy

            11.2.1.6. Rest of Europe

        11.2.2. By Type

        11.2.3. By Technology

        11.2.4. By Vertical

    11.3. Market Attractiveness Analysis

        11.3.1. By Country

        11.3.2. By Type

        11.3.3. By Technology

        11.3.4. By Vertical

    11.4. Key Takeaways

12. Asia Pacific Media Gateway Market Analysis 2019-2024 and Forecast 2025-2032, By Country

    12.1. Historical Market Size Value (US$ Mn) & Volume (Unit) Trend Analysis By Market Taxonomy, 2019-2024

    12.2. Market Size Value (US$ Mn) & Volume (Unit) Forecast By Market Taxonomy, 2025-2032

        12.2.1. By Country

            12.2.1.1. China

            12.2.1.2. Japan

            12.2.1.3. South Korea

            12.2.1.4. Malaysia

            12.2.1.5. Singapore

            12.2.1.6. Australia

            12.2.1.7. New Zealand

            12.2.1.8. Rest of APAC

        12.2.2. By Type

        12.2.3. By Technology

        12.2.4. By Vertical

    12.3. Market Attractiveness Analysis

        12.3.1. By Country

        12.3.2. By Type

        12.3.3. By Technology

        12.3.4. By Vertical

    12.4. Key Takeaways

13. MEA Media Gateway Market Analysis 2019-2024 and Forecast 2025-2032, By Country

    13.1. Historical Market Size Value (US$ Mn) & Volume (Unit) Trend Analysis By Market Taxonomy, 2019-2024

    13.2. Market Size Value (US$ Mn) & Volume (Unit) Forecast By Market Taxonomy, 2025-2032

        13.2.1. By Country

            13.2.1.1. GCC Countries

            13.2.1.2. South Africa

            13.2.1.3. Israel

            13.2.1.4. Rest of MEA

        13.2.2. By Type

        13.2.3. By Technology

        13.2.4. By Vertical

    13.3. Market Attractiveness Analysis

        13.3.1. By Country

        13.3.2. By Type

        13.3.3. By Technology

        13.3.4. By Vertical

    13.4. Key Takeaways

14. Key Countries Media Gateway Market Analysis

    14.1. U.S.

        14.1.1. Pricing Analysis

        14.1.2. Market Share Analysis, 2024

            14.1.2.1. By Type

            14.1.2.2. By Technology

            14.1.2.3. By Vertical

    14.2. Canada

        14.2.1. Pricing Analysis

        14.2.2. Market Share Analysis, 2024

            14.2.2.1. By Type

            14.2.2.2. By Technology

            14.2.2.3. By Vertical

    14.3. Brazil

        14.3.1. Pricing Analysis

        14.3.2. Market Share Analysis, 2024

            14.3.2.1. By Type

            14.3.2.2. By Technology

            14.3.2.3. By Vertical

    14.4. Mexico

        14.4.1. Pricing Analysis

        14.4.2. Market Share Analysis, 2024

            14.4.2.1. By Type

            14.4.2.2. By Technology

            14.4.2.3. By Vertical

    14.5. Germany

        14.5.1. Pricing Analysis

        14.5.2. Market Share Analysis, 2024

            14.5.2.1. By Type

            14.5.2.2. By Technology

            14.5.2.3. By Vertical

    14.6. U.K.

        14.6.1. Pricing Analysis

        14.6.2. Market Share Analysis, 2024

            14.6.2.1. By Type

            14.6.2.2. By Technology

            14.6.2.3. By Vertical

    14.7. France

        14.7.1. Pricing Analysis

        14.7.2. Market Share Analysis, 2024

            14.7.2.1. By Type

            14.7.2.2. By Technology

            14.7.2.3. By Vertical

    14.8. Spain

        14.8.1. Pricing Analysis

        14.8.2. Market Share Analysis, 2024

            14.8.2.1. By Type

            14.8.2.2. By Technology

            14.8.2.3. By Vertical

    14.9. Italy

        14.9.1. Pricing Analysis

        14.9.2. Market Share Analysis, 2024

            14.9.2.1. By Type

            14.9.2.2. By Technology

            14.9.2.3. By Vertical

    14.10. China

        14.10.1. Pricing Analysis

        14.10.2. Market Share Analysis, 2024

            14.10.2.1. By Type

            14.10.2.2. By Technology

            14.10.2.3. By Vertical

    14.11. Japan

        14.11.1. Pricing Analysis

        14.11.2. Market Share Analysis, 2024

            14.11.2.1. By Type

            14.11.2.2. By Technology

            14.11.2.3. By Vertical

    14.12. South Korea

        14.12.1. Pricing Analysis

        14.12.2. Market Share Analysis, 2024

            14.12.2.1. By Type

            14.12.2.2. By Technology

            14.12.2.3. By Vertical

    14.13. Malaysia

        14.13.1. Pricing Analysis

        14.13.2. Market Share Analysis, 2024

            14.13.2.1. By Type

            14.13.2.2. By Technology

            14.13.2.3. By Vertical

    14.14. Singapore

        14.14.1. Pricing Analysis

        14.14.2. Market Share Analysis, 2024

            14.14.2.1. By Type

            14.14.2.2. By Technology

            14.14.2.3. By Vertical

    14.15. Australia

        14.15.1. Pricing Analysis

        14.15.2. Market Share Analysis, 2024

            14.15.2.1. By Type

            14.15.2.2. By Technology

            14.15.2.3. By Vertical

    14.16. New Zealand

        14.16.1. Pricing Analysis

        14.16.2. Market Share Analysis, 2024

            14.16.2.1. By Type

            14.16.2.2. By Technology

            14.16.2.3. By Vertical

    14.17. GCC Countries

        14.17.1. Pricing Analysis

        14.17.2. Market Share Analysis, 2024

            14.17.2.1. By Type

            14.17.2.2. By Technology

            14.17.2.3. By Vertical

    14.18. South Africa

        14.18.1. Pricing Analysis

        14.18.2. Market Share Analysis, 2024

            14.18.2.1. By Type

            14.18.2.2. By Technology

            14.18.2.3. By Vertical

    14.19. Israel

        14.19.1. Pricing Analysis

        14.19.2. Market Share Analysis, 2024

            14.19.2.1. By Type

            14.19.2.2. By Technology

            14.19.2.3. By Vertical

15. Market Structure Analysis

    15.1. Competition Dashboard

    15.2. Competition Benchmarking

    15.3. Market Share Analysis of Top Players

        15.3.1. By Regional

        15.3.2. By Type

        15.3.3. By Technology

        15.3.4. By Vertical

16. Competition Analysis

    16.1. Competition Deep Dive

        16.1.1. Nokia

            16.1.1.1. Overview

            16.1.1.2. Product Portfolio

            16.1.1.3. Profitability by Market Segments

            16.1.1.4. Sales Footprint

            16.1.1.5. Strategy Overview

                16.1.1.5.1. Marketing Strategy

                16.1.1.5.2. Product Strategy

                16.1.1.5.3. Channel Strategy

        16.1.2. AudioCodes

            16.1.2.1. Overview

            16.1.2.2. Product Portfolio

            16.1.2.3. Profitability by Market Segments

            16.1.2.4. Sales Footprint

            16.1.2.5. Strategy Overview

                16.1.2.5.1. Marketing Strategy

                16.1.2.5.2. Product Strategy

                16.1.2.5.3. Channel Strategy

        16.1.3. Avaya

            16.1.3.1. Overview

            16.1.3.2. Product Portfolio

            16.1.3.3. Profitability by Market Segments

            16.1.3.4. Sales Footprint

            16.1.3.5. Strategy Overview

                16.1.3.5.1. Marketing Strategy

                16.1.3.5.2. Product Strategy

                16.1.3.5.3. Channel Strategy

        16.1.4. Ribbon Communication

            16.1.4.1. Overview

            16.1.4.2. Product Portfolio

            16.1.4.3. Profitability by Market Segments

            16.1.4.4. Sales Footprint

            16.1.4.5. Strategy Overview

                16.1.4.5.1. Marketing Strategy

                16.1.4.5.2. Product Strategy

                16.1.4.5.3. Channel Strategy

        16.1.5. Ericsson

            16.1.5.1. Overview

            16.1.5.2. Product Portfolio

            16.1.5.3. Profitability by Market Segments

            16.1.5.4. Sales Footprint

            16.1.5.5. Strategy Overview

                16.1.5.5.1. Marketing Strategy

                16.1.5.5.2. Product Strategy

                16.1.5.5.3. Channel Strategy

        16.1.6. Huawei

            16.1.6.1. Overview

            16.1.6.2. Product Portfolio

            16.1.6.3. Profitability by Market Segments

            16.1.6.4. Sales Footprint

            16.1.6.5. Strategy Overview

                16.1.6.5.1. Marketing Strategy

                16.1.6.5.2. Product Strategy

                16.1.6.5.3. Channel Strategy

        16.1.7. Cisco Systems

            16.1.7.1. Overview

            16.1.7.2. Product Portfolio

            16.1.7.3. Profitability by Market Segments

            16.1.7.4. Sales Footprint

            16.1.7.5. Strategy Overview

                16.1.7.5.1. Marketing Strategy

                16.1.7.5.2. Product Strategy

                16.1.7.5.3. Channel Strategy

        16.1.8. Dialogic

            16.1.8.1. Overview

            16.1.8.2. Product Portfolio

            16.1.8.3. Profitability by Market Segments

            16.1.8.4. Sales Footprint

            16.1.8.5. Strategy Overview

                16.1.8.5.1. Marketing Strategy

                16.1.8.5.2. Product Strategy

                16.1.8.5.3. Channel Strategy

        16.1.9. Synway Information

            16.1.9.1. Overview

            16.1.9.2. Product Portfolio

            16.1.9.3. Profitability by Market Segments

            16.1.9.4. Sales Footprint

            16.1.9.5. Strategy Overview

                16.1.9.5.1. Marketing Strategy

                16.1.9.5.2. Product Strategy

                16.1.9.5.3. Channel Strategy

        16.1.10. ZTE

            16.1.10.1. Overview

            16.1.10.2. Product Portfolio

            16.1.10.3. Profitability by Market Segments

            16.1.10.4. Sales Footprint

            16.1.10.5. Strategy Overview

                16.1.10.5.1. Marketing Strategy

                16.1.10.5.2. Product Strategy

                16.1.10.5.3. Channel Strategy

17. Assumptions & Acronyms Used

18. Research Methodology

Research Methodology Framework for Market Research Excellence

At Persistence Market Research, we implement a comprehensive, validated, and multi-dimensional approachto market analysis that delivers actionable insights across complex market landscapes. Our methodology combines the analytical rigor of leading consulting firms with innovative research techniques, ensuring robust market assessments that guide strategic decision-making with confidence.

Core Research Philosophy

Our methodology is built on four foundational pillars:

Research Philosophy Image

At Persistence Market Research, our methodology is designed to transcend conventional market studies by combining analytical rigor, multi-source validation, and future-focused insights.

We integrate advanced research frameworks, robust data collection strategies, cutting-edge analytics, and innovative technologies to deliver a 360-degree view of complex markets.

We integrate advanced research frameworks, robust data collection strategies, cutting-edge analytics, and innovative technologies to deliver a 360-degree view of complex markets.

Each stage spanning from strategic scoping and hypothesis-building to competitive intelligence, quality validation, and actionable recommendations is engineered to provide clients with unmatched clarity, precision, and confidence in decision-making.

By embedding innovation and technology at the core, our approach ensures that insights are not only comprehensive but also predictive, empowering businesses to seize opportunities, mitigate risks, and achieve sustainable growth

Research Philosophy Image

Capturing Key Information and Events

During this phase, key research objectives focus on essential information and data points for assessing the market, including:

Research Philosophy Image

TAM-SAM-SOM Framework Implementation

We employ both top-down and bottom-up approaches to ensure accurate market sizing.

Top-Down Market SizingBottom-Up Market Sizing
Universe Definition: Total global/regional market identificationUnit Economics: Average transaction values, purchase frequencies, customer lifecycle
Segmentation Filters: Geographic, demographic, and behavioral constraintsCustomer Segmentation: Detailed buyer persona development and sizing
Market Share Analysis: Competitive landscape assessment and share allocationPenetration Analysis: Market penetration rates by segment and geography
Growth Rate Application: Historical trends and forward-looking growth assumptionsScaling Methodology: Extrapolation techniques with confidence intervals

Validation & Cross-Verification

  • Triangulation: Comparing top-down and bottom-up results for consistency
  • Sensitivity Analysis: Testing key assumptions and parameter variations
  • Peer Benchmarking: Comparison with analogous markets and industry benchmarks
  • Expert Review: External validation through industry specialist consultation

Research Philosophy Image

Forecasting & Projection Modeling

Our proprietary forecasting models incorporate multiple variables and scenarios.

Forecasting Components

  • Historical Trend Analysis: 10-year historical growth patterns and cyclical variations
  • Driver-Based Modeling: Economic indicators, demographic shifts, technology adoption
  • Scenario Planning: Base case, optimistic, and conservative projections
  • Monte Carlo Simulations: Probability-weighted outcomes and risk assessments

Model Validation

  • Back-Testing: Historical accuracy assessment over 3–5-year periods
  • Cross-Validation: Multiple modeling approaches for result comparison
  • External Benchmarking: Comparison with established market forecasts
  • Continuous Calibration: Quarterly model updates based on new data

Comprehensive Data Collection Strategy

Our secondary research phase establishes a robust knowledge base utilizing diverse, credible sources.

Secondary Data Sourcess

  • Industry Publications & Reports
  • Government & Regulatory Data
  • Financial Intelligence (filings & reports)
  • Academic Research & Digital Intelligence

Quality Assurance Protocol

  • Source credibility assessment and publication date validation
  • Data consistency checks across multiple sources
  • Bias identification and neutralization techniques
  • Information gap tracking for primary research prioritization

Research Philosophy Image

Primary Research Excellence

Our primary research methodology employs best-in-class techniques to capture unique market insights.

Quantitative Research Methods

  • Large-Scale Surveys: Statistically representative samples with 95% confidence intervals
  • Survey Methodology: Multi-channel deployment (online, telephone, in-person)
  • Question Architecture and Response Optimization

Qualitative Research Methods

  • Executive Interviews
  • Focus Groups
  • Expert Consultations

Quality Assurance & Validation Framework

Multi-Stage Validation Process

  • Source Verification and Consistency Testing
  • Outlier Detection and Bias Assessment
  • Peer Review Process and External Validation
  • Sensitivity Analysis and Confidence Intervals

Research Philosophy Image

Methodology Validation & Credibility

Our research methodology has been extensively validated through:

  • Academic Partnerships: Collaborations with top-tier business schools and research institutions
  • Client Success Stories: Documented case studies demonstrating research impact and ROI
  • Continuous Benchmarking: Performance comparison with leading global research firms

This comprehensive methodology framework positions Persistence Market Research at the forefront of market intelligence, combining the analytical sophistication of top-tier consulting firms with innovative research techniques. Our approach ensures that every market assessment delivers precise, actionable, and strategically valuable insights that drive business success in competitive market environments.

Ready to unlock your market potential? Contact our research experts to discuss how our validated methodology can transform your strategic decision-making with data-driven market intelligence.

Copyright © 2026 Persistence Market Research. All Rights Reserved

Connect With Us -