


- Automotive Components & Materials
- Gearbox and Gear Motors Market
Gearbox and Gear Motors Market Size, Share, and Growth Forecast 2026 - 2033
Gearbox and Gear Motors Market by Product Type (Gearboxes, Gear Motors), by Gear Type (Helical Gear, Spur Gear, Bevel Gear, Others), by Distribution Channel (OEM Sales, Aftermarket), by End-Use (Manufacturing, Automotive, Food & Beverage, Construction & Mining, Oil & Gas, Marine, Renewable Energy), and Regional Analysis, 2026 - 2033
Gearbox and Gear Motors Market Size and Trend Analysis
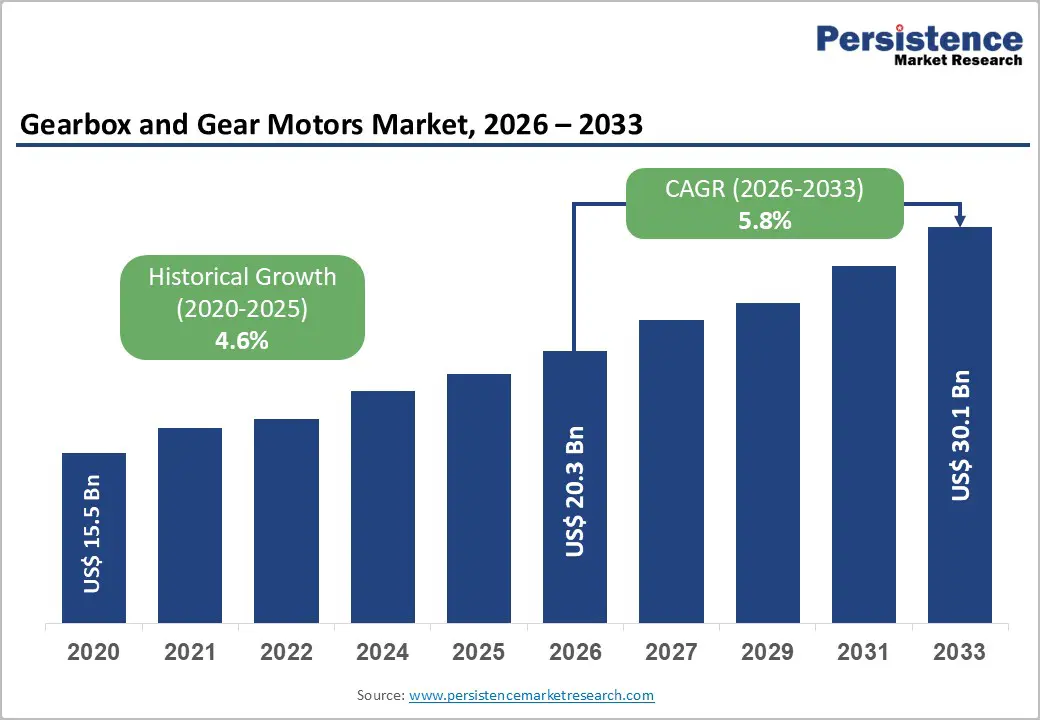
The global gearbox and gear motors market size is likely to be valued at US$ 20.3 billion in 2026 and is expected to reach US$ 30.1 billion by 2033, growing at a CAGR of 5.8% during the forecast period from 2026 to 2033.
The market expansion is fundamentally driven by accelerating industrial automation investments, with global industrial automation spending reaching US$ 215 Billion in 2024, directly boosting demand for high-performance gearboxes and gear motors.
Key Industry Highlights:
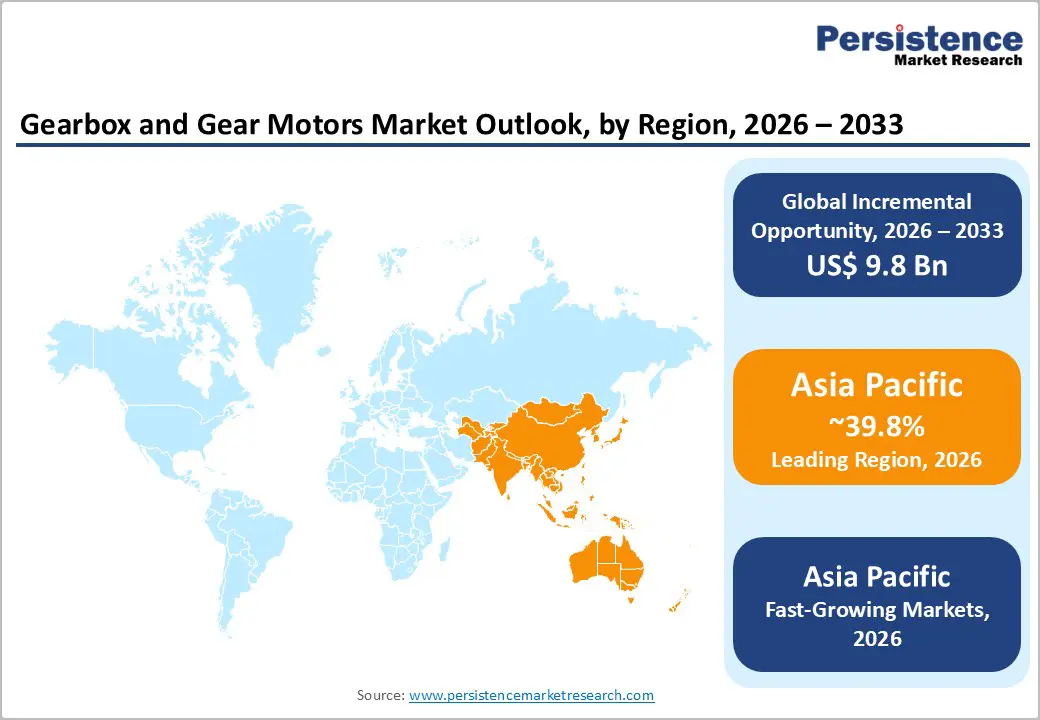
- Leading Region: Asia Pacific dominates the gearbox and gear motors market with 38-39.87% global market share, and renewable energy infrastructure development creating sustained demand for specialized transmission systems across industrial, automotive, and power generation sectors.
- Fastest Growing Region: Asia Pacific emerges as the fastest-growing regional market with rising CAGR of 6.4%, driven by large-scale infrastructure development projects, mineral extraction operations requiring heavy-duty industrial gearboxes, and increasing renewable energy investments supporting long-term economic diversification strategies in oil and gas-dependent economies.
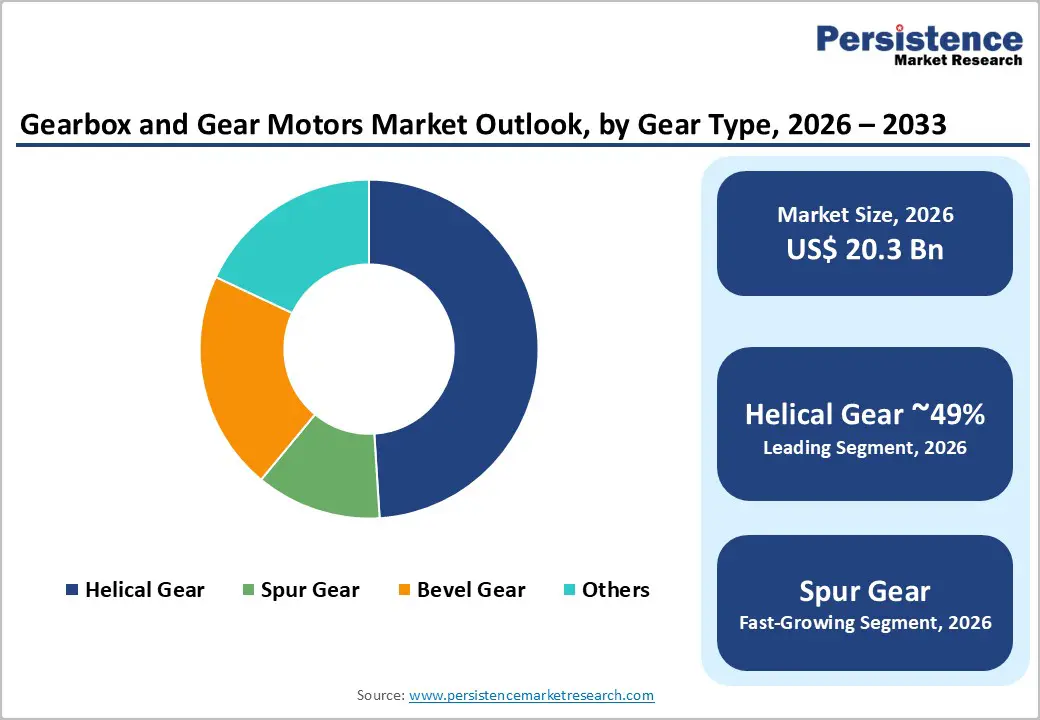
- Dominant Segment: Helical gearboxes command 48.6% market share across all categories, dominating due to superior load-carrying capacity, exceptional efficiency in heavy-duty continuous applications, and widespread adoption across manufacturing, mining, and power generation sectors requiring reliable, low-maintenance power transmission.
- Fastest Growing Segment: Smart gearboxes with IoT and predictive maintenance capabilities represent the fastest-growing technology segment, with adoption projected to reach 35% of new installations by 2030, driven by ability to reduce equipment failure rates by 70%, maintenance costs by 25%, and operational downtime through real-time monitoring and AI-powered diagnostics.
- Key Market Opportunity: Electric vehicle powertrain evolution creates significant growth opportunities, with EV production reaching 12.4 million units in 2024, generating substantial demand for lightweight, high-efficiency gearbox systems optimizing battery performance, range extension, and vehicle responsiveness in next-generation electrified mobility solutions.
| Key Insights | Details |
|---|---|
| Gearbox and Gear Motors Market Size (2026E) | US$ 20.3 Billion |
| Market Value Forecast (2033F) | US$ 30.1 Billion |
| Projected Growth CAGR (2026 - 2033) | 5.8% |
| Historical Market Growth (2020 - 2025) | 4.6% |
Market Dynamics
Drivers - Rapid expansion of industrial automation and robotics is driving sustained global demand for high-precision and energy-efficient gearbox systems
The global manufacturing industry is witnessing rapid growth in automation, with more than 500,000 industrial robots installed annually across automotive, electronics, and consumer goods sectors. This widespread adoption is reshaping production environments by improving efficiency, accuracy, and output consistency. Gearboxes play a vital role in robotic systems by enabling precise torque transmission, controlled speed variation, and smooth mechanical motion. They are essential components in robotic arms, collaborative robots (cobots), packaging machinery, and automated material handling systems.
Advanced gearbox technologies help manufacturers achieve high positioning accuracy, reduced backlash, and improved energy efficiency, which are critical requirements in modern factories. This automation trend is particularly strong in China, where manufacturers are aggressively improving productivity and operational efficiency. As industries such as semiconductor fabrication, automotive assembly, and electronics manufacturing continue to expand, sustained demand for high-performance gearbox solutions is expected across the region.
Accelerating global renewable energy investments, especially in wind power, are significantly boosting demand for heavy-duty and reliable gearbox solutions
The global transition toward clean and sustainable energy is significantly increasing demand for specialized gearbox systems, particularly within the wind power sector. In 2024 alone, more than 78,000 wind turbines were installed worldwide, creating strong requirements for durable and high-capacity gearboxes.
Growth is driven by rising renewable energy capacity and large-scale offshore wind farm projects. Beyond wind energy, hydroelectric plants and emerging concentrated solar power systems also depend on heavy-duty gearboxes capable of handling fluctuating loads and extreme operating environments. Government-backed renewable energy targets across Europe, North America, and Asia Pacific are accelerating infrastructure investments, directly supporting long-term demand for reliable, efficient, and technologically advanced gearbox systems.
Restraints - Rising trade tariffs and supply chain uncertainty are increasing production costs and limiting long-term investment confidence among gearbox manufacturers
In 2025, rising global trade tariffs have created notable cost challenges for gearbox manufacturers. Baseline import duties of around 10%, along with higher tariffs of up to 25% on steel and aluminum, have significantly increased material expenses. These metals are essential for gearbox housings and internal components, making manufacturers highly exposed to price fluctuations. As a result, supply chains have been disrupted, forcing companies to reevaluate sourcing strategies and absorb higher production costs, which places pressure on operating margins.
Uncertainty regarding the duration and structure of tariff policies further complicates long-term planning decisions. Many manufacturers are delaying investments in plant expansion and equipment modernization due to unclear cost outlooks. Import-dependent producers face competitive disadvantages compared to localized manufacturers, thereby slowing overall market momentum and limiting growth potential in certain regions.
Fluctuating raw material prices and skilled labor shortages continue to challenge gearbox manufacturing efficiency and cost stability worldwide
Gearbox manufacturers continue to face challenges from unstable steel and specialty alloy prices, which directly affect production costs and pricing strategies. Precision gearbox manufacturing requires high-grade materials, advanced machining, and strict quality control standards, limiting supplier availability to a relatively small and specialized ecosystem. This increases procurement complexity and reduces flexibility during periods of material shortages.
In addition, skilled labor shortages in areas such as precision engineering, gear cutting, and heat treatment are becoming more pronounced, particularly in developed markets. These shortages increase wage costs and production lead times. To overcome these challenges, manufacturers are investing heavily in workforce training programs and factory automation solutions. However, these initiatives require substantial capital investment, which can restrict smaller players. Together, material volatility and labor constraints continue to act as structural restraints on market expansion.
Opportunity - Integration of IoT-enabled smart gearboxes and predictive maintenance technologies is unlocking major efficiency gains and long-term revenue opportunities
Smart gearboxes equipped with IoT sensors and real-time monitoring capabilities present a major growth opportunity for the market. Predictive maintenance technologies have demonstrated the ability to reduce equipment failure rates by nearly 70% while lowering maintenance costs by approximately 25%. These systems also help extend gearbox operating life by nearly 30%, especially in demanding industrial environments.
Leading manufacturers such as Siemens AG, SEW-EURODRIVE, and Bonfiglioli are actively investing in AI-driven diagnostic tools and cloud-based monitoring platforms. These solutions provide operators with real-time visibility into equipment health, enabling faster decision-making and reduced unplanned downtime. The smart gearbox segment is expected to represent nearly 35% of all new installations by 2030. This shift creates strong revenue potential for manufacturers offering integrated sensors, advanced analytics software, and industry-specific predictive algorithms.
Rapid growth in electric vehicle production is creating strong demand for lightweight, high-efficiency gear systems optimized for electric drivetrains
The rapid global transition toward electric mobility is creating transformative opportunities for specialized gearbox systems. Unlike traditional vehicles, electric powertrains require lightweight, compact, and highly efficient gearboxes to optimize torque delivery and maximize battery range. Global electric vehicle production reached 12.4 million units in 2024, reflecting strong year-over-year growth of 25%.
This upward trend is expected to continue as automakers expand electric offerings across passenger and commercial vehicle segments. Companies such as ZF Friedrichshafen are developing advanced two-speed electric axles designed to achieve efficiency levels of up to 97% by 2027. Demand extends beyond passenger cars to electric buses, trucks, and delivery vehicles. This evolution is driving increased adoption of sealed planetary gearboxes and custom-engineered transmission systems optimized for electric propulsion performance and long-term durability.
Category-wise Analysis
Product Type Insights
The gearbox segment dominates the gearbox and gear motors market, accounting for approximately 54.2% of total revenue in 2025. This dominance reflects the essential role gearboxes play in speed reduction, torque amplification, and mechanical efficiency across heavy industrial applications such as mining equipment, power generation systems, and material handling machinery. Within this segment, modular gearboxes are gaining rapid traction. Their flexible design allows quick customization and easy retrofitting, making them ideal for smart manufacturing environments requiring frequent production changeovers. The gear motor segment contributes 45.8% of overall market revenue. Integrated motor-gearbox units are increasingly preferred in factory automation and robotics due to their compact design, reduced installation complexity, and improved system efficiency. This balanced growth supports strong demand across both product categories.
Gear Type Insights
The helical gear segment holds the largest market share at 48.6%, driven by its high load-bearing capacity, smooth power transmission, and superior efficiency in continuous-duty applications. These characteristics make helical gearboxes widely suitable for manufacturing lines, conveyors, and heavy machinery operations where vibration reduction and reliability are critical. Alloy steel remains the preferred material, accounting for 44% market share, due to its excellent strength-to-weight ratio and durability under high-torque conditions.
Spur gears maintain a 28.6% share, supported by cost efficiency, simple manufacturing processes, and strong availability for standardized applications. Meanwhile, bevel gears hold approximately 25% market share and remain essential for applications requiring angular power transmission. These include automotive drivetrains, aerospace systems, and marine propulsion units where directional force transfer is a key requirement.
Distribution Channel Insights
OEM sales channels dominate the market with an 83.38% share, reflecting strong long-term supply relationships between gearbox manufacturers and original equipment producers. Industries such as automotive, industrial machinery, and renewable energy prefer integrated sourcing models to ensure performance consistency and system compatibility. Aftermarket sales account for 16.62% of total revenue and are steadily expanding as operators focus on equipment maintenance, efficiency upgrades, and modernization of aging infrastructure.
Demand for replacement gearboxes is increasing across manufacturing plants, ports, and power generation facilities. The marine gearbox market, valued at US$ 6.8 billion in 2023, plays a significant role in aftermarket growth. Global shipping fleets require periodic gearbox replacements and retrofits to comply with efficiency standards and extend vessel lifespan. This trend is strengthening service-based revenue models across the industry.
Regional Insights
North America Gearbox and Gear Motors Market Trends
North America accounts for approximately 25% of the global gearbox and gear motor market, supported by strong investments in industrial automation, advanced manufacturing, and renewable energy infrastructure. The United States leads regional demand due to its established automotive manufacturing base and growing adoption of smart factory technologies. Manufacturers are increasingly integrating IoT-enabled drive systems to improve productivity and reduce unplanned downtime. Renewable energy expansion, particularly offshore wind projects along the Atlantic and Pacific coasts, is generating demand for marine-grade and variable-speed gearbox systems.
In response to 2025 tariff pressures, companies are expanding domestic manufacturing capacity and adopting nearshoring strategies in Mexico under USMCA agreements. Additionally, rising investments in electric vehicle production and battery plants are driving incremental demand for precision gearboxes used in automated assembly and logistics operations.
Europe Gearbox and Gear Motors Market Trends
Europe contributes between 28% of global market share, with Germany leading the region at 28.2% due to its strong automotive industry and advanced precision engineering capabilities. Major players such as Siemens AG, SEW-EURODRIVE, and ZF Friedrichshafen continue to advance gearbox technologies for electric vehicles, renewable energy, and Industry 4.0 applications.
Supportive regulatory frameworks under the EU Green Deal are accelerating adoption of energy-efficient and low-emission drive systems. France and Italy contribute approximately 16% of regional demand, driven by industrial modernization and strong packaging machinery production respectively. The UK is strengthening domestic manufacturing post-Brexit, focusing on high-value aerospace and service-oriented business models. More than 60% of European automation systems utilize enclosed gear designs, emphasizing durability and minimal maintenance requirements.
Asia Pacific Gearbox and Gear Motors Market Trends
Asia Pacific dominates the global market with a share ranging from 38%, led by China, which represents 36.20% of regional demand. Growth is driven by large-scale industrial automation, rapid electric vehicle manufacturing expansion, and renewable energy development. Chinese manufacturers are increasing production capacity for EV-specific gearboxes and precision planetary drives while strengthening competitiveness through cost efficiency and automation.
India is emerging as a key secondary growth market, registering a CAGR of 5.8% supported by infrastructure expansion and automotive manufacturing growth. Japan and South Korea remain global leaders in precision planetary and harmonic drive technologies used in robotics and semiconductor equipment. Offshore wind expansion across Asia Pacific is further boosting demand for heavy-duty gearboxes. The region is expected to contribute over 45% of incremental global growth through 2033.
Competitive Landscape
The global gearbox and gear motor market demonstrates moderate consolidation, with the top 20 companies accounting for maximum share of total revenue. This structure supports healthy competition without extreme market concentration. Siemens AG maintains a strong leadership position through its Flender division, offering a broad portfolio supported by advanced digital monitoring capabilities.
SEW-EURODRIVE differentiates itself through modular design platforms and high customization flexibility, supported by a strong global service network. Bonfiglioli focuses on renewable energy and mobile machinery applications, strengthening its presence in high-growth segments. Leading manufacturers are investing in additive manufacturing and digital-twin simulation, reducing product development timelines by nearly 40%. R&D efforts emphasize lightweight materials, energy-efficient designs, and IoT-enabled platforms. Strategic partnerships with automation software providers are enabling companies to deliver integrated motion-control solutions rather than standalone components.
Key Developments:
- In June 2024: Siemens Mobility inaugurated a new gearbox production line at its Cornellà, Spain facility, boosting capacity to manufacture approximately 500 heavy rail drive gearboxes annually to support European rail electrification and public transportation modernization initiatives.
- In November 2024: ZF Friedrichshafen announced a strategic co-development agreement with a leading Chinese electric vehicle manufacturer to develop two-speed electric axles targeting 97 percent efficiency, with products slated for commercial launch in 2027, accelerating e-mobility drivetrain innovation.
- In September 2025: SEW-Eurodrive launched an advanced modular planetary gearbox platform featuring integrated IO-Link sensors and 18 configurable gear ratios across 60-200 mm frames, enabling rapid customization for robotics, precision automation, and smart manufacturing applications.
Companies Covered in Gearbox and Gear Motors Market
- Siemens AG
- ABB Limited
- Bonfiglioli S.p.A.
- Dunkermotoren
- Elecon Engineering Co. Ltd.
- Flender International GmbH
- NGL
- Nidec Corporation
- NORD Drivesystems Group
- Portescap
- Regal Rexnord Corporation
- SEW-EURODRIVE GmbH & Co. KG
- Shanthi Gears Limited
- Sumitomo Heavy Industries Ltd.
- ZF Friedrichshafen AG
- Dana Incorporated
- Emerson Electric Co.
- GKN Plc
Frequently Asked Questions
The global gearbox and gear motors market is expected to reach US$ 30.1 billion by 2033, growing at a 5.8% CAGR from 2026.
Key demand drivers include industrial automation expansion, renewable energy installations, rising robotics adoption, electric vehicle production growth, and infrastructure development.
Helical gearboxes dominate the market, supported by high efficiency and load capacity, while planetary gearboxes are the fastest-growing due to robotics demand.
Asia Pacific leads the global market, driven by large-scale industrial automation, electric vehicle manufacturing expansion, and renewable energy development.
The key opportunity lies in IoT-enabled smart gearboxes and electric vehicle powertrain applications requiring high-efficiency and lightweight transmission systems.
Major players include Siemens AG, SEW-EURODRIVE, Bonfiglioli, ABB, ZF Friedrichshafen, Nidec, and Sumitomo Heavy Industries.


