Sustainable Aviation Fuel Market Size, Share, and Growth Forecast 2025 - 2032

Sustainable Aviation Fuel Market by Feedstock (First Generation Feedstock, Second Generation Feedstock, Third Generation Feedstock, Other Renewable Feedstock), by Technology (Hydrotreated Esters and Fatty Acids, Fischer Tropsch, Alcohol to Jet, eFuels), by Aircraft Type (Commercial, Military, Business & General, Unmanned Aerial Vehicles), by Regional Analysis, 2025 - 2032

ID: PMRREP35851
Calendar

November 2025

183 Pages

Author : Satender Singh

Sustainable Aviation Fuel Market Size and Trend Analysis

The global sustainable aviation fuel market size is likely to value at US$ 2.1 billion in 2025 and is projected to reach US$ 25.2 billion by 2032, growing at a CAGR of 42.6% between 2025 and 2032.

This remarkable growth trajectory is driven by stringent aviation decarbonization mandates and the aviation industry’s commitment to achieve net-zero carbon emissions by 2050, as endorsed by the International Civil Aviation Organization (ICAO) and International Air Transport Association (IATA).

The ReFuelEU Aviation regulation in the European Union, requiring a minimum 2% SAF blend starting in 2025 and escalating to 6% by 2030, alongside aggressive targets in the United Kingdom mandating 9.5% SAF by 2030, are creating unprecedented demand for sustainable aviation fuels.

Key Market Highlights

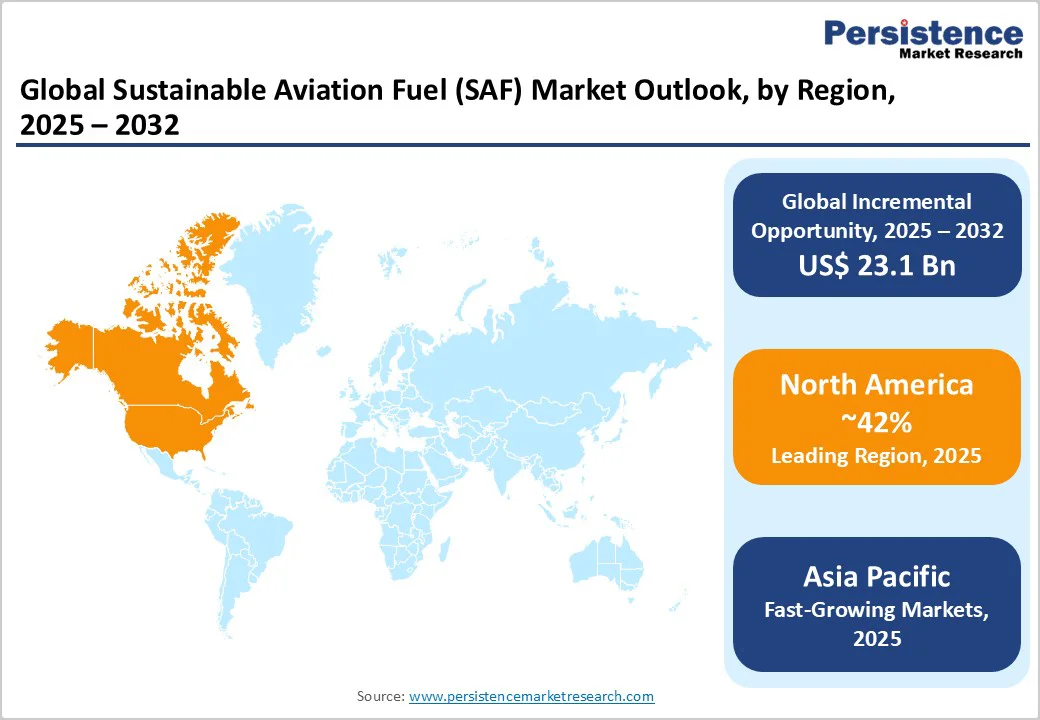
  • Leading Region: North America leads the SAF market with about 42% share in 2025, supported by strong policy incentives under the Inflation Reduction Act, the SAF Grand Challenge, and large-scale production from World Energy, Montana Renewables, Phillips 66, and Gevo.
  • Fastest Growing Region: Asia Pacific is the fastest-growing market driven by 4-5% annual aviation growth, new SAF mandates in Japan, Singapore, and South Korea, and over 2 million tons of capacity under development by Sinopec and PetroChina.
  • Dominant Segment: Second-generation feedstocks hold around 85% share in 2025, led by waste oils and fats such as used cooking oil and animal fats that achieve up to 84% lower emissions than conventional jet fuel.
  • Fastest Growing Segment: Power-to-Liquid (PtL) eFuels is the fastest-growing segment, supported by ReFuelEU mandates and projects by SkyNRG in Sweden and Shell in Germany, though high hydrogen and power costs limit scalability.
  • Key Market Opportunity: Asia Pacific offers strong growth potential through rising air traffic, supportive policies, diverse feedstocks, and partnerships such as Cathay Pacific-SPIC, TotalEnergies-SINOPEC, and Airbus-CNAF to build regional SAF ecosystems.
Key Insights Details
Sustainable Aviation Fuel Market Size (2025E) US$ 2.1 Bn
Market Value Forecast (2032F) US$ 25.2 Bn
Projected Growth CAGR (2025 - 2032) 42.6%
Historical Market Growth (2019 - 2024) 52.0%

global-sustainable-aviation-fuel-saf-market-size-2025-2032

Market Dynamics

Drivers - Stringent Regulatory Mandates Accelerating SAF Adoption

Aviation decarbonization policies worldwide are compelling airlines and fuel suppliers to integrate SAF into their operations at an unprecedented pace. The ReFuelEU Aviation regulation mandates progressive SAF blending requirements starting at 2% in 2025, rising to 6% by 2030, 20% by 2035, and ultimately reaching 70% by 2050, with a specific sub-mandate for synthetic aviation fuels comprising 1.2% by 2030.

In the United States, the Sustainable Aviation Fuel Grand Challenge aims to produce at least 3 billion gallons by 2030 and 35 billion gallons by 2050, supported by federal tax credits under the Inflation Reduction Act providing up to US$1.75 per gallon for qualifying SAF.

According to the European Union Aviation Safety Agency (EASA), implementation of ReFuelEU aviation has already stimulated increased SAF production capacity within the EU, with almost all SAF used in 2024 being biofuel produced from used cooking oil and waste animal fats, confirming that the EU is on track to meet the overall mandatory SAF blending target in 2030.

Aviation Industry’s Net-Zero Commitment Driving Investment

The global aviation sector’s commitment to achieving net-zero carbon emissions by 2050, as formalized by ICAO’s Long-Term Aspirational Goal (LTAG) during the 41st Assembly, is propelling massive investments across the SAF value chain. IATA estimates that SAF will contribute approximately 65% of the emissions reduction needed to reach net-zero, necessitating a substantial scale-up from the current 0.3% of global jet fuel production in 2024 to significantly higher penetration rates.

Major airlines including Air France-KLM, United Airlines, Delta Air Lines, and Cathay Pacific have entered into substantial offtake agreements exceeding billions of liters, securing long-term SAF supply and providing crucial demand certainty for producers.

Since the first commercial SAF offtake in 2013, 81 airlines worldwide have publicly announced 170 deals, with nearly 40% of these airlines announcing more than one agreement, demonstrating sustained commitment beyond initial pilots to scale SAF adoption across their fleets and operations.

Restraints - Cost Premium and Production Economics

The substantial price differential between SAF and conventional jet fuel remains the most significant barrier to widespread market adoption, with SAF typically costing 3 to 5 times more than petroleum-based kerosene.

Airlines and trade bodies consistently highlight that policy mandates expose carriers to elevated near-term procurement costs when supply markets remain constrained and suppliers add compliance surcharges. The aviation sector’s fuel costs already account for up to 25% of operational expenses, and incorporating mandated SAF volumes without sufficient cost reduction mechanisms threatens airline profitability and competitiveness.

While government incentives such as the Inflation Reduction Act tax credits and the EU Emissions Trading System allowances totaling approximately €125 million for 2024 SAF usage provide some relief, analysts project that achieving price parity with fossil jet fuel will require continued technological advancement, feedstock diversification beyond waste oils, and production volumes reaching tens of billions of gallons annually to unlock manufacturing efficiencies.

Feedstock Availability and Supply Chain Constraints

The scalability of SAF production is fundamentally limited by the availability of sustainable feedstocks that meet stringent certification criteria without competing with food production or causing indirect land-use change emissions. Current SAF production relies predominantly on second-generation feedstock. However, these waste-based feedstocks face inherent supply constraints and intense competition from the renewable diesel sector, which often offers more attractive economics for producers.

The HEFA pathway, representing approximately 85% of announced 2030 capacity, is approaching its feedstock ceiling as global supplies of used cooking oil and animal tallow are finite and already heavily utilized across multiple industries.

Advanced pathways including Fischer-Tropsch (FT) synthesis from municipal solid waste and agricultural residues, along with Alcohol-to-Jet (AtJ) from cellulosic ethanol, remain at lower technology readiness levels with minimal commercial-scale deployment.

Power-to-Liquid eFuels require massive renewable electricity infrastructure and green hydrogen production at scales that compete with other decarbonization priorities, presenting both technical and resource allocation challenges that constrain near-term supply growth trajectories.

Opportunities - Expansion of Advanced Technology Pathways

The aviation industry’s long-term SAF requirements cannot be met solely through conventional HEFA production due to feedstock limitations, creating substantial market opportunities for developers of advanced conversion technologies and novel feedstock sources.

Fischer-Tropsch synthesis combined with gasification of municipal solid waste, agricultural residues, and forestry byproducts offers a pathway to produce SAF from abundant, geographically diverse feedstocks without competing with food systems.

The Alcohol-to-Jet pathway using ethanol from corn, sugarcane, or cellulosic sources has gained momentum with LanzaJet operating the world’s first commercial-scale ethanol-to-jet facility and partnering with LanzaTech on the CirculAir solution that converts waste carbon and renewable power into SAF.

Additionally, eFuels produced through Power-to-Liquid processes combining green hydrogen and captured carbon dioxide represent a transformative long-term opportunity, with the EU’s ReFuelEU mandate specifically requiring 0.7% eSAF by 2030, rising to 35% by 2050, creating guaranteed demand for this nascent technology category.

Category-wise Insights

Feedstock Analysis

Second Generation Feedstock commands approximately 85% market share in 2025, establishing clear dominance in the SAF production landscape. This category encompasses waste fats, oils, and greases including used cooking oil, animal fat, industrial grease, and palm oil mill effluent, all of which offer high emission reduction potential typically ranging from 70 to 84% lifecycle greenhouse gas savings compared to conventional jet fuel.

According to EASA implementation reports, used cooking oil accounted for 81% and waste animal fats represented 17% of all SAF produced in 2024 within the European Union, demonstrating the near-complete reliance on these waste streams.

The established supply chains for collecting and processing these materials, coupled with the technological maturity of HEFA processing which directly converts these feedstocks into drop-in aviation fuel, have enabled rapid commercial deployment.

Technology Analysis

Hydrotreated Esters and Fatty Acids (HEFA) technology dominates with approximately 70% market share in 2025. Major producers including Neste, World Energy, TotalEnergies, and Montana Renewables have established commercial-scale HEFA operations with Neste operating 1.5 million tons of annual SAF production capability across facilities in Rotterdam, Singapore, and Finland, with expansion plans to reach 2.2 million tons by 2027.

The HEFA pathway’s ability to achieve up to 84% lifecycle carbon dioxide emissions reductions when using waste-based feedstocks, combined with its compatibility with existing aircraft engines through approved blending ratios up to 50% with conventional jet fuel per ASTM D7566 Annex 2 certification, has driven its widespread adoption.

HEFA will continue dominating SAF production through 2032, though its long-term growth trajectory faces constraints from feedstock availability limitations, necessitating complementary development of Fischer-Tropsch, Alcohol-to-Jet, and Power-to-Liquid pathways to diversify the technology mix and unlock additional sustainable feedstock resources beyond waste oils and fats.

Aircraft Type Analysis

Commercial aviation represents the dominant application segment for SAF, reflecting both the sector’s substantial fuel consumption and its leadership role in driving decarbonization initiatives. Commercial airlines operate the vast majority of global flights and consumed approximately 300 million tonnes of jet fuel annually before the pandemic, making them the primary target for SAF deployment to achieve meaningful emissions reductions.

Leading carriers including United Airlines, Delta Air Lines, American Airlines, Air France-KLM, British Airways, Lufthansa, and Cathay Pacific have established ambitious SAF adoption targets and secured multi-year offtake agreements with producers totaling billions of gallons.

Major aerospace manufacturers have responded with Airbus committing to make all commercial aircraft capable of operating with 100% SAF by 2030, while Boeing has similarly certified its commercial fleet for up to 50% SAF blends and is actively testing neat SAF formulations.

global-sustainable-aviation-fuel-saf-market-outlook-by-end-user-2025-2032

Regional Insights

North America Sustainable Aviation Fuel Market Trends

North America commands approximately 42% market share in 2025, establishing the region as the global leader in SAF production and deployment. The United States dominates with robust policy support through the Inflation Reduction Act, providing tax credits up to US$1.75 per gallon for qualifying SAF, alongside the Sustainable Aviation Fuel Grand Challenge targeting 3 billion gallons of annual production by 2030 and 35 billion gallons by 2050.

State-level incentives further accelerate growth with California, Washington, Illinois, Minnesota, Oregon, New Mexico, Colorado, and New York implementing programs that incentivize low-carbon SAF production through tax credits often tied to carbon-intensity reductions or use of local feedstocks.

The region benefits from established aviation fuel infrastructure, proximity to major airline hubs, access to diverse feedstocks ranging from waste oils to agricultural residues, and a robust innovation ecosystem driving next-generation technologies, including LanzaJet’s alcohol-to-jet process and Alder Fuels’ proprietary biomass conversion technology partnering with Boeing and backed by the U.S. Department of Energy and National Renewable Energy Laboratory.

Europe Sustainable Aviation Fuel Market Trends

Europe serves as the regulatory frontrunner with the ReFuelEU Aviation mandate creating the world’s most comprehensive SAF deployment framework, requiring 2% SAF in 2025, escalating to 6% by 2030, 20% by 2035, and reaching 70% by 2050, with specific sub-mandates for synthetic aviation fuels.

The United Kingdom has implemented even more stringent requirements with a 9.5% mandate by 2030 including a 0.5% Power-to-Liquid sub-target and restrictions on HEFA feedstocks to drive advanced technology development.

Major European producers are responding with substantial capacity investments led by Neste which started SAF production at its Rotterdam renewables refinery in 2025, adding 500,000 tons of annual capacity and bringing global capability to 1.5 million tons, with further expansion scheduled for 2027 to reach 2.7 million tons, making Rotterdam the world’s largest renewable diesel and SAF facility.

The European Union’s complementary policies, including €100 million in ETS allowances allocated to airlines for 2024 SAF usage, anti-tankering provisions preventing fuel arbitrage, and sustainability criteria under the Renewable Energy Directive, ensure a coordinated regulatory framework driving both supply development and demand certainty across the region’s aviation sector.

Asia Pacific Sustainable Aviation Fuel Market Trends

Asia Pacific emerges as the fastest-growing regional market driven by robust aviation demand projected to grow at 4-5% CAGR through 2030, supported by rising middle-class incomes, urbanization, and economic expansion across major economies. China represents a transformational opportunity with the 14th Five-Year Plan targeting 50,000 tonnes of SAF by 2025 and peak carbon emissions by 2030.

Japan has set ambitious targets for 10% SAF by 2030, backed by the Green Innovation Fund allocating over JPY 2 trillion for research, development, and scaling of future SAF technologies. Singapore implements a 1% SAF mandate from 2026, rising to 3-5% by 2030, funded through passenger levies creating a sustainable financial model. South Korea established a 1% blend mandate from 2027.

Similarly, India is developing a comprehensive SAF roadmap with carriers like Vistara operating SAF test flights, while ASEAN nations are working toward unified frameworks though facing fragmented policy maturity across member states.

The region’s manufacturing advantage, diverse feedstock resources including palm oil byproducts and agricultural residues, and major aviation hubs undergoing infrastructure upgrades, position the Asia Pacific for accelerated SAF adoption throughout the forecast period.

global-sustainable-aviation-fuel-saf-market-outlook-by-region-2025-2032

Competitive Landscape

Market Structure Analysis

The Sustainable Aviation Fuel market exhibits a moderately consolidated structure characterized by a mix of established energy majors, specialized biofuel producers, and emerging technology companies. Market leaders, including Neste, TotalEnergies, World Energy, and Shell, leverage their extensive refining infrastructure, established feedstock supply chains, and financial resources to dominate current production volumes.

Strategic partnerships between fuel producers, airlines, and technology providers have become essential competitive tools, exemplified by LanzaTech and LanzaJet’s CirculAir joint offering, Boeing’s investments in Alder Fuels, and Airbus anchoring the Sustainable Aviation Fuel Financing Alliance (SAFFA) with over $200 million in committed capital.

Research and development intensity is accelerating as companies pursue next-generation feedstocks, including algae, energy crops on marginal land, and captured carbon dioxide, while also working to reduce production costs through process optimization and facility scale-up to approach price parity with conventional jet fuel and capture expanding market share as regulatory mandates progressively tighten across major aviation markets worldwide.

Key Market Developments:

  • April 2025: Neste began SAF production at its Rotterdam renewables refinery, enabling up to ~500 000 tons per year of SAF and raising its global SAF production capability to about 1.5 million tons/year.
  • June 2025: TotalEnergies announced it would produce more than 500 000 tons of SAF annually by 2028 to help meet the European blending mandate of 6% by 2030.
  • October 2025: Airbus and Cathay Group announced a joint investment of up to US$70 million to accelerate SAF production in Asia and globally.

Companies Covered in Sustainable Aviation Fuel Market

  • Total Energies
  • Lanza Tech
  • Neste Oyj
  • World Energy
  • Flucrum Bioenergy
  • BP Plc
  • Northwest Advanced Biofuels LLC
  • Aemetis, Inc
  • Alder Energy
  • Gevo Inc
  • Red Stock biofuel
  • WaasteFuels
  • SkyNRG BV
  • Shell Plc
  • Preem AB
  • LanzaJet
  • Montana Renewables
  • Phillips 66
  • DG Fuels
  • Diamond Green Diesel
Frequently Asked Questions

The global Sustainable Aviation Fuel market is projected to reach US$ 25.2 billion by 2032, growing from US$ 2.1 billion in 2025 at a CAGR of 42.6% during the forecast period 2025 - 2032.

Stringent decarbonization mandates such as the ReFuelEU Aviation regulation mandating 2% SAF in 2025 rising to 6% by 2030, the UK’s 9.5% requirement by 2030, and the U.S. Sustainable Aviation Fuel Grand Challenge targeting 3 billion gallons by 2030 are the key primary driver for the market growth.

Second Generation Feedstock dominates with approximately 85% market share in 2025.

North America commands approximately 42% market share in 2025.

The Asia Pacific region presents exceptional growth opportunities sue to rising middle-class incomes and urbanization.

Leading market participants include Neste Oyj, TotalEnergies, World Energy, Shell Plc, BP Plc, etc.

Global Sustainable Aviation Fuel Market Report Scope
Report Attribute Details
Historical Data/Actuals 2019 - 2024
Forecast Period 2025 - 2032
Market Analysis Units Value: US$ Bn, Volume: As Applicable
Geographical Coverage
  • North America
  • Europe
  • East Asia
  • South Asia and Oceania
  • Latin America
  • Middle East and Africa
Segmental Coverage
  • Feedstock
  • Technology
  • Aircraft Type
  • Regions
Competitive Analysis
  • Total Energies
  • Lanza Tech
  • Neste Oyj
  • World Energy
  • Flucrum Bioenergy
  • BP Plc
  • Northwest Advanced Biofuels LLC
  • Aemetis, Inc
  • Alder Energy
  • Gevo Inc
  • Red Stock biofuel
  • WaasteFuels
  • SkyNRG BV
  • Shell Plc
  • Preem AB
  • LanzaJet
  • Montana Renewables
  • Phillips 66
  • DG Fuels
  • Diamond Green Diesel
Report Highlights
  • Market Forecast and Trends
  • Competitive Intelligence and Share Analysis
  • Growth Factors and Challenges
  • Strategic Growth Initiatives
  • Pricing Analysis
  • Future Opportunities and Revenue Pockets
  • Market Analysis Tools
Market Segmentation

By Feedstock

  • First Generation Feedstock
  • Second Generation Feedstock
  • Third Generation Feedstock
  • Other Renewable Feedstock

By Technology

  • Hydrotreated Esters and Fatty Acids (HEFA)
  • Fischer Tropsch (FT)
  • Alcohol to Jet (AtJ)
  • eFuels

By Aircraft Type

  • Commercial
  • Military
  • Business & General Aviation
  • Unmanned Aerial Vehicles

By Region

  • North America
  • Europe
  • East Asia
  • South Asia & Oceania
  • Latin America
  • Middle East & Africa

Related Reports

  1. Executive Summary
    1. Global Sustainable Aviation Fuel Market Snapshot, 2024 and 2032
    2. Market Opportunity Assessment, 2025 - 2032, US$ Mn
    3. Key Market Trends
    4. Future Market Projections
    5. Premium Market Insights
    6. Industry Developments and Key Market Events
    7. PMR Analysis and Recommendations
  2. Market Overview
    1. Market Scope and Definition
    2. Market Dynamics
      1. Drivers
      2. Restraints
      3. Opportunity
      4. Challenges
      5. Key Trends
    3. Product Lifecycle Analysis
    4. Sustainable Aviation Fuel Market: Value Chain
      1. List of Raw Material Suppliers/Technology Integrators
        1. Bio-feedstock
        2. Renewable Feedstock
      2. List of Manufacturers of SAF
      3. Profitability Analysis
    5. Macro-Economic Factors
      1. Global Sectorial Outlook
      2. Global GDP Growth Outlook
      3. Global Aviation Fuel Market Overview and Growth Outlook by Region
      4. Global Biofuels Market Outlook
      5. Global Biofuels Production by Region
    6. Forecast Factors - Relevance and Impact
    7. Covid-19 Impact Assessment
    8. PESTLE Analysis
    9. Porter Five Force’s Analysis
    10. Geopolitical Tensions: Market Impact
    11. Regulatory and Technology Landscape
  3. Production Output and Trade Statistics, 2019 - 2023
    1. Production by Region
    2. Demand-Supply by Region
  4. Price Trend Analysis, 2019 - 2032
    1. Key Highlights
    2. Key Factors Impacting Product Prices
    3. Prices By Feedstock
      1. Corn
      2. Sugarcane
      3. MSW
      4. HVO
      5. POME
      6. PFAD
      7. Others
    4. Production Cost of SAF by Production Route
      1. FT-SPK
      2. HEFA-SPK
      3. HFS-SIP
      4. FT-SPK/A
      5. ATJ-SPK
      6. CH-SK or CHJ
      7. HC-HEFA-SPK
      8. Power to Liquid
    5. Prices of Fuel Additives
      1. Bio-naphtha
      2. Neat SAF
      3. Bio-diesel
    6. Regional Prices and Product Preferences
  5. Global Sustainable Aviation Fuel Market Outlook: Historical (2018 - 2023) and Forecast (2025 - 2032)
    1. Key Highlights
      1. Market Volume (Tons) Projections
      2. Market Size and Y-o-Y Growth
      3. Absolute $ Opportunity
    2. Market Size (US$ Mn) Analysis and Forecast
      1. Historical Market Size Analysis, 2019 - 2023
      2. Current Market Size Forecast, 2024-2031
    3. Global Sustainable Aviation Fuel Market Outlook: Feedstock
      1. Introduction / Key Findings
      2. Historical Market Size (US$ Mn) and Volume (Tons) Analysis By Feedstock, 2018 - 2023
      3. Current Market Size (US$ Mn) and Volume (Tons) Forecast By Feedstock, 2025 - 2032
        1. First Generation Feedstock
        2. Second Generation Feedstock
        3. Third Generation Feedstock
        4. Other Renewable Feedstock
    4. Market Attractiveness Analysis: Feedstock
    5. Global Sustainable Aviation Fuel Market Outlook: Production Route
      1. Introduction / Key Findings
      2. Historical Market Size (US$ Mn) and Volume (Tons) Analysis By Production Route, 2018 - 2023
      3. Current Market Size (US$ Mn) and Volume (Tons) Forecast By Production Route, 2025 - 2032
        1. FT-SPK
        2. HEFA-SPK
        3. HFS-SIP
        4. FT-SPK/A
        5. ATJ-SPK
        6. CH-SK or CHJ
        7. HC-HEFA-SPK
        8. Others
    6. Market Attractiveness Analysis: Production Route
    7. Global Sustainable Aviation Fuel Market Outlook: Aircraft Type
      1. Introduction / Key Findings
      2. Historical Market Size (US$ Mn) and Volume (Tons) Analysis By Aircraft Type, 2018 - 2023
      3. Current Market Size (US$ Mn) and Volume (Tons) Forecast By Aircraft Type, 2025 - 2032
        1. Commercial
        2. Military
        3. Business & General
        4. Unmanned Aerial Vehicles
    8. Market Attractiveness Analysis: Aircraft Type
  6. Global Sustainable Aviation Fuel Market Outlook: Region
    1. Key Highlights
    2. Historical Market Size (US$ Mn) and Volume (Tons) Analysis By Region, 2018 - 2023
    3. Current Market Size (US$ Mn) and Volume (Tons) Forecast By Region, 2025 - 2032
      1. North America
      2. Europe
      3. East Asia
      4. South Asia and Oceania
      5. Latin America
      6. Middle East & Africa (MEA)
    4. Market Attractiveness Analysis: Region
  7. North America Sustainable Aviation Fuel Market Outlook: Historical (2018 - 2023) and Forecast (2025 - 2032)
    1. Key Highlights
    2. Pricing Analysis
    3. Historical Market Size (US$ Mn) and Volume (Tons) Analysis By Market, 2018 - 2023
      1. By Country
      2. By Feedstock
      3. By Production Route
      4. By Aircraft Type
    4. Current Market Size (US$ Mn) and Volume (Tons) Forecast By Country, 2025 - 2032
      1. U.S.
      2. Canada
    5. Current Market Size (US$ Mn) and Volume (Tons) Forecast By Feedstock, 2025 - 2032
      1. First Generation Feedstock
      2. Second Generation Feedstock
      3. Third Generation Feedstock
      4. Other Renewable Feedstock
    6. Current Market Size (US$ Mn) and Volume (Tons) Forecast By Production Route, 2025 - 2032
      1. FT-SPK
      2. HEFA-SPK
      3. HFS-SIP
      4. FT-SPK/A
      5. ATJ-SPK
      6. CH-SK or CHJ
      7. HC-HEFA-SPK
      8. Others
    7. Current Market Size (US$ Mn) and Volume (Tons) Forecast By Aircraft Type, 2025 - 2032
      1. Commercial
      2. Military
      3. Business & General
      4. Unmanned Aerial Vehicles
    8. Market Attractiveness Analysis
  8. Europe Sustainable Aviation Fuel Market Outlook: Historical (2018 - 2023) and Forecast (2025 - 2032)
    1. Key Highlights
    2. Pricing Analysis
    3. Historical Market Size (US$ Mn) and Volume (Tons) Analysis By Market, 2018 - 2023
      1. By Country
      2. By Feedstock
      3. By Production Route
      4. By Aircraft Type
    4. Current Market Size (US$ Mn) and Volume (Tons) Forecast By Country, 2025 - 2032
      1. Germany
      2. France
      3. U.K.
      4. Italy
      5. Russia
      6. Rest of Europe
    5. Current Market Size (US$ Mn) and Volume (Tons) Forecast By Feedstock, 2025 - 2032
      1. First Generation Feedstock
      2. Second Generation Feedstock
      3. Third Generation Feedstock
      4. Other Renewable Feedstock
    6. Current Market Size (US$ Mn) and Volume (Tons) Forecast By Production Route, 2025 - 2032
      1. FT-SPK
      2. HEFA-SPK
      3. HFS-SIP
      4. FT-SPK/A
      5. ATJ-SPK
      6. CH-SK or CHJ
      7. HC-HEFA-SPK
      8. Others
    7. Current Market Size (US$ Mn) and Volume (Tons) Forecast By Aircraft Type, 2025 - 2032
      1. Commercial
      2. Military
      3. Business & General
      4. Unmanned Aerial Vehicles
    8. Market Attractiveness Analysis
  9. East Asia Sustainable Aviation Fuel Market Outlook: Historical (2018 - 2023) and Forecast (2025 - 2032)
    1. Key Highlights
    2. Pricing Analysis
    3. Historical Market Size (US$ Mn) and Volume (Tons) Analysis By Market, 2018 - 2023
      1. By Country
      2. By Feedstock
      3. By Production Route
      4. By Aircraft Type
    4. Current Market Size (US$ Mn) and Volume (Tons) Forecast By Country, 2025 - 2032
      1. China
      2. Japan
      3. South Korea
    5. Current Market Size (US$ Mn) and Volume (Tons) Forecast By Feedstock, 2025 - 2032
      1. First Generation Feedstock
      2. Second Generation Feedstock
      3. Third Generation Feedstock
      4. Other Renewable Feedstock
    6. Current Market Size (US$ Mn) and Volume (Tons) Forecast By Production Route, 2025 - 2032
      1. FT-SPK
      2. HEFA-SPK
      3. HFS-SIP
      4. FT-SPK/A
      5. ATJ-SPK
      6. CH-SK or CHJ
      7. HC-HEFA-SPK
      8. Others
    7. Current Market Size (US$ Mn) and Volume (Tons) Forecast By Aircraft Type, 2025 - 2032
      1. Commercial
      2. Military
      3. Business & General
      4. Unmanned Aerial Vehicles
    8. Market Attractiveness Analysis
  10. South Asia & Oceania Sustainable Aviation Fuel Market Outlook: Historical (2018 - 2023) and Forecast (2025 - 2032)
    1. Key Highlights
    2. Pricing Analysis
    3. Historical Market Size (US$ Mn) and Volume (Tons) Analysis By Market, 2018 - 2023
      1. By Country
      2. By Feedstock
      3. By Production Route
      4. By Aircraft Type
    4. Current Market Size (US$ Mn) and Volume (Tons) Forecast By Country, 2025 - 2032
      1. India
      2. Southeast Asia
      3. Rest of South Asia & Oceania
    5. Current Market Size (US$ Mn) and Volume (Tons) Forecast By Feedstock, 2025 - 2032
      1. First Generation Feedstock
      2. Second Generation Feedstock
      3. Third Generation Feedstock
      4. Other Renewable Feedstock
    6. Current Market Size (US$ Mn) and Volume (Tons) Forecast By Production Route, 2025 - 2032
      1. FT-SPK
      2. HEFA-SPK
      3. HFS-SIP
      4. FT-SPK/A
      5. ATJ-SPK
      6. CH-SK or CHJ
      7. HC-HEFA-SPK
      8. Others
    7. Current Market Size (US$ Mn) and Volume (Tons) Forecast By Aircraft Type, 2025 - 2032
      1. Commercial
      2. Military
      3. Business & General
      4. Unmanned Aerial Vehicles
    8. Market Attractiveness Analysis
  11. Latin America Sustainable Aviation Fuel Market Outlook: Historical (2018 - 2023) and Forecast (2025 - 2032)
    1. Key Highlights
    2. Pricing Analysis
    3. Historical Market Size (US$ Mn) and Volume (Tons) Analysis By Market, 2018 - 2023
      1. By Country
      2. By Feedstock
      3. By Production Route
      4. By Aircraft Type
    4. Current Market Size (US$ Mn) and Volume (Tons) Forecast By Country, 2025 - 2032
      1. Brazil
      2. Mexico
      3. Rest of Latin America
    5. Current Market Size (US$ Mn) and Volume (Tons) Forecast By Feedstock, 2025 - 2032
      1. First Generation Feedstock
      2. Second Generation Feedstock
      3. Third Generation Feedstock
      4. Other Renewable Feedstock
    6. Current Market Size (US$ Mn) and Volume (Tons) Forecast By Production Route, 2025 - 2032
      1. FT-SPK
      2. HEFA-SPK
      3. HFS-SIP
      4. FT-SPK/A
      5. ATJ-SPK
      6. CH-SK or CHJ
      7. HC-HEFA-SPK
      8. Others
    7. Current Market Size (US$ Mn) and Volume (Tons) Forecast By Aircraft Type, 2025 - 2032
      1. Commercial
      2. Military
      3. Business & General
      4. Unmanned Aerial Vehicles
    8. Market Attractiveness Analysis
  12. Middle East & Africa Sustainable Aviation Fuel Market Outlook: Historical (2018 - 2023) and Forecast (2025 - 2032)
    1. Key Highlights
    2. Pricing Analysis
    3. Historical Market Size (US$ Mn) and Volume (Tons) Analysis By Market, 2018 - 2023
      1. By Country
      2. By Feedstock
      3. By Production Route
      4. By Aircraft Type
    4. Current Market Size (US$ Mn) and Volume (Tons) Forecast By Country, 2025 - 2032
      1. GCC
      2. South Africa
      3. Rest of Middle East & Africa
    5. Current Market Size (US$ Mn) and Volume (Tons) Forecast By Feedstock, 2025 - 2032
      1. First Generation Feedstock
      2. Second Generation Feedstock
      3. Third Generation Feedstock
      4. Other Renewable Feedstock
    6. Current Market Size (US$ Mn) and Volume (Tons) Forecast By Production Route, 2025 - 2032
      1. FT-SPK
      2. HEFA-SPK
      3. HFS-SIP
      4. FT-SPK/A
      5. ATJ-SPK
      6. CH-SK or CHJ
      7. HC-HEFA-SPK
      8. Others
    7. Current Market Size (US$ Mn) and Volume (Tons) Forecast By Aircraft Type, 2025 - 2032
      1. Commercial
      2. Military
      3. Business & General
      4. Unmanned Aerial Vehicles
    8. Market Attractiveness Analysis
  13. Competition Landscape
    1. Market Share Analysis, 2023
    2. Market Structure
      1. Competition Intensity Mapping By Market
        1. Company Vs Production Route
        2. Company Vs Feedstock
        3. Company Vs Regional Presence
      2. Competition Dashboard
      3. Apparent Production Capacity
    3. Company Profiles (Details - Overview, Financials, Strategy, Recent Developments)
      1. Total Energies
        1. Overview
        2. Segments and Products
        3. Key Financials
        4. Market Developments
        5. Market Strategy
      2. Lanza Tech
      3. Neste Oyj
      4. World Energy
      5. Flucrum Bioenergy
      6. BP Plc
      7. Northwest Advanced Biofuels LLC
      8. Aemetis, Inc
      9. Alder Fuels
      10. Gevo Inc
      11. Red Stock biofuel
      12. WasteFuels
      13. SkyNRG BV
      14. Shell Plc
      15. Preem AB
  14. Appendix
    1. Research Methodology
    2. Research Assumptions
    3. Acronyms and Abbreviations

Research Methodology Framework for Market Research Excellence

At Persistence Market Research, we implement a comprehensive, validated, and multi-dimensional approachto market analysis that delivers actionable insights across complex market landscapes. Our methodology combines the analytical rigor of leading consulting firms with innovative research techniques, ensuring robust market assessments that guide strategic decision-making with confidence.

Core Research Philosophy

Our methodology is built on four foundational pillars:

Research Philosophy Image

At Persistence Market Research, our methodology is designed to transcend conventional market studies by combining analytical rigor, multi-source validation, and future-focused insights.

We integrate advanced research frameworks, robust data collection strategies, cutting-edge analytics, and innovative technologies to deliver a 360-degree view of complex markets.

We integrate advanced research frameworks, robust data collection strategies, cutting-edge analytics, and innovative technologies to deliver a 360-degree view of complex markets.

Each stage spanning from strategic scoping and hypothesis-building to competitive intelligence, quality validation, and actionable recommendations is engineered to provide clients with unmatched clarity, precision, and confidence in decision-making.

By embedding innovation and technology at the core, our approach ensures that insights are not only comprehensive but also predictive, empowering businesses to seize opportunities, mitigate risks, and achieve sustainable growth

Research Philosophy Image

Capturing Key Information and Events

During this phase, key research objectives focus on essential information and data points for assessing the market, including:

Research Philosophy Image

TAM-SAM-SOM Framework Implementation

We employ both top-down and bottom-up approaches to ensure accurate market sizing.

Top-Down Market SizingBottom-Up Market Sizing
Universe Definition: Total global/regional market identificationUnit Economics: Average transaction values, purchase frequencies, customer lifecycle
Segmentation Filters: Geographic, demographic, and behavioral constraintsCustomer Segmentation: Detailed buyer persona development and sizing
Market Share Analysis: Competitive landscape assessment and share allocationPenetration Analysis: Market penetration rates by segment and geography
Growth Rate Application: Historical trends and forward-looking growth assumptionsScaling Methodology: Extrapolation techniques with confidence intervals

Validation & Cross-Verification

  • Triangulation: Comparing top-down and bottom-up results for consistency
  • Sensitivity Analysis: Testing key assumptions and parameter variations
  • Peer Benchmarking: Comparison with analogous markets and industry benchmarks
  • Expert Review: External validation through industry specialist consultation

Research Philosophy Image

Forecasting & Projection Modeling

Our proprietary forecasting models incorporate multiple variables and scenarios.

Forecasting Components

  • Historical Trend Analysis: 10-year historical growth patterns and cyclical variations
  • Driver-Based Modeling: Economic indicators, demographic shifts, technology adoption
  • Scenario Planning: Base case, optimistic, and conservative projections
  • Monte Carlo Simulations: Probability-weighted outcomes and risk assessments

Model Validation

  • Back-Testing: Historical accuracy assessment over 3–5-year periods
  • Cross-Validation: Multiple modeling approaches for result comparison
  • External Benchmarking: Comparison with established market forecasts
  • Continuous Calibration: Quarterly model updates based on new data

Comprehensive Data Collection Strategy

Our secondary research phase establishes a robust knowledge base utilizing diverse, credible sources.

Secondary Data Sourcess

  • Industry Publications & Reports
  • Government & Regulatory Data
  • Financial Intelligence (filings & reports)
  • Academic Research & Digital Intelligence

Quality Assurance Protocol

  • Source credibility assessment and publication date validation
  • Data consistency checks across multiple sources
  • Bias identification and neutralization techniques
  • Information gap tracking for primary research prioritization

Research Philosophy Image

Primary Research Excellence

Our primary research methodology employs best-in-class techniques to capture unique market insights.

Quantitative Research Methods

  • Large-Scale Surveys: Statistically representative samples with 95% confidence intervals
  • Survey Methodology: Multi-channel deployment (online, telephone, in-person)
  • Question Architecture and Response Optimization

Qualitative Research Methods

  • Executive Interviews
  • Focus Groups
  • Expert Consultations

Quality Assurance & Validation Framework

Multi-Stage Validation Process

  • Source Verification and Consistency Testing
  • Outlier Detection and Bias Assessment
  • Peer Review Process and External Validation
  • Sensitivity Analysis and Confidence Intervals

Research Philosophy Image

Methodology Validation & Credibility

Our research methodology has been extensively validated through:

  • Academic Partnerships: Collaborations with top-tier business schools and research institutions
  • Client Success Stories: Documented case studies demonstrating research impact and ROI
  • Continuous Benchmarking: Performance comparison with leading global research firms

This comprehensive methodology framework positions Persistence Market Research at the forefront of market intelligence, combining the analytical sophistication of top-tier consulting firms with innovative research techniques. Our approach ensures that every market assessment delivers precise, actionable, and strategically valuable insights that drive business success in competitive market environments.

Ready to unlock your market potential? Contact our research experts to discuss how our validated methodology can transform your strategic decision-making with data-driven market intelligence.

Copyright © 2026 Persistence Market Research. All Rights Reserved

Connect With Us -