


- Healthcare Services
- Medicated Wipes Market
Medicated Wipes Market Size, Share, and Growth Forecast, 2026 - 2033
Medicated Wipes Market by Product Type (Wound Care, Hemorrhoid Care, Dermatological Care, Feminine Care), Source (Dry Wipes, Wet Wipes), and Regional Analysis for 2026 - 2033
Medicated Wipes Market Size and Trends Analysis
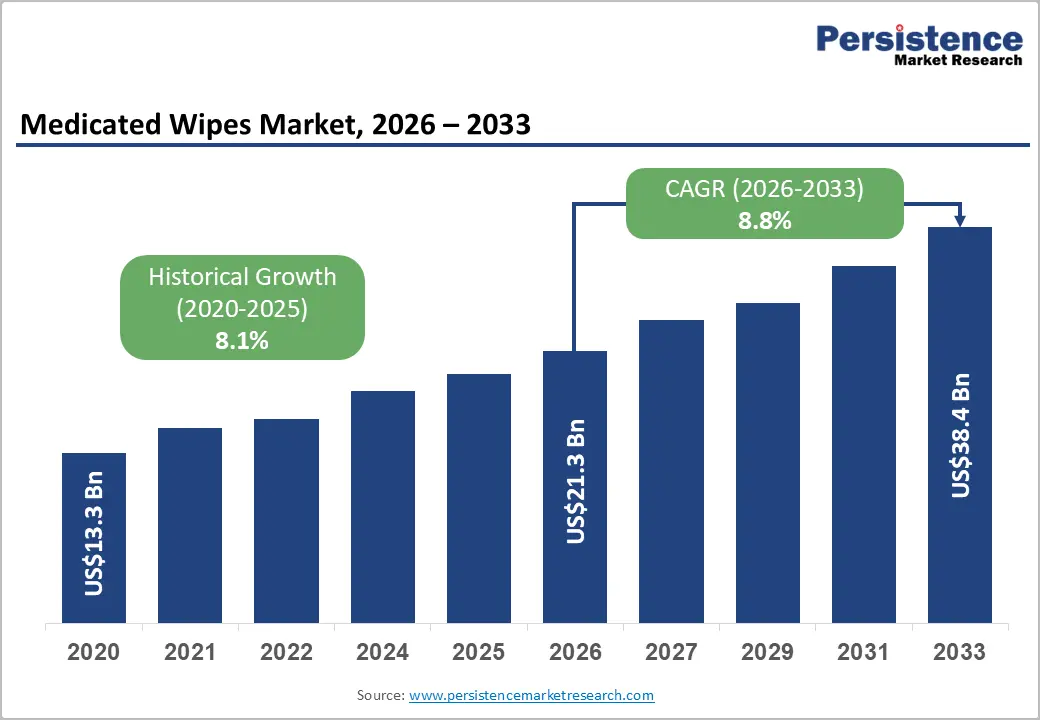
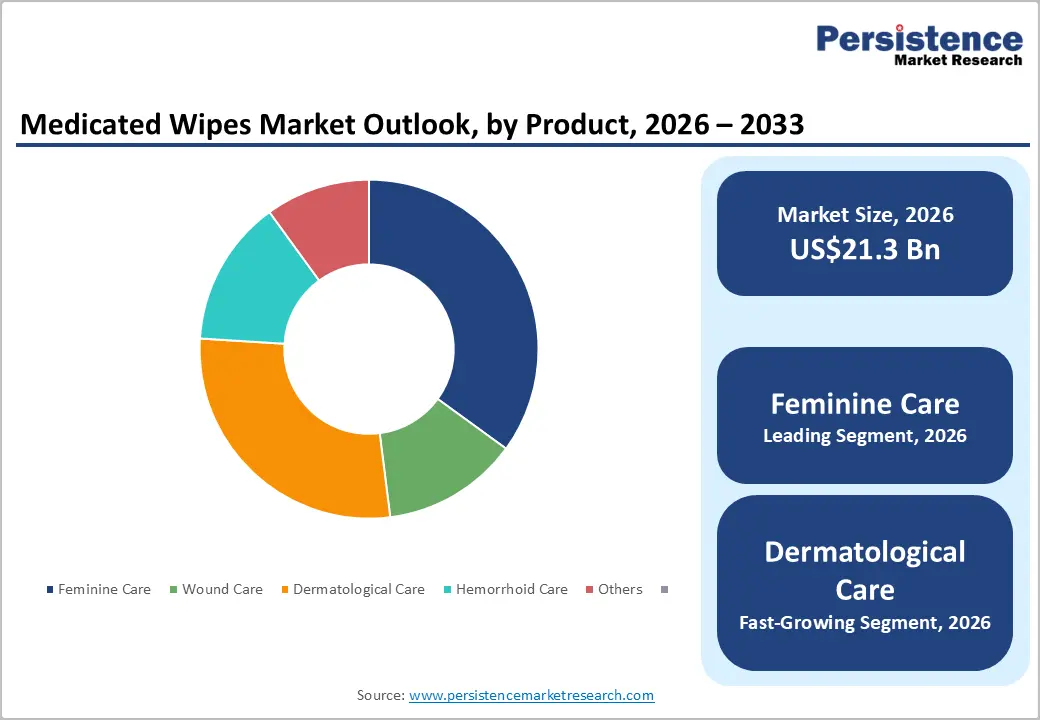
The global medicated wipes market size is likely to be valued at US$21.3 billion in 2026 and is expected to reach US$38.4 billion by 2033, growing at a CAGR of 8.8% during the forecast period from 2026 to 2033, driven by rising hygiene awareness, increasing dermatological disorders, and growing adoption of home-based healthcare solutions.
According to recent industry assessments (2024 - 2025), demand is strongly influenced by infection prevention practices promoted in healthcare settings and community care guidelines aligned with global hygiene standards from the World Health Organization (WHO). Growth is supported by increased use of antiseptics and dermatological wipes in hospitals, long-term care facilities, and personal care routines. The WHO highlights that improved hand and surface hygiene significantly reduces healthcare-associated infections, indirectly supporting demand for medicated cleansing products.
Key Industry Highlights:
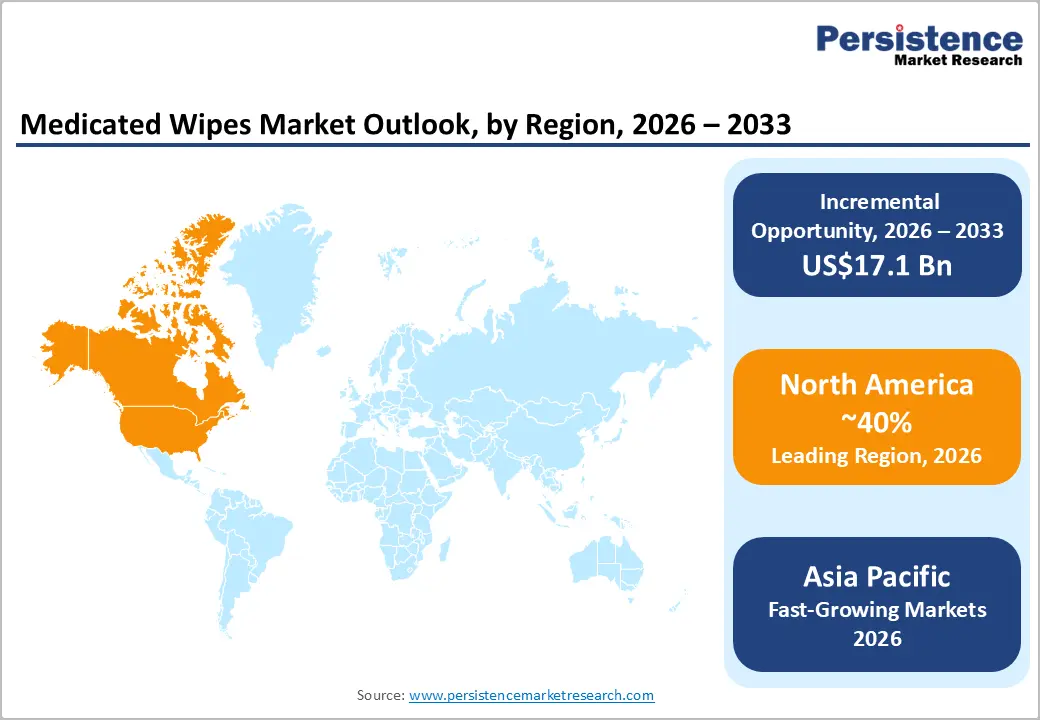
- Leading Region: North America is anticipated to be the leading region, accounting for a market share of 40% in 2026, driven by strong healthcare infrastructure, high hygiene awareness, and advanced regulatory oversight.
- Fastest-growing Region: Asia Pacific is likely to be the fastest-growing region, supported by a large population base, rising hygiene awareness, expanding healthcare access, and strong manufacturing presence.
- Leading Product Type: Feminine care is projected to represent the leading product type in 2026, accounting for 30% of the revenue share, due to rising women’s hygiene awareness and targeted product availability.
- Leading Source: Dry wipes are anticipated to be the leading source, accounting for over 50% of the revenue share in 2026, supported by their longer shelf life and reduced irritation benefits.
- Key Opportunity: The key opportunity in the medicated wipes market lies in the development of sustainable, dermatologically advanced, and multifunctional infection-control wipes for homecare, hospital, and chronic skin condition applications, driven by rising hygiene awareness and demand for convenient preventive healthcare solutions.
DRO Analysis
Driver - Rising Prevalence of Dermatological and Chronic Conditions
The medicated wipes market is strongly driven by the rising prevalence of dermatological disorders and chronic health conditions such as eczema, acne, psoriasis, diabetes-related skin complications, and infections. Increasing exposure to pollution, changing lifestyles, and stress-related skin issues are amplifying demand for therapeutic cleansing solutions. Medicated wipes provide convenient, targeted relief and hygiene management, making them essential in both personal care and healthcare settings.
Their ease of use without water and reduced risk of cross-contamination support widespread adoption. Growing awareness of preventive skin care and early treatment is strengthening their role in daily hygiene routines. The aging population is also contributing significantly to the demand for medicated wipes, as elderly individuals are more prone to chronic wounds, reduced skin integrity, and mobility limitations.
This increases the need for easy-to-use hygiene products that support infection prevention and skin maintenance. Hospitals and home-care settings increasingly rely on medicated wipes for wound cleaning and dermatological care support. Rising cases of lifestyle-related diseases such as obesity and diabetes accelerate skin-related complications, expanding usage across clinical and home environments.
Restraint - Supply Chain Constraints and Raw Material Volatility
The medicated wipes market faces notable restraints due to supply chain disruptions and volatility in raw material availability, particularly nonwoven fabrics, chemical agents, and packaging materials. Fluctuations in petrochemical-derived inputs significantly impact production costs and pricing stability. Logistics challenges, including transportation delays and trade restrictions, disrupt timely distribution across healthcare and retail channels.
Dependency on specialized raw materials for medicated formulations increases vulnerability to price fluctuations and supplier concentration risks. Regulatory compliance for chemical ingredients also adds complexity to procurement and manufacturing processes, often leading to delays and higher operational costs. Environmental regulations on synthetic materials restrict sourcing options, pushing companies to find compliant alternatives.
Opportunity - Technological Convergence and Sustainable Innovations
The medicated wipes market presents strong growth opportunities through technological convergence, particularly the integration of advanced formulations, smart delivery systems, and dermatologically enhanced active ingredients. Innovations in antimicrobial coatings, pH-balanced solutions, and bioactive compounds are improving product efficacy and safety.
The adoption of nanotechnology and controlled-release mechanisms is enabling longer-lasting therapeutic effects. Digital healthcare integration is also supporting personalized hygiene solutions tailored to specific skin conditions. These advancements are expanding the application scope of medicated wipes across hospitals, home care, and preventive skincare.
Sustainability is another major opportunity shaping the future of the medicated wipes industry, with increasing demand for biodegradable, compostable, and eco-friendly materials. Manufacturers are shifting toward plant-based fibers and reduced chemical formulations to meet environmental regulations and consumer preferences. Sustainable packaging innovations are also gaining traction, reducing plastic waste and carbon footprint.
Category-wise Analysis
Product Type Insights
Feminine care is expected to lead accounting for 30% of revenue in 2026, due to increasing awareness of women’s intimate hygiene, preventive healthcare practices, and demand for convenient cleansing solutions. This segment benefits from strong product visibility across pharmacies, supermarkets, and online platforms, along with continuous brand-driven education campaigns. A notable example includes the growing adoption of intimate hygiene wipes used during travel and menstrual cycles, especially products similar to those offered by Johnson & Johnson and Procter & Gamble in personal care portfolios.
Dermatological care is likely to represent the fastest-growing segment, supported by the rising prevalence of acne, eczema, psoriasis, and other chronic skin conditions across all age groups. Increasing exposure to pollution, stress, and unhealthy lifestyles has intensified skin-related concerns, increasing demand for targeted therapeutic solutions. For instance, acne-control medicated wipes are used in dermatology clinics and home care routines, especially those containing antibacterial and soothing agents for sensitive skin management. These products are increasingly recommended by dermatologists as adjunct care for mild to moderate skin conditions.
Source Insights
Dry wipes are projected to lead the market, capturing around 50% of the revenue share in 2026, supported by their longer shelf life, reduced risk of irritation, and compatibility with sensitive skin applications. These wipes are preferred in both healthcare and personal hygiene settings where controlled activation with medicated solutions is required. For example, dry wound care wipes are used in hospitals for cleaning minor injuries before applying antiseptic solutions, ensuring reduced contamination risk. Dry wipes are also widely used in dermatological applications where patients require gentle, preservative-free cleansing options.
Wet wipes are likely to be the fastest-growing source, due to rising demand for convenience-based, ready-to-use hygiene solutions with immediate cleansing and therapeutic effects. These wipes are pre-moistened with medicated formulations, making them highly effective for quick skin cleaning, infection prevention, and dermatological care. A notable example includes antiseptic wet wipes used for post-surgical skin cleaning and infection control in outpatient care, offering ease of application without additional preparation. Increasing consumer preference for on-the-go hygiene solutions, especially in urban environments and travel scenarios, is accelerating adoption.
Regional Insights
North America Medicated Wipes Market Trends
North America is anticipated to be the leading region, accounting for a market share of 40% in 2026, supported by strong healthcare infrastructure, high hygiene awareness, and increasing adoption of infection prevention and dermatological care solutions across clinical and home care settings. A notable example includes 3M, which offers medical-grade antiseptic wipes widely used in hospitals for surgical site preparation and infection control.
U.S. Medicated Wipes Market Trends
The U.S. is expected to dominate the regional market, accounting for approximately 30% share in 2026, driven by advanced healthcare infrastructure, high consumer hygiene awareness, and strong demand for OTC dermatological and antiseptic products. Rising cases of diabetes-related skin complications, chronic wounds, and post-surgical care needs are increasing the usage across hospitals and home care settings. Strong FDA regulatory standards ensure product safety and innovation in formulations.
Canada Medicated Wipes Market Trends
Canada is expected to hold approximately 6% market share in 2026, supported by a well-developed public healthcare system, an increasing elderly population, and a rising focus on infection prevention in healthcare facilities. Demand is growing for antiseptic and wound care wipes in long-term care centers and home healthcare environments. Government initiatives promoting hygiene compliance and patient safety are strengthening adoption.
Europe Medicated Wipes Market Trends
Europe is likely to be a significant market for medicated wipes, due to strict hygiene regulations, strong healthcare systems, and rising demand for eco-friendly and dermatologically safe products. The region is witnessing increased adoption of antiseptic and therapeutic wipes across hospitals and household care applications. For instance, Reckitt Benckiser, which provides antiseptic hygiene wipes widely used in hospitals and households for infection prevention and personal care.
U.K. Medicated Wipes Market Trends
The U.K. is estimated to account for 18% Europe market share, supported by NHS-led infection control programs, a rising elderly population, and increasing demand for home-based healthcare services. Growing awareness of hygiene and skin health is driving the adoption of dermatological and antiseptic wipes across clinical and personal care applications. Expansion of home care services and chronic disease management is accelerating usage across healthcare and household settings.
Germany Medicated Wipes Market Trends
Germany is expected to dominate the regional market, capturing around 20% of the Europe market share in 2026, due to advanced hospital infrastructure, strong pharmaceutical manufacturing base, and strict clinical hygiene standards. Rising surgical procedures and increasing prevalence of chronic skin conditions are increasing the demand for antiseptics and wound care wipes. The country is also seeing strong adoption of eco-friendly and dermatologically safe formulations.
Asia Pacific Medicated Wipes Market Trends
The Asia Pacific region is likely to be the fastest-growing region, driven by a large population base, rising healthcare access, rapid urbanization, and increasing hygiene awareness. The region is witnessing a strong demand for cost-effective and convenient medicated wipes across the hospitals, pharmacies, and personal care segments. For example, Kimberly-Clark Corporation has expanded its hygiene and personal care wipe portfolio.
China Medicated Wipes Market Trends
China is expected to dominate the regional market, holding around 25% market share, supported by strong manufacturing capabilities, expanding hospital infrastructure, and rising awareness of hygiene and infection prevention. Increasing urbanization and pollution-related skin disorders are increasing the demand for dermatological and antiseptic wipes. Growing retail penetration and e-commerce expansion are also improving product accessibility.
India Medicated Wipes Market Trends
India is expected to be a significant market for medicated wipes, accounting for approximately 10% share in 2026, due to improving healthcare access, rising skin disease prevalence, and expanding pharmaceutical retail networks. Increasing awareness of hygiene in maternity care, infant care, and home healthcare applications is driving demand. Growth in affordable OTC medicated products and expanding rural healthcare programs is strengthening market penetration across both urban and semi-urban regions.
Competitive Landscape
The global medicated wipes market exhibits a moderately fragmented structure, driven by the presence of multinational healthcare companies, personal care giants, and specialized hygiene product manufacturers competing across medical and consumer segments. Strong demand for infection prevention, dermatological care, and convenient hygiene solutions has intensified competition, encouraging continuous product innovation and geographic expansion.
With key leaders including Johnson & Johnson, Procter & Gamble, Kimberly-Clark Corporation, 3M, Reckitt Benckiser, and Edgewell Personal Care, the market is characterized by strong brand recognition and extensive distribution networks across hospitals, pharmacies, and retail channels. These players compete through aggressive R&D investments, strategic collaborations with healthcare institutions, and expansion of OTC and professional healthcare product portfolios.
Key Industry Developments:
- In March 2026, Biom launched a next-generation disinfecting wipes product in the U.S. market, introducing a plant-based, quat-free formulation designed to address rising concerns over chemical exposure and environmental sustainability in traditional disinfectant wipes. The product uses biodegradable materials and plant-derived active ingredients, positioning it as a safer alternative to conventional disinfecting wipes while maintaining strong germ-killing efficiency.
- In May 2026, Kimberly-Clark Corporation received regulatory approval for its acquisition of Kenvue Inc., strengthening its position in the global wipes and personal care segment.
Companies Covered in Medicated Wipes Market
- Pfizer Inc.
- Diamond Wipes International Inc.
- Blistex Inc., Pure Touch Skin Care
- GAMA Healthcare Ltd.
- Kimberly-Clark Corporation
- Johnson & Johnson
- Edgewell Personal Care
- Rockline Industries
- Procter & Gamble
- 3M
- Costco Wholesale Corporation
- Reckitt Benckiser Group plc
- Procotech Limited
Frequently Asked Questions
The global medicated wipes market is projected to reach US$21.3 billion in 2026.
Rising prevalence of skin disorders, increasing hygiene awareness, and growing demand for convenient infection-prevention and dermatological care solutions drive the medicated wipes market.
The medicated wipes market is expected to grow at a CAGR of 8.8% from 2026 to 2033.
Development of sustainable, dermatologically advanced, and multifunctional medicated wipes for home care, clinical use, and chronic skin condition management presents the key market opportunity.
Pfizer Inc., Diamond Wipes International Inc., Blistex Inc., Pure Touch Skin Care, and GAMA Healthcare Ltd are the leading players.


