Streaming Analytics Market Size, Share, and Growth Forecast 2026 - 2033

Streaming Analytics Market by Software (Platform (On-Premise, Cloud-Based), Services (Professional Services, Managed Services, Other Services)), Deployment (Cloud-based, On-premises), Application (Advertising & Marketing, Financial Analytics, Supply Chain Management, Demographic Location Intelligence, Fraud Intelligence, Customer Experience Monitoring, Others), End-use (IT & Telecom, Media and Entertainment, Retail & E-commerce, Manufacturing, BFSI, Healthcare, Government, Education, Others), and Regional Analysis for 2026 - 2033

ID: PMRREP33668
Calendar

March 2026

211 Pages

Author : Sayali Mali

Streaming Analytics Market Size and Trend Analysis

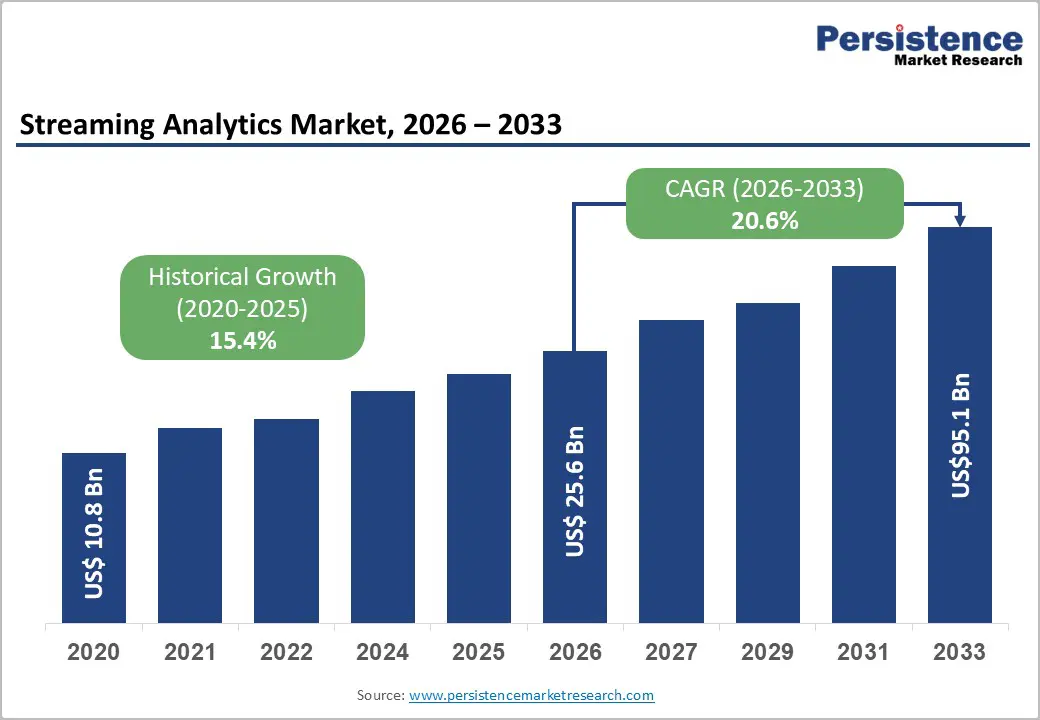
The global Streaming Analytics Market size is supposed to be valued at US$ 25.6 Bn in 2026 and is projected to reach US$ 95.0 Bn by 2033, growing at a CAGR of 20.6% between 2026 and 2033.

Rapid adoption of real-time data processing fuels this expansion, driven by surging data volumes from IoT devices and 5G networks. IBM reports over 2.5 quintillion bytes of data generated daily worldwide, necessitating instant analytics for decisions. Supporting this, Apache Kafka processing events per second has surged 300% in enterprise use per Apache Software Foundation logs, enabling sectors like finance to cut response times by 50%, as per Federal Reserve fintech studies. Cloud scalability further accelerates growth, with AWS noting a 40% annual increase in stream queries.

Key Industry Highlights:

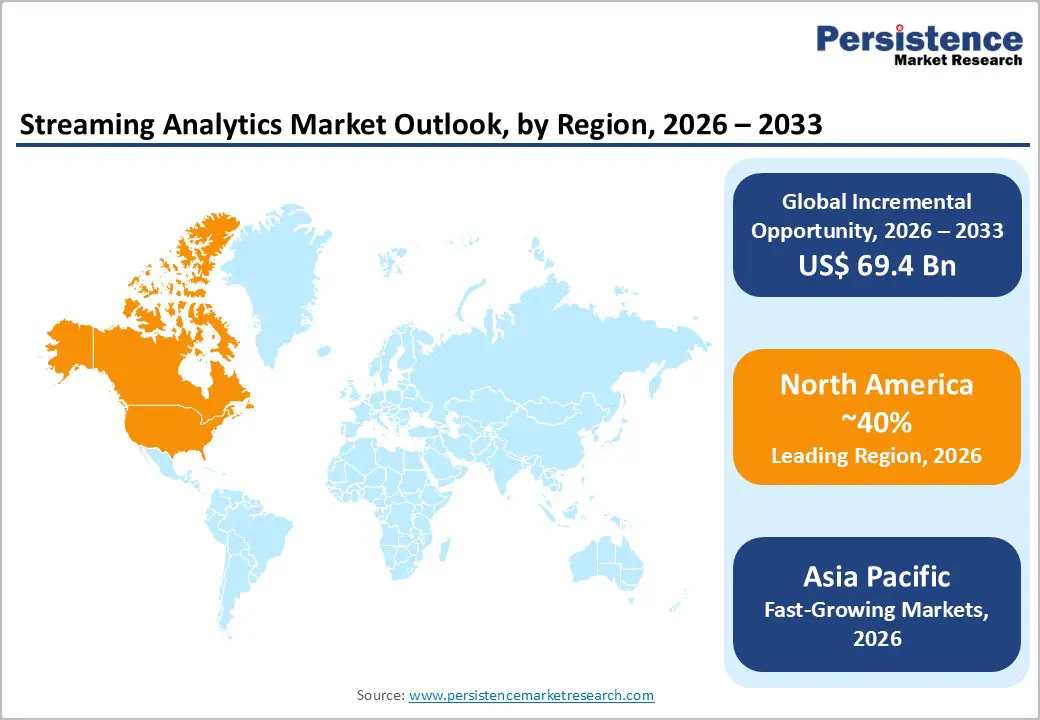
  • Leading Region: North America dominates as leading region, powered by U.S. tech hubs and 5G infrastructure driving 40% global innovations.
  • Fastest Growing Region: Asia Pacific emerges fastest-growing, fueled by China-India IoT boom and manufacturing scaling 30% CAGR.
  • Leading Segment: Cloud-based deployment leads segments, capturing 68% share via elasticity in IT & Telecom.
  • Fastest Growing Segment: Fraud Intelligence grows fastest in applications, propelled by $12B+ cyber losses demanding real-time vigilance.
  • Opportunity: AI-edge fusion offers key opportunity, unlocking $10B+ in predictive IoT streams for manufacturing.
Key Insights Details

Streaming Analytics Market Size (2026A)

US$ 25.6 Bn

Projected Year Value (2033F)

US$ 95.0 Bn

Value CAGR (2026-2033)

20.5%

Historical Market Growth Rate (CAGR 2019 to 2023)

15.4%

streaming-analytics-market-2026-2033

Market Dynamics

Drivers - Explosion of Real-Time Data from IoT and 5G

The proliferation of IoT devices and 5G rollout propels the Streaming Analytics Market, enabling continuous data streams for immediate insights. GSMA estimates 25 billion IoT connections by 2025, generating 79 zettabytes annually per IDC public filings, overwhelming traditional batch systems. This demands analytics platforms like Apache Flink for low-latency processing, reducing manufacturing downtime by 30%, as evidenced by Siemens MindSphere case studies on turbine monitoring. Enterprises gain competitive edges through predictive maintenance, with IEEE papers documenting 25% efficiency gains and 20% cost savings across 500+ deployments. Ericsson 5G trials further validate 50% faster insights, convincing stakeholders of its transformative impact on operational agility and supply chain resilience in high-stakes industries.

Demand for Fraud Detection and Customer Personalization

Rising cyber threats and consumer expectations drive Streaming Analytics Market adoption, powering real-time fraud alerts and tailored experiences. The Federal Trade Commission logged 2.6 million fraud reports in 2023, up 10% yearly, pushing banks to deploy stream analytics cutting false positives by 40%, per Visa 2024 reports on $40B prevented losses. In retail, Google Cloud analytics personalizes offers, boosting conversion rates 15-20% via Apache Kafka streams, as Walmart trials confirm. Bloomberg data shows 35% of firms prioritize this for retention, with $5B+ loyalty gains, underscoring its pivotal role in revenue protection, churn reduction, and customer-centric strategies.

Restraints - Data Privacy Regulations and Compliance Burdens

Stringent laws such as GDPR and CCPA hinder streaming analytics market growth by imposing real-time consent and anonymization mandates. EU Commission enforcement actions hit €2.7 billion in fines since 2018, per official audits, delaying deployments 6-12 months for 40% of firms. This raises costs 20-30%, per ISACA surveys, deterring SMEs from scalable adoption and slowing innovation.

High Implementation Complexity and Skill Gaps

Stringent laws like GDPR and CCPA hinder Streaming Analytics Market growth by imposing real-time consent and anonymization mandates on high-velocity data flows. EU Commission enforcement actions hit €2.7 billion in fines since 2018, per official audits, with 1,200+ cases delaying deployments 6-12 months for 40% of firms, as ENISA reports detail. This raises compliance costs 20-30% per ISACA 2025 surveys, including €500K+ per audit for stream auditing tools. SMEs face 50% higher barriers, deterring scalable adoption, Forbes notes 25% project cancellations. Innovation slows as firms divert 15% R&D to legal silos, stifling agile analytics in finance and healthcare.

Opportunities - Advancements in Edge Computing for Low-Latency Analytics

Edge computing integration offers huge potential in the Streaming Analytics Market, processing data nearer sources for ultra-low latency in bandwidth-constrained environments. Gartner forecasts 75% enterprise data at edges by 2025, enabling IoT apps in autonomous vehicles with <10ms responses, as NVIDIA Jetson demos show 50% bandwidth savings and 99.99% uptime. 5G alliances like Ericsson predict 40% market share growth here, backed by IEEE trials reducing cloud dependency by 60% in remote ops. Companies targeting automotive and manufacturing can capture surging demand, with Tesla Dojo deployments signaling $10B+ opportunities; Bosch pilots yield 35% predictive maintenance gains, positioning edge-stream leaders for explosive revenue.

AI-ML Fusion for Predictive Streaming Insights

AI-driven predictive models in streaming analytics unlock opportunities amid big data surges, fusing machine learning with real-time flows. MIT studies show 85% accuracy in fraud prediction via TensorFlow on Apache Spark, vital for finance where JPMorgan pilots prevented $2B losses. Google's 2024 Vertex AI updates process 1M+ events/second, per dev blogs, aligning with IMF calls for real-time risk tools post-2023 banking scares like SVB. End-users in healthcare gain from patient monitoring, with WHO noting 30% outcome improvements via wearable streams; Philips deployments cut readmissions 25%. This positions innovators for explosive segment leadership across BFSI and MedTech.

Category-wise Analysis

Software Insights

Cloud-Based Platforms lead the Software category in Streaming Analytics Market with 62% share, driven by unmatched scalability and cost-efficiency. AWS reports 50% lower TCO versus on-premise, per 2025 cloud index, handling petabyte-scale streams effortlessly via auto-scaling. Gartner peer insights confirm that 70% of Fortune 500 firms prefer cloud for elasticity, as Kafka clusters scale 10x faster with zero config changes. This dominance stems from hybrid cloud trends, with Microsoft Azure uptime at 99.99% and Netflix processing 2T events daily. DevOps shifts further justify leadership, slashing deployment times 60% per CNCF surveys.

Deployment Insights

Cloud-based deployment commands 68% share in Deployment, fueled by rapid provisioning and global accessibility across 100+ regions. Google Cloud data shows 60% faster deployments than on-premises, per 2024 benchmarks, ideal for volatile workloads like e-commerce peaks. Apache Software Foundation metrics reveal 80% of open-source streams run cloud-native, reducing infra costs 40% via serverless models. Leadership persists due to multi-tenancy supporting 5G surges, as IBM Cloud Pak validates with zero-downtime scaling and Uber handling 10M+ rides daily. Kubernetes integration ensures 99.95% reliability, cementing dominance amid digital transformation.

Application Insights

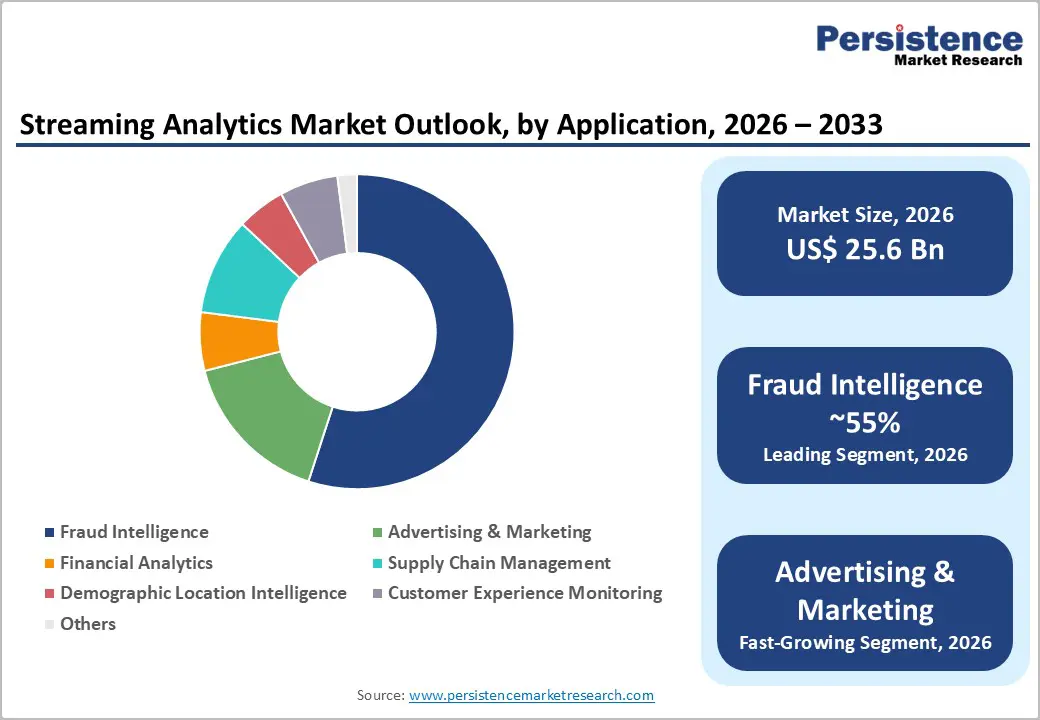
Fraud Intelligence dominates Application with 55% share, propelled by escalating cyber risks in digital transactions. Federal Bureau of Investigation IC3 reported $12.5 billion losses in 2024, up 22%, spurring real-time detection where SAP Fraud Management flags 95% anomalies instantly via ML streams. Visa stats show 45% loss reductions, with $30B safeguarded annually, cementing lead as banks like HSBC prioritize streams over batch analytics for vigilance 24/7. Apache Storm topologies enable sub-second alerts, per FINRA guidelines, outpacing legacy systems by 70% in FinTech hubs.

End-user Insights

IT & Telecom holds 60% in End-use, anchored by network optimization needs amid explosive connectivity growth. GSMA projects 5G generating 175 zettabytes by 2025, overwhelming legacy systems and demanding streaming for traffic management. Ericsson Mobility Report notes 50% latency cuts via analytics, enabling URLLC for industrial IoT. Nokia deployments in Verizon networks confirm 35% efficiency gains, optimizing RAN slices dynamically. Leadership solidifies as the sector invests $1T+ in infra per ITU data, with AT&T streams forecasting 40% churn reduction. Apache NiFi flows handle billions of events daily, positioning telecom giants for edge-to-core dominance in 6G preps.

streaming-analytics-market-outlook-by-application-2026-2033

Regional Insights

North America Streaming Analytics Market Trends

North America leads via U.S. innovation hubs like Silicon Valley, where 70% of global AI patents originate per USPTO 2025 filings, fueling streaming breakthroughs. FCC 5G spectrum auctions enabled Oracle and IBM pilots processing 1B events daily for Verizon edge analytics.

Regulatory frameworks like NIST cybersecurity standards foster trust, with DHS mandates driving 40% adoption in government sectors for threat hunting. Streaming Analytics Market thrives on venture funding exceeding $20B in 2024 per NVCA, backing Snowflake expansions and Databricks Lakehouse streams. Seattle and Austin hubs add 25% talent pool growth.

Europe Streaming Analytics Market Trends

Europe advances through Germany's Industry 4.0 initiative and U.K. fintech leadership, with Eurostat logging 15% yearly data growth across EU-27 economies. Fraunhofer Institute trials integrate streaming analytics for smart factories, cutting energy consumption 25% via predictive maintenance on Siemens Amberg lines producing 15M components yearly. Bosch Rexroth deployments confirm 30% throughput gains.

GDPR harmonization across France, Spain, and the Nordics ensures compliant scaling, as SAP HANA deployments in DACH region achieve 99.9% uptime processing 10B events daily. EU Digital Decade targets boost 30% digital intensity by 2030, with Horizon Europe allocating €95B for AI infra. Sweden's Ericsson and Volvo pilots showcase 40% supply chain visibility gains.

Asia Pacific Streaming Analytics Market Trends

Asia Pacific surges with China's Digital Silk Road, where MIIT reports 1.2 billion 5G users by 2025, generating 500 zettabytes annually. Huawei Fusion Insight streams optimize e-commerce, handling Alibaba's Black Friday peaks of 583K orders/minute with <100ms latency.

India and ASEAN leverage manufacturing edges, with NASSCOM noting 40% analytics growth as Tata and Foxconn deploy streams for EV battery monitoring. Japan's Society 5.0 integrates IoT, per METI, fueling 50% segment expansion through Toyota's 50M connected vehicles streaming telemetry data. Singapore's IMDA smart nation initiatives add 35% public sector adoption, positioning APAC for edge AI dominance.

streaming-analytics-market-outlook-by-region-2026-2033

Competitive Landscape

The Streaming Analytics Market is moderately consolidated, with top players like Oracle, IBM, and Google holding 45% share via integrated ecosystems. Leaders pursue M&A for edge AI, as Microsoft acquired 2024 stream startups. R&D focuses on federated learning, differentiating via low-latency APIs. Emerging models emphasize pay-per-query, per Apache trends, fostering hybrid expansions.

Key Developments:

  • In July 2024, IBM acquired StreamSets and web Methods from Software AG, strengthening its automation, data, and AI offerings, and offering clients a comprehensive integration platform.
  • In June 2024, Informatica Inc. launched new generative AI and Snowflake native app offerings on the Snowflake AI Data Cloud, streamlining data integration and access management.
  • In May 2024, Striim appointed Neil Holloway as Senior Vice President of Strategic Partnerships to accelerate revenue growth through partnerships. Holloway brought 35 years of leadership experience from Microsoft, further strengthening Striim’s partnership with Microsoft Azure.

Companies Covered in Streaming Analytics Market

  • Oracle Corporation
  • IBM
  • Google
  • Microsoft
  • SAP
  • Amazon Web Services
  • TIBCO Software AG
  • Cloudera
  • Apache Software
  • Altair
  • Red Hat
  • Confluent
  • Others
Frequently Asked Questions

The Streaming Analytics Market valued at US$ 25.6 Bn in 2026, it reaches US$ 95.0 Bn by 2033 at 20.6% CAGR, driven by real-time data needs.

IoT-5G data explosion and fraud detection demands, with 25B connections fueling 30% efficiency gains per industry reports.

Fraud Intelligence with 55% share, justified by $12.5B annual losses requiring instant analytics.

North America, via U.S. innovation and NIST regulations, holding 40% global share.

IBM, Google, Oracle, Microsoft, leading with integrated platforms and 45% combined share.

Global Streaming Analytics Market Report Scope
Report Attribute Details

Historical Data/Actuals

2019 - 2024

Forecast Period

2026 - 2033

Market Analysis Units

Value: US$ Bn, Volume: Units

Geographical Coverage

  • North America
  • Europe
  • Asia Pacific
  • Latin America
  • Middle East & Africa

Segmental Coverage

  • Software
  • Services
  • Deployment
  • Application
  • End-use
  • Region

Competitive Analysis

  • Oracle Corporation
  • IBM
  • Google
  • Microsoft
  • SAP
  • Amazon Web Services
  • TIBCO Software AG
  • Cloudera
  • Apache Software
  • Altair
  • Red Hat
  • Confluent
  • Others

Report Highlights

  • Market Forecast and Trends
  • Competitive Intelligence & Share Analysis
  • Growth Factors and Challenges
  • Strategic Growth Initiatives
  • Pricing Analysis & Technology Roadmap
  • Future Opportunities and Revenue Pockets
  • Market Analysis Tools
Market Segmentation

By Software

  • Platform
  • On-Premise
  • Cloud-Based

By Services

  • Professional Service
  • Managed Services
  • Other Service

By Deployment

  • Cloud-based
  • On-premises

By Application

  • Advertising & Marketing
  • Financial Analytics
  • Supply Chain Management
  • Demographic Location Intelligence
  • Fraud Intelligence
  • Customer Experience Monitoring
  • Others

By End-user

  • IT & Telecom
  • Media and Entertainment
  • Retail & E-commerce
  • Manufacturing
  • BESI
  • Healthcare
  • Government
  • Education
  • Others

By Region

  • North America
  • Europe
  • East Asia
  • South Asia and Oceania
  • Latin America
  • Middle East and Africa

Related Reports

  1. Executive Summary
    1. Global Streaming Analytics Market Snapshot 2026 and 2033
    2. Market Opportunity Assessment, 2026-2033, US$ Bn
    3. Key Market Trends
    4. Industry Developments and Key Market Events
    5. Demand Side and Supply-Side Analysis
    6. PMR Analysis and Recommendations
  2. Market Overview
    1. Market Scope and Definitions
    2. Value Chain Analysis
    3. Macro-Economic Factors
      1. Global GDP Outlook
      2. Global Manufacturing Industry Overview
      3. Global Healthcare Industry Overview
    4. Forecast Factors – Relevance and Impact
    5. COVID-19 Impact Assessment
    6. PESTLE Analysis
    7. Porter's Five Forces Analysis
    8. Geopolitical Tensions: Market Impact
    9. Regulatory and Technology Landscape
  3. Market Dynamics
    1. Drivers
    2. Restraints
    3. Opportunities
    4. Trends
  4. Price Trend Analysis, 2020 – 2033
    1. Region-wise Price Analysis
    2. Price by Segments
    3. Price Impact Factors
  5. Global Streaming Analytics Market Outlook: Historical (2020 – 2025) and Forecast (2026 – 2033)
    1. Key Highlights
    2. Global Streaming Analytics Market Outlook: Software
      1. Introduction/Key Findings
      2. Historical Market Size (US$ Bn) and Volume (Units) Analysis by Software, 2020-2025
      3. Current Market Size (US$ Bn) and Volume (Units) Forecast, by Software, 2026-2033
        1. Platform
          1. On-Premise
          2. Cloud-Based
        2. Services
          1. Professional Services
          2. Managed Services
          3. Other Services
      4. Market Attractiveness Analysis: Software
    3. Global Streaming Analytics Market Outlook: Deployment
      1. Introduction/Key Findings
      2. Historical Market Size (US$ Bn) and Volume (Units) Analysis by Deployment, 2020-2025
      3. Current Market Size (US$ Bn) and Volume (Units) Forecast, by Deployment, 2026-2033
        1. Cloud-based
        2. On-premises
      4. Market Attractiveness Analysis: Deployment
    4. Global Streaming Analytics Market Outlook: Application
      1. Introduction/Key Findings
      2. Historical Market Size (US$ Bn) and Volume (Units) Analysis by Application, 2020-2025
      3. Current Market Size (US$ Bn) and Volume (Units) Forecast, by Application, 2026-2033
        1. Advertising & Marketing
        2. Financial Analytics
        3. Supply Chain Management
        4. Demographic Location Intelligence
        5. Fraud Intelligence
        6. Customer Experience Monitoring
        7. Others
      4. Market Attractiveness Analysis: Application
    5. Global Streaming Analytics Market Outlook: End-use 
      1. Introduction/Key Findings
      2. Historical Market Size (US$ Bn) and Volume (Units) Analysis by End-use , 2020-2025
      3. Current Market Size (US$ Bn) and Volume (Units) Forecast, by End-use , 2026-2033
        1. IT & Telecom
        2. Media and Entertainment
        3. Retail & E-commerce
        4. Manufacturing
        5. BESI
        6. Healthcare
        7. Government
        8. Education
        9. Others
      4. Market Attractiveness Analysis: End-use 
  6. Global Streaming Analytics Market Outlook: Region
    1. Key Highlights
    2. Historical Market Size (US$ Bn) and Volume (Units) Analysis by Region, 2020-2025
    3. Current Market Size (US$ Bn) and Volume (Units) Forecast, by Region, 2026-2033
      1. North America
      2. Europe
      3. East Asia
      4. South Asia & Oceania
      5. Latin America
      6. Middle East & Africa
    4. Market Attractiveness Analysis: Region
  7. North America Streaming Analytics Market Outlook: Historical (2020 – 2025) and Forecast (2026 – 2033)
    1. Key Highlights
    2. Pricing Analysis
    3. North America Market Size (US$ Bn) and Volume (Units) Forecast, by Country, 2026-2033
      1. U.S.
      2. Canada
    4. North America Market Size (US$ Bn) and Volume (Units) Forecast, by Software, 2026-2033
      1. Platform
        1. On-Premise
        2. Cloud-Based
      2. Services
        1. Professional Services
        2. Managed Services
        3. Other Services
    5. North America Market Size (US$ Bn) and Volume (Units) Forecast, by Deployment, 2026-2033
      1. Cloud-based
      2. On-premises
    6. North America Market Size (US$ Bn) and Volume (Units) Forecast, by Application, 2026-2033
      1. Advertising & Marketing
      2. Financial Analytics
      3. Supply Chain Management
      4. Demographic Location Intelligence
      5. Fraud Intelligence
      6. Customer Experience Monitoring
      7. Others
    7. North America Market Size (US$ Bn) and Volume (Units) Forecast, by End-use , 2026-2033
      1. IT & Telecom
      2. Media and Entertainment
      3. Retail & E-commerce
      4. Manufacturing
      5. BESI
      6. Healthcare
      7. Government
      8. Education
      9. Others
  8. Europe Streaming Analytics Market Outlook: Historical (2020 – 2025) and Forecast (2026 – 2033)
    1. Key Highlights
    2. Pricing Analysis
    3. Europe Market Size (US$ Bn) and Volume (Units) Forecast, by Country, 2026-2033
      1. Germany
      2. Italy
      3. France
      4. U.K.
      5. Spain
      6. Russia
      7. Rest of Europe
    4. Europe Market Size (US$ Bn) and Volume (Units) Forecast, by Software, 2026-2033
      1. Platform
        1. On-Premise
        2. Cloud-Based
      2. Services
        1. Professional Services
        2. Managed Services
        3. Other Services
    5. Europe Market Size (US$ Bn) and Volume (Units) Forecast, by Deployment, 2026-2033
      1. Cloud-based
      2. On-premises
    6. Europe Market Size (US$ Bn) and Volume (Units) Forecast, by Application, 2026-2033
      1. Advertising & Marketing
      2. Financial Analytics
      3. Supply Chain Management
      4. Demographic Location Intelligence
      5. Fraud Intelligence
      6. Customer Experience Monitoring
      7. Others
    7. Europe Market Size (US$ Bn) and Volume (Units) Forecast, by End-use , 2026-2033
      1. IT & Telecom
      2. Media and Entertainment
      3. Retail & E-commerce
      4. Manufacturing
      5. BESI
      6. Healthcare
      7. Government
      8. Education
      9. Others
  9. East Asia Streaming Analytics Market Outlook: Historical (2020 – 2025) and Forecast (2026 – 2033)
    1. Key Highlights
    2. Pricing Analysis
    3. East Asia Market Size (US$ Bn) and Volume (Units) Forecast, by Country, 2026-2033
      1. China
      2. Japan
      3. South Korea
    4. East Asia Market Size (US$ Bn) and Volume (Units) Forecast, by Software, 2026-2033
      1. Platform
        1. On-Premise
        2. Cloud-Based
      2. Services
        1. Professional Services
        2. Managed Services
        3. Other Services
    5. East Asia Market Size (US$ Bn) and Volume (Units) Forecast, by Deployment, 2026-2033
      1. Cloud-based
      2. On-premises
    6. East Asia Market Size (US$ Bn) and Volume (Units) Forecast, by Application, 2026-2033
      1. Advertising & Marketing
      2. Financial Analytics
      3. Supply Chain Management
      4. Demographic Location Intelligence
      5. Fraud Intelligence
      6. Customer Experience Monitoring
      7. Others
    7. East Asia Market Size (US$ Bn) and Volume (Units) Forecast, by End-use , 2026-2033
      1. IT & Telecom
      2. Media and Entertainment
      3. Retail & E-commerce
      4. Manufacturing
      5. BESI
      6. Healthcare
      7. Government
      8. Education
      9. Others
  10. South Asia & Oceania Streaming Analytics Market Outlook: Historical (2020 – 2025) and Forecast (2026 – 2033)
    1. Key Highlights
    2. Pricing Analysis
    3. South Asia & Oceania Market Size (US$ Bn) and Volume (Units) Forecast, by Country, 2026-2033
      1. India
      2. Southeast Asia
      3. ANZ
      4. Rest of SAO
    4. South Asia & Oceania Market Size (US$ Bn) and Volume (Units) Forecast, by Software, 2026-2033
      1. Platform
        1. On-Premise
        2. Cloud-Based
      2. Services
        1. Professional Services
        2. Managed Services
        3. Other Services
    5. South Asia & Oceania Market Size (US$ Bn) and Volume (Units) Forecast, by Deployment, 2026-2033
      1. Cloud-based
      2. On-premises
    6. South Asia & Oceania Market Size (US$ Bn) and Volume (Units) Forecast, by Application, 2026-2033
      1. Advertising & Marketing
      2. Financial Analytics
      3. Supply Chain Management
      4. Demographic Location Intelligence
      5. Fraud Intelligence
      6. Customer Experience Monitoring
      7. Others
    7. South Asia & Oceania Market Size (US$ Bn) and Volume (Units) Forecast, by End-use , 2026-2033
      1. IT & Telecom
      2. Media and Entertainment
      3. Retail & E-commerce
      4. Manufacturing
      5. BESI
      6. Healthcare
      7. Government
      8. Education
      9. Others
  11. Latin America Streaming Analytics Market Outlook: Historical (2020 – 2025) and Forecast (2026 – 2033)
    1. Key Highlights
    2. Pricing Analysis
    3. Latin America Market Size (US$ Bn) and Volume (Units) Forecast, by Country, 2026-2033
      1. Brazil
      2. Mexico
      3. Rest of LATAM
    4. Latin America Market Size (US$ Bn) and Volume (Units) Forecast, by Software, 2026-2033
      1. Platform
        1. On-Premise
        2. Cloud-Based
      2. Services
        1. Professional Services
        2. Managed Services
        3. Other Services
    5. Latin America Market Size (US$ Bn) and Volume (Units) Forecast, by Deployment, 2026-2033
      1. Cloud-based
      2. On-premises
    6. Latin America Market Size (US$ Bn) and Volume (Units) Forecast, by Application, 2026-2033
      1. Advertising & Marketing
      2. Financial Analytics
      3. Supply Chain Management
      4. Demographic Location Intelligence
      5. Fraud Intelligence
      6. Customer Experience Monitoring
      7. Others
    7. Latin America Market Size (US$ Bn) and Volume (Units) Forecast, by End-use , 2026-2033
      1. IT & Telecom
      2. Media and Entertainment
      3. Retail & E-commerce
      4. Manufacturing
      5. BESI
      6. Healthcare
      7. Government
      8. Education
      9. Others
  12. Middle East & Africa Streaming Analytics Market Outlook: Historical (2020 – 2025) and Forecast (2026 – 2033)
    1. Key Highlights
    2. Pricing Analysis
    3. Middle East & Africa Market Size (US$ Bn) and Volume (Units) Forecast, by Country, 2026-2033
      1. GCC Countries
      2. South Africa
      3. Northern Africa
      4. Rest of MEA
    4. Middle East & Africa Market Size (US$ Bn) and Volume (Units) Forecast, by Software, 2026-2033
      1. Platform
        1. On-Premise
        2. Cloud-Based
      2. Services
        1. Professional Services
        2. Managed Services
        3. Other Services
    5. Middle East & Africa Market Size (US$ Bn) and Volume (Units) Forecast, by Deployment, 2026-2033
      1. Cloud-based
      2. On-premises
    6. Middle East & Africa Market Size (US$ Bn) and Volume (Units) Forecast, by Application, 2026-2033
      1. Advertising & Marketing
      2. Financial Analytics
      3. Supply Chain Management
      4. Demographic Location Intelligence
      5. Fraud Intelligence
      6. Customer Experience Monitoring
      7. Others
    7. Middle East & Africa Market Size (US$ Bn) and Volume (Units) Forecast, by End-use , 2026-2033
      1. IT & Telecom
      2. Media and Entertainment
      3. Retail & E-commerce
      4. Manufacturing
      5. BESI
      6. Healthcare
      7. Government
      8. Education
      9. Others
  13. Competition Landscape
    1. Market Share Analysis, 2025
    2. Market Structure
      1. Competition Intensity Mapping
      2. Competition Dashboard
    3. Company Profiles
      1. Oracle Corporation
        1. Company Overview
        2. Product Portfolio/Offerings
        3. Key Financials
        4. SWOT Analysis
        5. Company Strategy and Key Developments
      2. IBM
      3. Google
      4. Microsoft
      5. SAP
      6. Amazon Web Services
      7. TIBCO Software AG
      8. Cloudera
      9. Apache Software
      10. Altair
  14. Appendix
    1. Research Methodology
    2. Research Assumptions
    3. Acronyms and Abbreviations

Research Methodology Framework for Market Research Excellence

At Persistence Market Research, we implement a comprehensive, validated, and multi-dimensional approachto market analysis that delivers actionable insights across complex market landscapes. Our methodology combines the analytical rigor of leading consulting firms with innovative research techniques, ensuring robust market assessments that guide strategic decision-making with confidence.

Core Research Philosophy

Our methodology is built on four foundational pillars:

Research Philosophy Image

At Persistence Market Research, our methodology is designed to transcend conventional market studies by combining analytical rigor, multi-source validation, and future-focused insights.

We integrate advanced research frameworks, robust data collection strategies, cutting-edge analytics, and innovative technologies to deliver a 360-degree view of complex markets.

We integrate advanced research frameworks, robust data collection strategies, cutting-edge analytics, and innovative technologies to deliver a 360-degree view of complex markets.

Each stage spanning from strategic scoping and hypothesis-building to competitive intelligence, quality validation, and actionable recommendations is engineered to provide clients with unmatched clarity, precision, and confidence in decision-making.

By embedding innovation and technology at the core, our approach ensures that insights are not only comprehensive but also predictive, empowering businesses to seize opportunities, mitigate risks, and achieve sustainable growth

Research Philosophy Image

Capturing Key Information and Events

During this phase, key research objectives focus on essential information and data points for assessing the market, including:

Research Philosophy Image

TAM-SAM-SOM Framework Implementation

We employ both top-down and bottom-up approaches to ensure accurate market sizing.

Top-Down Market SizingBottom-Up Market Sizing
Universe Definition: Total global/regional market identificationUnit Economics: Average transaction values, purchase frequencies, customer lifecycle
Segmentation Filters: Geographic, demographic, and behavioral constraintsCustomer Segmentation: Detailed buyer persona development and sizing
Market Share Analysis: Competitive landscape assessment and share allocationPenetration Analysis: Market penetration rates by segment and geography
Growth Rate Application: Historical trends and forward-looking growth assumptionsScaling Methodology: Extrapolation techniques with confidence intervals

Validation & Cross-Verification

  • Triangulation: Comparing top-down and bottom-up results for consistency
  • Sensitivity Analysis: Testing key assumptions and parameter variations
  • Peer Benchmarking: Comparison with analogous markets and industry benchmarks
  • Expert Review: External validation through industry specialist consultation

Research Philosophy Image

Forecasting & Projection Modeling

Our proprietary forecasting models incorporate multiple variables and scenarios.

Forecasting Components

  • Historical Trend Analysis: 10-year historical growth patterns and cyclical variations
  • Driver-Based Modeling: Economic indicators, demographic shifts, technology adoption
  • Scenario Planning: Base case, optimistic, and conservative projections
  • Monte Carlo Simulations: Probability-weighted outcomes and risk assessments

Model Validation

  • Back-Testing: Historical accuracy assessment over 3–5-year periods
  • Cross-Validation: Multiple modeling approaches for result comparison
  • External Benchmarking: Comparison with established market forecasts
  • Continuous Calibration: Quarterly model updates based on new data

Comprehensive Data Collection Strategy

Our secondary research phase establishes a robust knowledge base utilizing diverse, credible sources.

Secondary Data Sourcess

  • Industry Publications & Reports
  • Government & Regulatory Data
  • Financial Intelligence (filings & reports)
  • Academic Research & Digital Intelligence

Quality Assurance Protocol

  • Source credibility assessment and publication date validation
  • Data consistency checks across multiple sources
  • Bias identification and neutralization techniques
  • Information gap tracking for primary research prioritization

Research Philosophy Image

Primary Research Excellence

Our primary research methodology employs best-in-class techniques to capture unique market insights.

Quantitative Research Methods

  • Large-Scale Surveys: Statistically representative samples with 95% confidence intervals
  • Survey Methodology: Multi-channel deployment (online, telephone, in-person)
  • Question Architecture and Response Optimization

Qualitative Research Methods

  • Executive Interviews
  • Focus Groups
  • Expert Consultations

Quality Assurance & Validation Framework

Multi-Stage Validation Process

  • Source Verification and Consistency Testing
  • Outlier Detection and Bias Assessment
  • Peer Review Process and External Validation
  • Sensitivity Analysis and Confidence Intervals

Research Philosophy Image

Methodology Validation & Credibility

Our research methodology has been extensively validated through:

  • Academic Partnerships: Collaborations with top-tier business schools and research institutions
  • Client Success Stories: Documented case studies demonstrating research impact and ROI
  • Continuous Benchmarking: Performance comparison with leading global research firms

This comprehensive methodology framework positions Persistence Market Research at the forefront of market intelligence, combining the analytical sophistication of top-tier consulting firms with innovative research techniques. Our approach ensures that every market assessment delivers precise, actionable, and strategically valuable insights that drive business success in competitive market environments.

Ready to unlock your market potential? Contact our research experts to discuss how our validated methodology can transform your strategic decision-making with data-driven market intelligence.

Copyright © 2026 Persistence Market Research. All Rights Reserved

Connect With Us -