


- Renewable Energy
- Shore Power Market
Shore Power Market Size, Share, and Growth Forecast, 2025 - 2032
Shore Power Market By Component (Transformers, Switchgears, Frequency Converters, Cables & Accessories, Control Panels, Connectors, Others), Installation Type (Shoreside, Shipside), Power Rating (Up to 30 MVA, 30 MVA to 60 MVA, Above 60 MVA), and Regional Analysis for 2025 - 2032
Shore Power Market Share and Trends Analysis
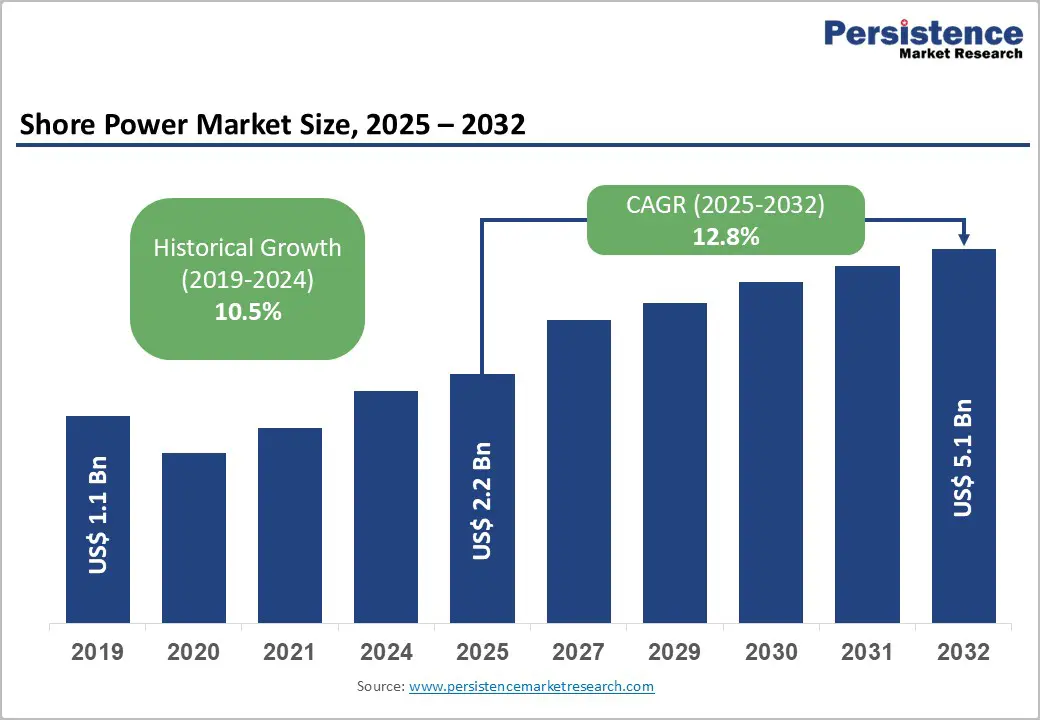
The global shore power market size is likely to be valued at US$2.2 Billion in 2025, and is estimated to reach US$5.1 Billion by 2032, growing at a CAGR of 12.7% during the forecast period 2025 - 2032, driven by stringent International Maritime Organization (IMO) emission regulations, port electrification mandates of the European Union (EU), and escalating environmental compliance costs for vessel operators.
Shore power adoption is shifting from voluntary green efforts to regulatory mandates, driven by container, cruise, and offshore vessels across North America, Europe, and Asia Pacific. Growth faces technical standardization challenges but benefits from rising port electrification, creating opportunities for tech providers and proactive ports managing grid upgrades and conversion complexities.
Key Industry Highlights
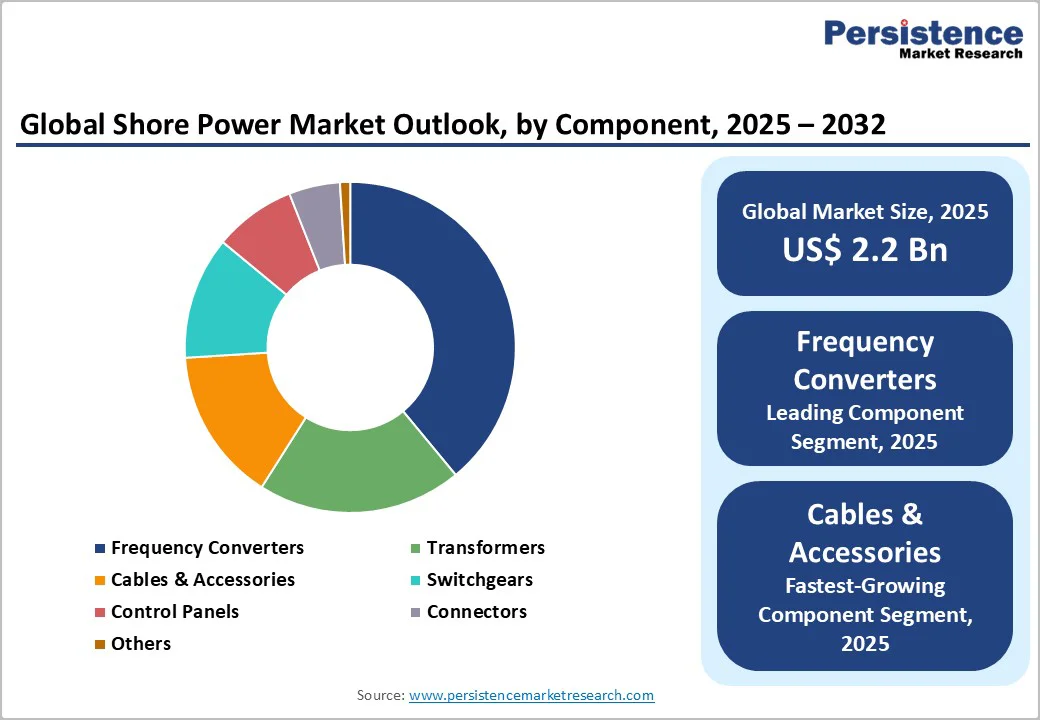
- Component Leadership: Frequency converters command 39% of the market revenue share in 2025, due to universal grid-to-vessel frequency incompatibility.
- Fastest-growing Component: Cables and connectivity equipment are expected to grow the fastest, reflecting multi-berth infrastructure expansion.
- Installation Type Dynamics: Shoreside installations dominate with 88% in 2025, while shipside installations are the fastest-growing category.
- Power Rating Dominance: Medium-capacity (up to 30 MVA) systems command 54% of the market share in 2025, while ultra-high-capacity (above 60 MVA) systems grow the fastest, driven by mega-container vessel proliferation and dual-berth infrastructure modernization.
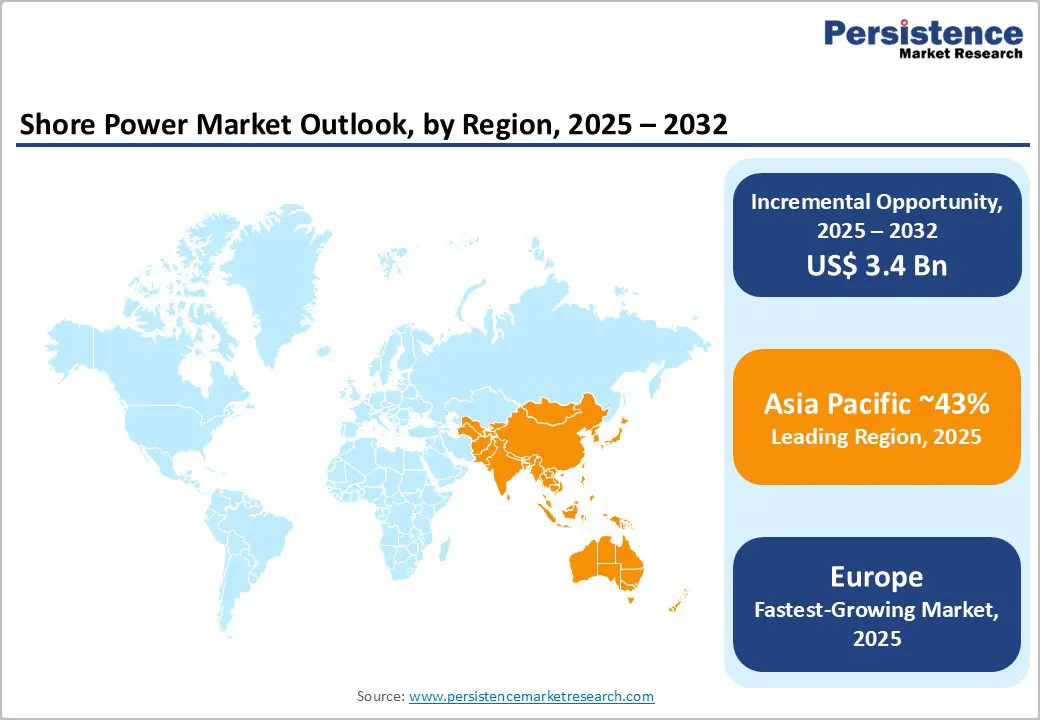
- Regional Leadership: Asia Pacific captures 43% of the global market share in 2025, with China accounting for 65% of shore power activity.
- Regulatory Acceleration: EU FuelEU Maritime Regulation and IMO Net-Zero Framework create a synchronized deployment deadline window of 2028 - 2030, driving procurement acceleration.
- Technology Evolution Drivers: Advanced frequency conversion, modular system architecture, and digital grid management systems are creating cost reduction pathways and enabling smaller port participation.
- Emerging Consortium Financing Model: Infrastructure-as-a-Service (IaaS) and multi-port onshore power supply (OPS) consortia are unlocking deployment capital worth billions for underinvested regions.
- November 2025: The U.K.’s Portsmouth International Port completed a successful dry run of its new shore power system, which will enable the port's LNG-electric hybrid ferries to charge batteries and reduce emissions by using onshore electricity while berthed.
| Key Insights | Details |
|---|---|
| Shore Power Market Size (2025E) | US$2.2 Bn |
| Market Value Forecast (2032F) | US$5.1 Bn |
| Projected Growth (CAGR 2025 to 2032) | 12.7% |
| Historical Market Growth (CAGR 2019 to 2024) | 10.5% |
Market Factors - Growth, Barriers, and Opportunity Analysis
Grid Decarbonization and Renewable Energy Integration to Create Power Transition Incentives
European and Asian ports are increasingly linking their shore power systems to renewable energy sources, which changes both the environmental benefits and economic incentives for adoption.
Countries such as Germany, under its Energiewende policy, and the Nordic nations, including Sweden, Norway, and Denmark, generate most of their electricity from renewables, enabling ports to offer truly zero-emission shore power. This energy mix allows these ports to charge higher fees for cleaner maritime services or encourage use through lower electricity prices.
Ports reliant on coal-heavy grids face higher operational costs, limiting their competitive edge. These renewable integrations demand advanced power quality management equipment that stabilizes the electrical supply despite fluctuations typical of wind and solar power.
Ports in these renewable-rich regions benefit from lower overall energy costs, giving them a market advantage and speeding shore power adoption, especially in Northern Europe, Scandinavia, and parts of Asia with strong clean energy policies.
Grid Capacity Constraints and Electrical Infrastructure Deficits
Grid capacity limits and outdated infrastructure are major barriers to shore power expansion. Many ports lack electrical systems capable of supporting multiple high-load vessel connections, requiring costly upgrades and three to five-year timelines.
Developing regions often need entirely new distribution networks. These constraints slow deployment, create hesitation between ports and ship operators, and have already delayed several European projects, threatening compliance with upcoming emissions regulations.
Port Electrification Consortium Model and Infrastructure-as-a-Service Financing
Port Electrification-as-a-Service (PEaaS) and consortium financing models are emerging as key solutions for expanding shore power in underfunded regions. Instead of each port securing large upfront capital independently, multiple ports in a region pool demand and share infrastructure costs, reducing procurement expenses considerably.
For example, ports such as Singapore, Klang, and Bangkok are studying a Southeast Asian OPS consortium to standardize systems and cut costs. Development banks and impact investors are supporting these models by offering low-cost financing with favorable terms, making projects viable for smaller ports previously unable to invest.
Regional financial institutions such as the Asian Development Bank (ADB) are funding large-scale green and sustainable infrastructure projects in emerging Asian economies.
By converting capital expenses into manageable operating expenses, PEaaS enables infrastructure developers and independent operators to deliver and maintain shore power as a service. This approach could unlock a market worth several billion dollars in regions currently underserved, which presently capture only a small percentage of total deployment investment.
Category-wise Analysis
Component Insights
Frequency converters dominate, accounting for roughly 39% of shore power revenue in 2025, primarily as global ports operate at 50 Hz while most vessels use 60 Hz electrical systems, creating a universal demand for conversion technology. Modern static frequency converters, built with semiconductor technology, outperform older rotating designs through superior efficiency, lower maintenance needs, and predictive diagnostics.
Demand primarily stems from retrofitting existing fleets and equipping newly built vessels with shore power. The high capital intensity and technical complexity limit the number of suppliers to roughly a dozen major manufacturers, with ABB, Siemens, and Schneider Electric accounting for the majority of sales.
Cables and connectivity equipment represent the fastest-growing segment, as ports add more shore power berths, demand grows for standardized, high-capacity cables and modern connectors equipped with monitoring sensors. Advanced cables with fiber-optic diagnostics and thermal monitoring command premium pricing compared to traditional designs.
Major European ports such as Rotterdam and Hamburg are standardizing equipment specifications to simplify procurement and reduce costs. The cable market is more fragmented than the frequency converter market, with the top five suppliers controlling roughly half the revenue and creating room for regional specialists to compete.
Installation Type Insights
Shoreside installations make up around 88% of the shore power market revenue in 2025. In this configuration, electrical equipment such as transformers and frequency converters is installed on land, which standardizes connections for vessels. This centralized approach is more cost-efficient, as a single frequency converter can serve multiple births, lowering expenses compared to per-vessel equipment.
Shoreside setups also give port operators better control over safety, power quality, and grid management through centralized digital systems, which reduces operational risks. These installations get regulatory approvals faster than shipside retrofits, which require lengthy certification processes.
Major ports such as Los Angeles, Long Beach, Hamburg, and Singapore have established shoreside as the standard due to proven effectiveness, leading to network effects where other ports replicate this model.
The shipside segment is the fastest-growing from 2025 to 2032. Growth is driven by new vessels designed with integrated shore power systems and fleet-wide retrofit programs aimed at ships with long port stays. Major shipyards in South Korea and China have standardized shore power features for large container ships, boosting economies of scale in shipboard equipment production.
Leading cruise lines are also upgrading fleets, enhancing demand for specialized marine electrical contractors and related suppliers. Advances in converter technology have reduced weight and size, making retrofits easier on older vessels with limited space. Insurers are also offering incentives such as hull insurance premium discounts for shore power-compatible ships, improving the economic viability of retrofits.
Power Rating Insights
The up to 30 MVA power rating segment leads the market at roughly 54% share in 2025, optimized for the typical container and cruise vessels operating globally. This capacity range covers the common auxiliary power needs of major vessel classes and benefits from standardized, cost-effective equipment.
Major ports such as Los Angeles, Rotterdam, and Hamburg have adopted 10 MVA specifications, creating market consolidation and reducing per-unit costs through manufacturing scale. The segment has the lowest project failure and delay rates due to mature standardized designs and supplier expertise. Although this segment will remain important, its market share will gradually decline as larger vessels demand higher capacity systems.
High-capacity systems exceeding 60 MVA represent the fastest-growing segment through 2032. New mega-container ships carrying over 22,000 TEU require 18-28 MVA power, pushing ports to install larger shore power systems. Major Asian ports, including Shanghai, Busan, and Hong Kong, are investing heavily in 25-45 MVA installations to serve multiple ultra-large vessels.
These larger systems command premium pricing due to specialized engineering and advanced controls. Ports are also adopting modular designs that break high capacities into smaller units, allowing staged investment and improved reliability. The share of high-capacity systems is likely to grow substantially between 2025 and 2032 as mega-vessel adoption accelerates.
Regional Insights
North America Shore Power Market Trends
North America holds about 22% of the shore power market share in 2025, with the U.S. dominating due to its large port infrastructure. The U.S. ports handle the world’s largest container volume and primarily serve ships operating at 60 Hz power standards.
Regulations from the U.S. Environmental Protection Agency (EPA) and California Air Resources Board have driven rapid adoption, requiring 100% compliance by 2025, leading to a surge in procurement. However, growth is expected to moderate after 2026 as major ports reach capacity.
Pricing pressures from port operators and shipping lines have pushed shore power service margins down to commodity levels, limiting equipment supplier profitability. Grid capacity constraints in major U.S. port areas have significantly increased project costs.
OPS infrastructure is concentrated mainly on the West Coast mega-terminals, leading carriers to focus volume there and slowing the spread of shore power to smaller ports. As a result, the North America shore power market will grow steadily up to 2032, but at a more moderate pace compared to Asia Pacific and Europe.
Europe Shore Power Market Trends
Europe accounts is likely to be the fastest-growing through 2032. This growth is driven by strong EU regulations, coordinated port investment, and high renewable energy integration. The EU’s Alternative Fuels Infrastructure Regulation (AFIR) and FuelEU Maritime Regulation require container ships over 5,000 GT and all passenger vessels to use shore power at EU ports by 2030, creating clear timelines for investment.
Unlike North America’s fragmented regulation, Europe’s standardized OPS technical specifications reduce engineering costs and enable multi-port procurement strategies. Funding sources such as the European Investment Bank (EIB) pose substantially lower capital barriers, allowing smaller ports to participate instead of only the major terminals.
European ports benefit from holistic integration with renewable energy sources, with Denmark, Norway, and Germany generating the majority of their electricity from renewables. This advantage helps ports claim true zero-emission shore power and command service premiums higher than competitors in fossil-fuel-dependent regions.
Northern Europe’s cruise market further boosts demand as cruise lines rotate fleets through compliant ports, driving investments in shore power-compatible retrofits. Organizations, including the European Sea Ports Organization (ESPO), coordinate standardization efforts that reduce costs compared to isolated port projects.
Unlike the more mature North American market, Europe’s shore power sector is set for strong growth, with nearly half of the required infrastructure still to be deployed and significant investment planned through 2030 to meet the EU mandates.
Asia Pacific Shore Power Market Trends
Asia Pacific is the largest market for shore power, capturing about 43% share in 2025, driven by rapid port infrastructure expansion, concentration of mega-container ships, intense manufacturing and export activity, and coordinated government decarbonization policies.
China dominates the regional market, accounting for nearly 65% of shore power activity and hosting seven of the world’s top ten container ports. The Chinese government has announced aggressive shore power policies, providing capital grants and lowering investment hurdles, positioning China as the market leader.
Japan leads in technological sophistication, with multiple ports deploying advanced frequency converters, modular systems, and grid integration technologies. Japan’s carbon neutrality goals and robust electrical infrastructure make its ports international technology hubs and exporters.
India, Vietnam, Thailand, and Indonesia are also launching new shore power projects, often financed by development banks, targeting cost-effective installations to support sustainability goals.
India’s major ports aim for significant OPS deployment by 2028, marking it as the fastest-growing market in the region. Regional market growth also benefits from rising seaborne trade volume and ongoing infrastructure investments across all port tiers. The dominance of mega-container shipbuilding in China and South Korea is driving the demand for shipside retrofits and newbuild integrations, creating a secondary surge in shore power adoption.
Competitive Landscape
The global shore power market is led by key players, including General Electric, Siemens AG, Schneider Electric SE, ABB Ltd., Eaton Corporation, Conntek Integrated Solutions, and Piller Group, who dominate due to advanced technology, established supply chains, and turnkey solution expertise.
Siemens, ABB, and GE generate about 52% of revenue via frequency converters, power distribution, and marine electrical systems. The moderately fragmented market offers growth opportunities for regional firms through alliances, acquisitions, and R&D. Major players pursue mergers, new product launches, and strategic initiatives to meet evolving environmental regulations and expanding shore power infrastructure.
Key Industry Developments
- In November 2025, the Port of Oslo waived quay fees for ships using emission-free shore power, encouraging vessels to turn off engines and connect to onshore electricity. This policy aims to cut air pollution and greenhouse gases, supporting Oslo’s sustainability goals and global efforts to expand the use of shore power.
- In November 2025, MSC Meraviglia connected to shore power at New York’s Brooklyn Cruise Terminal, allowing engine-off operation during port stays. This reduces emissions and improves air quality. Following successful tests, MSC plans winter cruises using shore power to the Bahamas and Florida, supported by the Port of New York’s cleaner infrastructure.
- In September 2025, Wah Kwong, NatPower JV, and SPG partnered to advance shore power and ship charging projects. Their collaboration aims to develop innovative, efficient shore-to-ship power solutions, supporting cleaner maritime operations. This joint effort combines expertise in marine infrastructure and energy systems to accelerate electrification in ports.
Companies Covered in Shore Power Market
- Siemens AG
- ABB Ltd.
- Schneider Electric SE
- Wärtsilä Corporation
- Cavotec SA
- Eaton Corporation
- Prysmian Group
- General Electric Company
- Mitsubishi Electric Corporation
- Hitachi Ltd.
- ESL Power Systems Inc.
- Conntek Integrated Solutions Inc.
- VINCI Energies SA
- Terasaki Electric Co., Ltd.
- Danfoss A/S
Frequently Asked Questions
The global shore power market is projected to reach US$2.2 Billion in 2025.
Stringent IMO emission regulations, port electrification mandates of the EU, and escalating environmental compliance costs for vessel operators are driving the shore power market.
The shore power market is poised to witness a CAGR of 12.7% from 2025 to 2032.
Technical standardization, rising port electrification investments, and the growing support from development financial institutions for PEaaS and consortium financing models are the key market opportunities.
Siemens AG, ABB Ltd., Schneider Electric SE, and Wärtsilä Corporation are some of the key players in the shore power market.


