


- Home Care & Utilities
- Reusable Water Bottles Market
Reusable Water Bottles Market Size, Share, and Growth Forecast 2026 - 2033
Reusable Water Bottles Market by Material Type (Plastic, Stainless Steel, Glass, Silicone, Other), Size (8 to 12 Oz, 16 to 27 Oz, 32 to 64 Oz, Above 64 Oz), Distribution Channel (Supermarket/ Hypermarket, Specialty Stores, Independent Stores, Online Retailers), and Regional Analysis for 2026 - 2033
Reusable Water Bottles Market Size and Trend Analysis
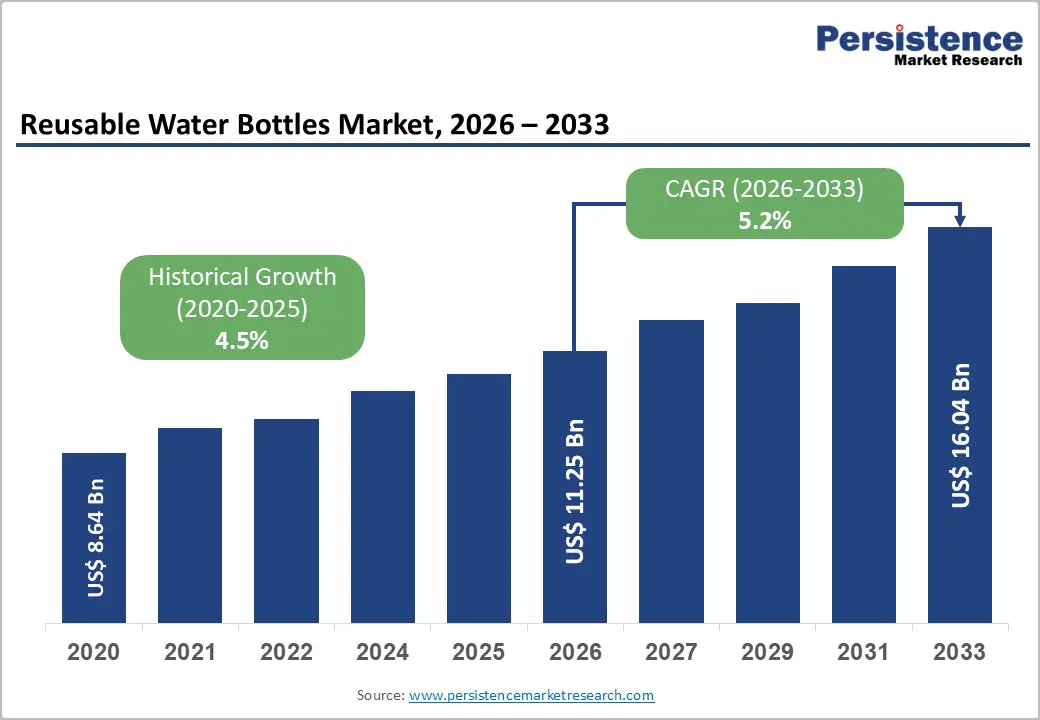
The global reusable water bottles market size is valued at US$ 11.2 Bn in 2026 and is projected to reach US$ 16.0 Bn by 2033, growing at a CAGR of 5.2% between 2026 and 2033.
This growth trajectory is driven by the combined influence of stringent government regulations on single-use plastics, heightened consumer awareness of microplastic contamination in bottled water, and a broader global shift toward sustainable consumption practices. The European Union’s Single-Use Plastics Directive (SUPD), fully effective since July 3, 2021, mandates the removal of several disposable plastic categories, establishes a binding target of 90% plastic bottle collection by 2029, and enforces minimum recycled content requirements. Concurrently, a landmark study published in January 2024 in the Proceedings of the National Academy of Sciences and validated by the National Institutes of Health revealed that a typical liter of bottled water contains approximately 240,000 plastic particles, 90% of them nanoplastics, significantly accelerating consumer preference for reusable, chemically safe hydration solutions.
Key Industry Highlights:
- Regional Leader: Asia Pacific is the leading region in the global Reusable Water Bottles Market, commanding the largest share of global revenues of 40%, driven by China's manufacturing dominance and India's fast-expanding reusable bottle segment.
- Fastest Growing Region: North America emerges as the fastest growing region due to stringent U.S. EPA regulations and high wellness adoption driving reusable shifts.
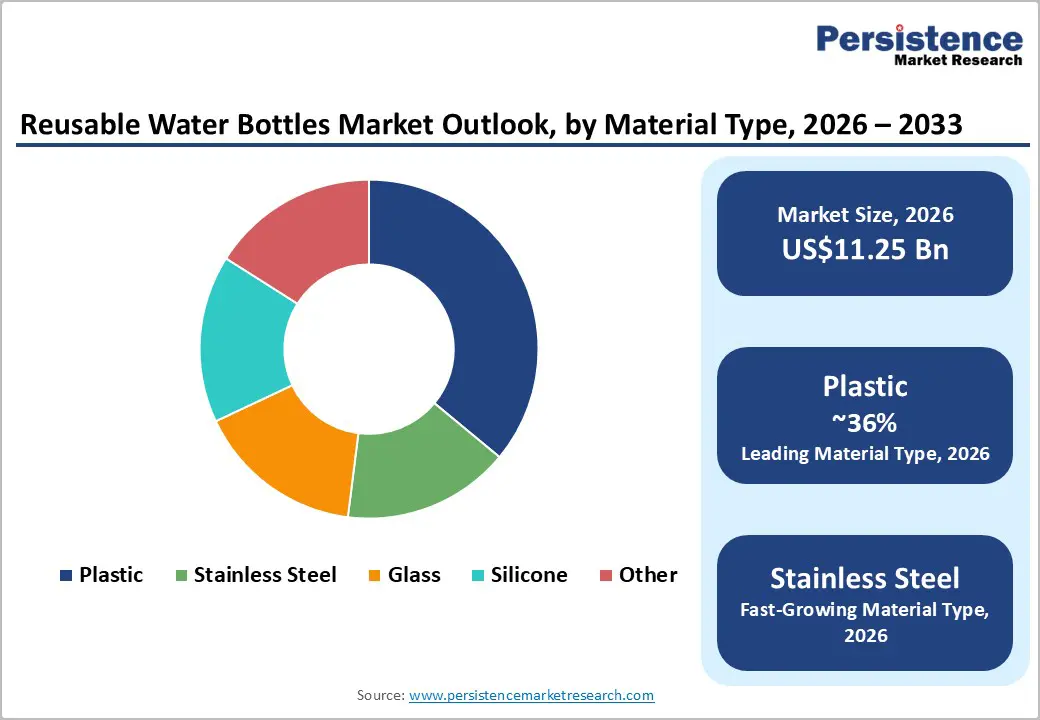
- Leading Material: Plastic is the dominant material segment, holding approximately 36% of total market share in 2026, anchored by its lower retail price, widespread availability, and role as the primary adoption gateway in price-sensitive markets.
- Fastest Growing Material: Online Retail is the fastest-growing distribution channel within the Reusable Water Bottles Market, powered by direct-to-consumer brand expansion, social media-driven product discovery, and the rapid growth of e-commerce platforms enabling premium reusable bottle brands to reach sustainability-focused consumers at scale globally.
- Key Opportunity: Smart hydration technology integration and institutional B2B procurement, with major sporting events including the Paris 2024 Olympics and corporate mandates aligned with UN SDG 12, creating scalable, recurring demand channels for reusable bottle brands with verified sustainability credentials.
| Key Insights | Details |
|---|---|
| Reusable Water Bottles Size (2026E) | US$ 11.2 Bn |
| Market Value Forecast (2033F) | US$ 16.04 Bn |
| Projected Growth CAGR (2026 - 2033) | 5.2% |
| Historical Market Growth (2020 - 2025) | 4.5% |
Market Dynamics
Drivers - Rising Environmental Awareness and Anti-Plastic Campaigns
Global consumers are increasingly moving away from single-use plastics due to rising environmental concerns, driving substantial growth in the demand for reusable water bottles. Plastic packaging represents 40% of global plastic production, yet only 9% is recycled, prompting large-scale initiatives such as World Cleanup Day, which mobilized 60 million volunteers across 190 countries in 2024. Retail data also reflects this shift, with major chains reporting a 25% increase in reusable bottle sales during Earth Day 2025.
Governments are reinforcing this transition through measures like California’s expanded 2024 plastic bag ban, while manufacturers are offering durable, BPA-free designs that significantly reduce landfill waste. Regulatory actions, including the EU’s SUPD and Dubai’s 2026 ban on small plastic bottles, are establishing a long-term framework that accelerates the adoption of reusable hydration solutions.
Health and Wellness Trends Boosting Hydration Habits
Growing scientific evidence highlighting the health risks associated with microplastic and nanoplastic ingestion from single-use bottled water is accelerating consumer movement toward reusable, material-safe hydration products. A landmark study published in January 2024 in the Proceedings of the National Academy of Sciences and referenced by the NIH confirmed that a typical liter of bottled water contains roughly 240,000 plastic fragments, 90% of which are nanoplastics, levels estimated to be 10 to 100 times higher than previously understood. This revelation has intensified public health discussions around bottled water consumption.
In the United States, single-use bottle consumption surged from about 3 billion units in 1997 to 86 billion units in 2021, underscoring the substantial transition potential for reusable bottle brands. As awareness increases, health-conscious consumers across North America, Europe, and Asia Pacific are increasingly adopting BPA-free stainless steel and glass alternatives, reinforcing growth in the premium reusable bottle segment.
Restraints - High Initial Costs and Perceived Premium Pricing
A major commercial challenge in the Reusable Water Bottles Market is the substantial price gap between premium reusable bottles and inexpensive single-use plastic bottles, especially in cost-sensitive segments across emerging economies. High-quality stainless steel and glass bottles from established brands typically range from US$20 to US$60 per unit, whereas multi-packs of single-use plastic bottles can be purchased for under US$5.
For lower-income households in South and Southeast Asia, Latin America, and Sub-Saharan Africa, this upfront expenditure remains a significant deterrent despite clear long-term savings. Consequently, this cost barrier limits market penetration in several high-growth consumer regions and restricts overall addressable demand unless supported by affordable entry-level product tiers or government-backed subsidy and co-branding programs that encourage adoption.
Concerns Over Durability and Hygiene Maintenance
The widespread availability of low-cost, BPA-free plastic reusable water bottles marketed as safe and sustainable is creating a competitive challenge for higher-margin stainless steel and glass manufacturers in the Reusable Water Bottles Market. Commodity-grade plastic bottles, primarily produced in China and other Asian manufacturing hubs, retail for US$5 to US$10, significantly undercutting premium material segments.
Although these products meet the definition of “reusable,” they typically offer shorter lifespans, reduced thermal performance, and continue to face consumer scrutiny regarding long-term chemical safety. Their strong presence across mass-market retail channels captures substantial volume share, exerting downward pressure on average selling prices and intensifying margin constraints for brand-led premium portfolios.
Opportunities - Smart Hydration Technology Integration as a High-Margin Product Innovation Pathway
The convergence of consumer health technology and everyday hydration products is creating a significant near-term innovation opportunity within the Reusable Water Bottles Market. Smart water bottles featuring IoT-enabled hydration tracking, LED reminder indicators, temperature-monitoring systems, and Bluetooth or Wi-Fi connectivity to wellness applications are gaining strong traction among fitness-focused and technology-oriented consumers.
According to the Consumer Technology Association, connected health and wellness devices represent one of the fastest-growing consumer electronics categories, with health-conscious buyers showing a willingness to pay premiums for data-integrated solutions. Brands that effectively combine sustainability benefits with real-time hydration analytics, personalized app features, and modern industrial design can command higher price points, achieve superior margins, and build long-term customer loyalty. As a result, smart hydration solutions are emerging as a distinct and fast-growing segment within the market.
Corporate Sustainability Mandates and Institutional Procurement Creating a Scalable B2B Demand Channel
The rapid global adoption of corporate sustainability commitments and employee wellness initiatives is creating a significant yet underutilized B2B demand channel for reusable water bottle manufacturers. Increasingly, multinational corporations, universities, government institutions, and major international event organizers are eliminating single-use bottled water in alignment with United Nations SDG 12 on responsible consumption and production.
Significant instances include Starbucks’ commitment to reducing plastic waste across its global network and the Paris 2024 Olympic Games’ zero-single-use-plastic policy, which generated substantial bulk demand for branded reusable bottles. Similar commitments from FIFA and other international sporting bodies further reinforce this shift. For manufacturers, this institutional demand provides high-volume procurement, lower marketing costs per unit, enhanced brand visibility through co-branding initiatives, and recurring orders tied to expanding sustainability and wellness programs.
Category-wise Analysis
Material Type Insights
The Plastic segment continues to lead the global Reusable Water Bottles Market, accounting for approximately 36% of total market share in 2026. Despite increasing competitive pressure from premium stainless steel alternatives, BPA-free, Tritan, and recycled-content plastic bottles maintain the highest volume share due to their lower price points, lightweight construction, and broad availability across mass-market retail channels.
Plastic formats also serve as the primary entry point for consumers transitioning away from single-use options, particularly in price-sensitive regions such as South Asia, Southeast Asia, Latin America, and value-oriented segments in North America and Europe. Meanwhile, the Stainless Steel segment remains the fastest-growing category, driven by consumer preference for BPA-free, chemically inert, and vacuum-insulated hydration solutions, supported by innovation from brands such as Klean Kanteen Inc., SIGG Switzerland AG, and Chilly’s Bottles.
Size Insights
The 16 to 27 Oz size segment remains the leading category in the global Reusable Water Bottles Market, accounting for approximately 42% of total market share in 2026. This capacity range aligns well with everyday hydration needs across the largest consumer base, including workplace users, fitness enthusiasts, students, and commuters, making it the standard choice across brands and materials. Its balance of portability and adequate volume enables all-day use with minimal refilling, contributing to its strong market position.
Products within this range also receive the broadest SKU representation across distribution channels, from supermarkets to major e-commerce platforms. Meanwhile, the 32 to 64 Oz segment is gaining momentum among outdoor, sports, and endurance-focused consumers and serves as a notable trade-up option as global participation in active lifestyles continues to grow.
Distribution Channel Insights
The Supermarket and Hypermarket channel holds the leading position in the Reusable Water Bottles Market, accounting for approximately 40% of total market share in 2026. Its dominance reflects the significant role of mass-market retail in ensuring broad consumer access to reusable bottles as everyday household items. High in-store visibility, strategic shelf placement, cross-merchandising with sports and outdoor products, and competitive promotional pricing all contribute to both planned and impulse purchases. Major global retailers such as Walmart, Target, and Carrefour offer extensive assortments across all price tiers, supporting a wide consumer reach.
In contrast, the Online Retailers segment is the fastest-growing channel, driven by the expansion of global e-commerce platforms, direct-to-consumer strategies, social media-led product discovery, and the ease with which sustainability-focused consumers research and purchase premium reusable bottle brands.
Regional Insights
North America Reusable Water Bottles Trends
North America remains an innovation-driven market for reusable water bottles, with the United States leading regional growth due to its large health- and wellness-oriented consumer base, widespread access to safe tap water, and a mature ecosystem of sustainable hydration brands. The scale of single-use plastic bottle consumption, 86 billion units in 2021, underscores the substantial opportunity for reusable alternatives as environmental and health concerns intensify. Producing bottles to meet U.S. demand alone requires more than 17 million barrels of oil annually, reinforcing the urgency of transitioning to reusable options.
Regulatory momentum at state and municipal levels, including bans and surcharges on single-use plastics, complements broader EPA initiatives, while sustainability commitments from corporations, universities, and sports organizations are generating recurring institutional demand. The region’s innovation leaders, including CamelBak, Klean Kanteen, Nalgene, and Thermos, continue to advance materials safety, insulation technology, smart hydration features, and circular design, strengthening North America’s position as a global category leader.
Europe Reusable Water Bottles Trends
Europe remains one of the most regulation-driven and sustainability-focused markets for reusable water bottles, with Germany, the United Kingdom, France, and Spain leading demand due to strong environmental awareness and extensive retail infrastructure. The EU’s Single-Use Plastics Directive (SUPD) provides a comprehensive framework for reducing single-use plastics, targeting a 77% bottle collection rate by 2025 and 90% by 2029, alongside mandatory recycled-content requirements of 25% for PET bottles by 2025 and 30% by 2030.
Member states must also demonstrate sustained reductions in single-use plastic consumption by 2026, accelerating uptake of reusable alternatives. The UK’s Resources and Waste Strategy and Plastic Packaging Tax further reinforce sustainability-driven purchasing, while brands such as Chilly’s Bottles exemplify Europe’s strong premium reusable bottle landscape.
Asia Pacific Reusable Water Bottles Trends
Asia Pacific is the leading regional market for reusable water bottles, accounting for the largest share of global revenue of 40% and driven primarily by China, India, Japan, and the broader ASEAN manufacturing and consumption corridor. This dominance is supported by the region’s vast consumer base, rapid urbanization, expanding middle class, rising health and environmental awareness, and strong manufacturing capabilities in stainless steel fabrication, polymer processing, and insulated container production.
China remains the world’s largest producer of reusable bottles, supported by an extensive tier-1 and tier-2 supplier ecosystem that enables highly cost-competitive exports across all price segments. India is emerging as a high-growth market, accelerated by state-level restrictions on single-use plastics, including Odisha’s 2024 plastic bottle ban. Japan and South Korea maintain mature, technologically advanced markets, with manufacturers leveraging precision insulation engineering and minimalist design to secure premium positioning domestically and globally.
Competitive Landscape
The global reusable water bottles market is defined by a fragmented competitive landscape, featuring established international brands, regional manufacturers, and fast-growing direct-to-consumer startups competing across materials, price tiers, and performance features. Leading companies such as CamelBak, Klean Kanteen, SIGG Switzerland, Thermos, and Chilly’s Bottles differentiate through advanced vacuum-insulation technology, sustainability certifications like B Corporation status, strong lifestyle branding, and e-commerce-focused distribution. Key competitive themes include social media-driven brand building, influencer marketing, customization options, and the integration of smart hydration features. Emerging business models, such as corporate co-branding programs, subscription-based accessory services, and partnerships with urban public refill-station networks, are further shaping market dynamics and supporting long-term sustainability goals.
Key Market Developments
- April 2024: New York-based Nalgene announced that it has transitioned its reusable bottle manufacturing to Eastman's Tritan Renew. It is a certified material composed of 50% recycled content via the mass balancing methodology.
- August 2025: S’well announced the launch of a new bottle line manufactured using 50% recycled materials. This initiative highlights the company’s strategic commitment to sustainability and the reduction of single-use plastics. By integrating recycled inputs into its production process, S’well aims to lower its environmental footprint while maintaining the premium quality, durability, and aesthetic appeal expected by its customer base.
- May 2025: Hydro Flask expanded its Micro Hydro Mini Bottle portfolio with the introduction of five new color variants. The 6.7-ounce insulated bottle, designed for single-serve portability, previously experienced strong market demand, selling out within 24 hours of its initial release. The newly introduced colors, Surf, Agave, Trillium, Reef, and Aloe, are intended to address diverse consumer preferences and strengthen the brand’s presence in the portable hydration segment.
Top Companies in Reusable Water Bottles
- CamelBak (Petaluma, U.S.) is one of the most globally recognized hydration brands, with a portfolio spanning insulated stainless steel water bottles, hydration reservoirs, and performance drinkware designed for outdoor, military, and everyday consumer applications. Its decades-long heritage in military-grade hydration innovation, broad retail and OEM distribution reach, and continued investment in leak-proof engineering, ergonomic design, and sustainable materials maintain strong consumer loyalty across both performance and lifestyle segments of the Reusable Water Bottles Market.
- Klean Kanteen Inc. (Chico, U.S.) is a certified B Corporation and one of the most sustainability-credentialed brands in the global reusable water bottle category. Its TKWide, Classic, and Rise collections, manufactured from 90% post-consumer recycled 18/8 stainless steel, appeal strongly to environmentally conscious consumers, outdoor enthusiasts, and urban health-conscious demographics. Active participation in the Drinkware CoLab and a consistent commitment to plastic-free hydration solutions reinforce Klean Kanteen's positioning as a category-leading sustainability innovator.
- Thermos LLC (Rolling Meadows, U.S.) commands one of the most globally recognized brand legacies in reusable insulated drinkware, with over a century of heritage in vacuum-insulated beverage containment. Its temperature retention technology, synonymous globally with the "thermos" product category, and extensive distribution through mass-market retail, specialty outdoor, and foodservice channels deliver a durable volume-based competitive advantage. Thermos's broad portfolio spanning stainless steel, plastic, and glass formats ensures consistent reach across diverse consumer demographics, income segments, and geographic markets.
Companies Covered in Reusable Water Bottles Market
- Camelbak Products LLC.
- SIGG Switzerland AG
- Klean Kanteen Inc.
- Tupperware Brands Corporation
- Newell Brands
- Hydaway
- Thermos LLC
- Stanley Black & Decker, Inc.
- Nalgene
- Chilly’s Bottles
- Hydro Flask
- Contigo
Frequently Asked Questions
The global Reusable Water Bottles Market is valued at US$ 11.2 Bn in 2026 and is projected to reach US$ 16.04 Bn by 2033, growing at a CAGR of 5.2%. Historically, the market expanded at a CAGR of 4.5% between 2020 and 2025, supported by single-use plastic bans, microplastic health concerns, and growing sustainability-driven consumer purchasing behavior across all major geographies.
The foremost demand drivers are government-mandated single-use plastic bans, most notably the EU's Single-Use Plastics Directive targeting a 90% plastic bottle collection rate by 2029, and the documented health risk of microplastic ingestion from commercial bottled water, confirmed by a 2024 PNAS study endorsed by the NIH, finding 240,000 plastic fragments per liter of bottled water, collectively accelerating consumer adoption of reusable hydration solutions.
Plastic holds the leading position in the Reusable Water Bottles Market by material type, with approximately 36% of total market share in 2026, driven by its affordable retail pricing, lightweight properties, and broad accessibility across mass-market channels in price-sensitive regions.
Asia Pacific leads the global Reusable Water Bottles Market, underpinned by China's world-leading manufacturing capacity for reusable bottles, India's fast-growing domestic market, and progressive government-mandated single-use plastic restrictions across multiple national markets, including India, Thailand, and Indonesia.
The highest-potential near-term opportunity is the integration of smart hydration technology, including IoT sensors, hydration tracking, and health app connectivity, into premium reusable bottle designs, combined with the growing institutional B2B procurement channel, where organizations aligned with UN SDG 12 and major events like the Paris 2024 Olympics are committing to reusable hydration solutions at scale, creating durable recurring demand for sustainability-credentialed brands.
Top firms include Camelbak Products LLC., Klean Kanteen Inc., and Thermos LLC, leading via innovation and distribution.


