


- Technology
- Powered Smart Card Market
Powered Smart Card Market Size, Share, and Growth Forecast 2026 - 2033
Powered Smart Card Market by Card Type (Contact Powered Smart Cards, Contactless Powered Smart Cards, Dual-Interface Powered Smart Cards), by Application (Financial Services (BFSI), Government Agencies, Healthcare, Transportation, Retail Sector, Others), by Regional Analysis, 2026-2033
Powered Smart Card Market Size and Trend Analysis
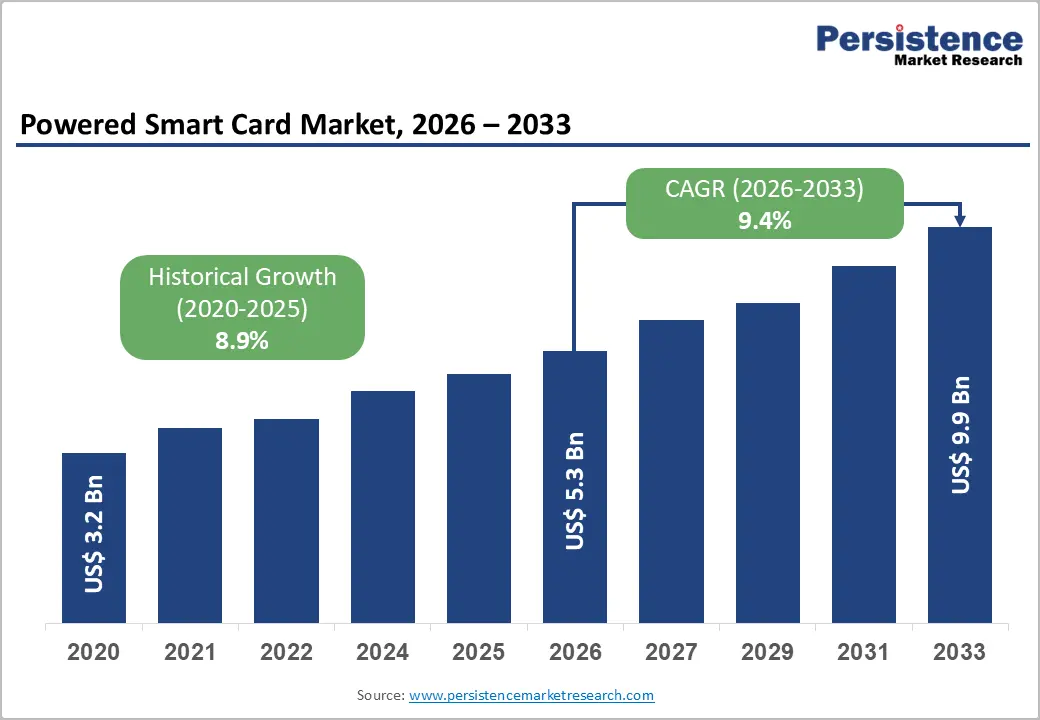
The global Powered Smart Card Market size is expected to be valued at US$ 5.3 billion in 2026 and projected to reach US$ 9.9 billion by 2033, growing at a CAGR of 9.4% between 2026 and 2033. The market is witnessing robust growth driven by rapid digital transformation across government bodies, financial institutions, and enterprises requiring secure authentication solutions. Increasing adoption of contactless payment systems and the expansion of government-led digital identity initiatives are reinforcing demand. Growing consumer preference for touch-free transactions, coupled with rising cybersecurity threats and stricter regulatory compliance requirements, is further accelerating adoption across BFSI, healthcare, and transportation sectors worldwide.
Key Market Highlights
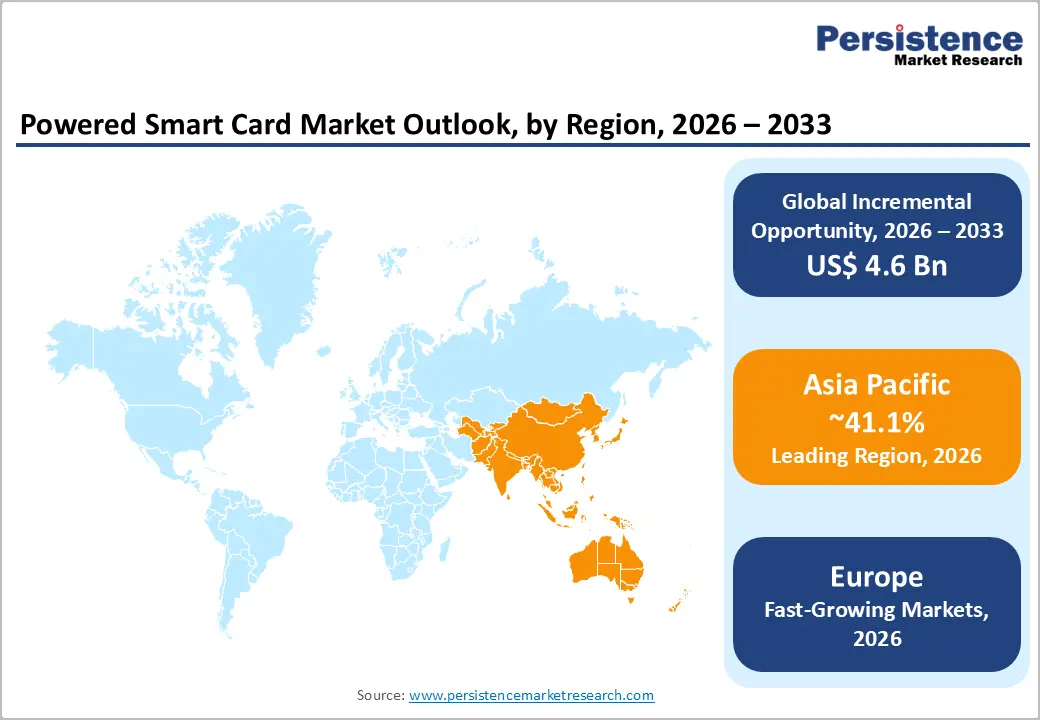
- Leading Region: Asia Pacific dominates the powered smart card market with ~41.1% global share, led by China, Japan, and India.
- Fastest Growing Region: India is the fastest-growing market in Asia Pacific, expanding at 12.2% CAGR, driven by Digital India, Aadhaar biometric deployment, and mobile payment adoption across 1.4 billion citizens.
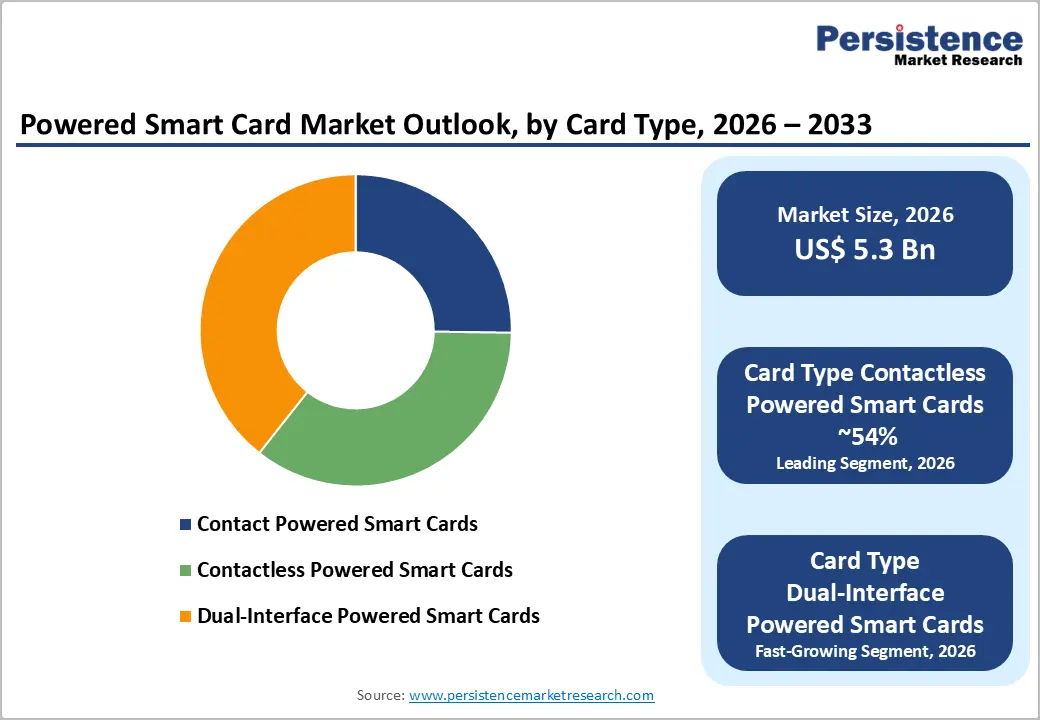
- Dominant Card Type Segment: Contactless-powered smart cards lead with ~54% market share in 2024, supported by NFC adoption, touch-free transaction preference, and regulatory mandates.
- Fastest Growing Application Segment: Dual-interface powered smart cards are the fastest-growing category, providing both contact and contactless functionality for flexible usage.
- Key Market Opportunity: Healthcare sector digital transformation represents the highest-potential growth opportunity, driven by electronic health record mandates.
| Key Insights | Details |
|---|---|
| Powered Smart Card Market Size (2026E) | US$ 5.3 billion |
| Market Value Forecast (2033F) | US$ 9.9 billion |
| Projected Growth CAGR(2026-2033) | 9.4% |
| Historical Market Growth (2020-2025) | 8.9% |
Market Dynamics
Market Growth Drivers
Digital Transformation in Government Identity Systems
Government agencies across developed and emerging economies are accelerating the digitalization of citizen identity, access control, and public service delivery frameworks. Powered smart cards are increasingly deployed as secure infrastructure for national ID programs, electronic passports, and government-issued credentials that require high levels of trust, durability, and data protection across large populations.
These initiatives demand advanced security capabilities such as on-card encryption, biometric data storage, cryptographic processing, and tamper-resistant design. Powered smart cards uniquely meet these requirements by enabling secure, autonomous processing without constant reliance on external systems, supporting long-term credential lifecycle management and sustained demand through multi-year public sector deployments.
Rising Adoption of Contactless Payment Systems and Biometric Authentication
The global shift toward contactless payment systems is accelerating as consumers and institutions prioritize faster, safer, and touch-free transaction experiences. Banks, transit authorities, and retailers are increasingly integrating NFC-enabled payment infrastructure to improve transaction efficiency while meeting evolving security expectations.
Powered smart cards enable secure on-card biometric authentication and cryptographic validation, allowing instant identity verification without dependence on external servers. This capability enhances fraud prevention, improves transaction speed, and supports regulatory requirements for strong customer authentication, driving adoption across BFSI, transportation, healthcare, and enterprise security applications.
Market Restraints
Competition from Digital Wallets and Mobile Payment Solutions
Mobile payment platforms, digital wallets, and contactless smartphone technologies are increasingly competing with powered smart cards, particularly among younger, tech-savvy consumer segments. Solutions such as Apple Pay, Google Pay, and Samsung Pay provide seamless, frictionless payment experiences without the need for physical card infrastructure. High smartphone penetration in developed markets encourages consumers to prefer digital wallets over hardware-based cards, creating pressure on financial institutions to balance investments between traditional smart card deployments and software-based payment solutions.
Emerging technologies like eSIMs and blockchain-based digital assets further reduce reliance on physical smart cards by offering alternative authentication and transaction mechanisms. These trends pose competitive challenges, limiting adoption in markets where mobile and decentralized solutions are more convenient, flexible, and increasingly trusted by consumers and enterprises.
High Implementation and Infrastructure Costs
Deploying powered smart card systems requires substantial upfront investment, creating barriers for adoption, especially in emerging markets with limited budgets. Establishing secure manufacturing and personalization facilities demands specialized equipment, security certifications, and skilled personnel. National identity programs and large-scale payment deployments often entail multi-million-dollar investments for card production, reader hardware, backend authentication systems, and ongoing maintenance.
Small and medium-sized enterprises frequently lack the financial capacity to implement powered smart card infrastructure independently. In sectors like retail and healthcare, where lower-cost legacy alternatives prevail, the cost-benefit balance can be unfavorable. High capital requirements constrain market growth in regions with fragmented ecosystems, lower transaction volumes, or limited digital infrastructure.
Market Opportunities
Rapid Growth in Smart City and IoT-Enabled Transportation Ticketing
Smart city initiatives and urban mobility digitalization are creating significant opportunities for powered smart card adoption, with transportation ticketing emerging as a key growth segment. Cities worldwide are implementing multimodal transit systems that require secure, interoperable payment solutions, driving demand for NFC-enabled powered smart cards. These cards enable high-speed, reliable transactions, allowing passengers to access buses, trains, metro systems, and bike-sharing programs with single credentials.
Projects like New York’s OMNY system demonstrate strong consumer adoption, while emerging deployments across China, India, Brazil, and Southeast Asia further accelerate demand. Powered smart cards provide the transaction processing capacity, security, and interoperability needed for peak-hour usage and large-scale urban mobility applications, positioning them as essential infrastructure for smart city transportation systems.
Healthcare Sector Digital Transformation and Telemedicine Expansion
The ongoing digital transformation of healthcare systems is expanding opportunities for powered smart cards to secure patient data, insurance credentials, and staff access. Electronic health record initiatives and telemedicine platforms require strong authentication to protect sensitive medical information while enabling rapid data exchange across hospitals, clinics, and insurance providers.
Powered smart cards with biometric authentication enforce strict access control, prevent unauthorized access, and consolidate multiple functions such as employee identification, drug administration verification, and patient information management. By supporting regulatory compliance and improving operational efficiency, these cards are becoming critical tools for hospitals and healthcare networks, enabling secure, multi-factor authentication and streamlined access to critical clinical and administrative systems.
Category-wise Insights
Card Type Analysis
The contactless-powered smart card segment leads the market, capturing approximately 54% market share in 2024. These cards use NFC technology at 13.56 MHz and comply with ISO 14443 and EMVCo 3.0 standards, enabling secure tap-and-pay transactions. Consumer preference for touch-free payments, widespread merchant adoption of contactless terminals, and regulatory mandates in major markets reinforce their dominance. Infrastructure availability across retail, transport, and service sectors further accelerates adoption.
Dual-interface powered smart cards are the fastest-growing category, offering both contact and contactless transaction functionality. They allow seamless operation with legacy contact-based readers while supporting modern NFC-enabled terminals. This dual capability provides maximum flexibility for organizations transitioning to contactless ecosystems, enabling interoperability across different transaction environments and enhancing user convenience, operational efficiency, and adoption in multi-application scenarios.
Application Analysis
The BFSI sector dominates powered smart card applications, holding around 34.2% market share in 2025. Powered cards are critical for payment security, fraud prevention, and regulatory compliance, supporting EMV chip-enabled transactions. Financial institutions deploy advanced features like biometric authentication, tokenization, and encryption that rely on the processing power of powered cards. Continuous upgrades are driven by fintech innovation and competitive pressures, while healthcare applications within BFSI are expanding for secure patient identification and record access.
Transportation and retail represent the fastest-growing application segments. Powered smart cards enable NFC-based transit ticketing, allowing passengers to access multiple modes of transport with a single credential. Retailers integrate contactless capabilities into loyalty programs, improving customer engagement and operational efficiency. Cards provide secure, high-speed transaction processing, supporting peak-hour transit volumes and multi-location retail operations, making them essential in modern urban mobility and consumer engagement ecosystems.
Regional Insights
North America Powered Smart Card Market Trends and Insights
North America is the second-largest regional market for powered smart cards, driven by strong financial services infrastructure, advanced cybersecurity standards, and growing adoption of contactless payments. The United States and Canada are leading deployments, with banks issuing biometric-enabled credit and debit cards to enhance security and customer convenience. Financial institutions and fintech companies are increasingly upgrading card portfolios with multi-factor authentication and tokenization technologies.
Government initiatives such as mobile driver’s licenses (mDL) and TSA-supported digital ID programs are supporting adoption across public services. Healthcare systems are deploying smart cards for patient identification, prescription verification, and electronic health record access. The North American powered smart card market is projected to grow at a CAGR of 7.8%, supported by ongoing digital transformation, regulatory mandates, and expansion of secure contactless infrastructure.
Europe Powered Smart Card Market Trends and Insights
Europe represents approximately 35.1% of the global powered smart card market, establishing the region as a mature and sophisticated segment with significant government-led adoption. Germany leads with 25.6% of European market share, driven by its biometric national ID program, while France’s secure national ID card deployment showcases advanced facial recognition and encryption capabilities. EU regulations such as GDPR and eIDAS ensure interoperability and data protection, promoting powered smart card adoption across public and private sectors.
Contact-based powered smart cards currently dominate due to legacy infrastructure, but contactless adoption is rapidly increasing as merchants upgrade POS terminals and consumers embrace touch-free transactions. European manufacturers are focusing on sustainable and eco-friendly card production, while NFC-enabled banking, healthcare, and transportation applications continue to expand. The region benefits from robust infrastructure, regulatory support, and growing digital identity initiatives.
Asia Pacific Powered Smart Card Market Trends and Insights
Asia Pacific dominates the global powered smart card market with approximately 41.1% market share, representing the fastest-growing regional segment. China, Japan, and India collectively account for the majority of market value, with China producing over 11 billion smart card units annually and exporting 22 billion units worldwide. Rapid smart city initiatives in Shanghai, Beijing, Shenzhen, and Chongqing are driving demand for NFC-enabled transportation and access control cards.
India is the fastest-growing country in the region, fueled by the Digital India initiative, Aadhaar biometric identification, and widespread mobile payment adoption. Dual-interface cards are particularly popular, reaching 88% adoption for maximum transaction flexibility. Emerging markets such as Vietnam and Bangladesh are also witnessing rapid growth due to urbanization, government digitalization programs, and expanding telecommunications infrastructure, creating substantial opportunities for powered smart card deployment.
Competitive Landscape
The powered smart card market is moderately consolidated, led by specialized technology providers with broad portfolios across payment, government identity, telecommunications, and transportation applications. Semiconductor companies dominate chipsets, security controllers, and embedded processing elements, particularly for contactless and dual-interface cards. Market leaders differentiate through biometric integration, advanced encryption, sustainability initiatives, and cloud-based issuance platforms, combining hardware expertise with digital services to enhance security and operational efficiency.
Emerging regional manufacturers are rapidly gaining share through cost-competitive production, government-backed supply chains, and tailored solutions for telecommunications and public sector applications. The market is shifting from hardware-centric models to platform-based services, including cloud card issuance, digital wallet management, and fraud prevention, with eco-friendly manufacturing practices becoming a key differentiator.
Key Market Developments
- In December 2025, CPI Card Group Inc. secured major investor commitments from the Tricor Family Office and Chairman H. Sanford Riley, and integrated its Card@Once instant issuance solution with the Nymbus core banking platform, enabling in-branch debit card printing and activation within minutes.
- In February 2025, IDEMIA Secure Transactions achieved NFC Forum certification for automotive NFC key cards and collaborated with Vantiva to deploy 5G-powered eSIM technology, strengthening its leadership in next-generation connectivity, secure digital identity, and automotive credential solutions.
- In July 2025, QIIB (Qatar International Islamic Bank) and Visa launched biometric Click to Pay services in Qatar, while Eastern Bank PLC, Mastercard, and IDEX Biometrics deployed the world’s first commercial biometric metal credit card in Bangladesh with integrated fingerprint sensors and EMV security.
Companies Covered in Powered Smart Card Market
- Thales Group
- IDEMIA
- Giesecke+Devrient
- CPI Card Group
- HID Global
- NXP Semiconductors
- Infineon Technologies
- Watchdata Technologies
- Eastcompeace Technology
- Beautiful Card Corporation
- Perfect Plastic Printing
- SmartDisplayer Technology
- Wuhan Tianyu Information Industry
- Datang Telecom Technology
- Hengbao Co. Ltd.
Frequently Asked Questions
The global powered smart card market size is expected to be valued at US$ 5.3 billion in 2026 and is projected to reach US$ 9.9 billion by 2033, growing at a CAGR of 9.4% between 2026 and 2033.
Adoption is driven by government digital transformation across 190+ countries, contactless payments, biometric authentication mandates, and healthcare digitalization requiring secure patient identification and access control.
Asia Pacific dominates with ~41.1% global share, led by China, Japan, and India, fueled by smart city initiatives and low-cost manufacturing.
Transportation and smart ticketing are fastest-growing, supported by NFC-enabled fare systems and rapid adoption of contactless urban mobility solutions.
Healthcare digital transformation, GDPR-compliant patient records, biometric authentication, and smart city expansion in Asia Pacific, Latin America, and Africa offer high-growth potential.
Major global manufacturers include Thales Group, IDEMIA, Infineon Technologies, NXP Semiconductors, Giesecke+Devrient, and CPI Card Group.


