Non-Alcoholic Beverages Market Size, Share, and Growth Forecast 2026 - 2033

Non-Alcoholic Beverages Market by Product Type (Carbonated Soft Drinks, Juices & Nectars, Bottled Water, Energy & Sports Drinks, Dairy-based Beverages, Plant-based Beverages, RTD Tea and Coffee, Others), Packaging Type, Distribution Channel, and Regional Analysis, 2026 - 2033

ID: PMRREP18559
Calendar

March 2026

210 Pages

Author : Amol Patil

Non-Alcoholic Beverages Market Size and Trend Analysis

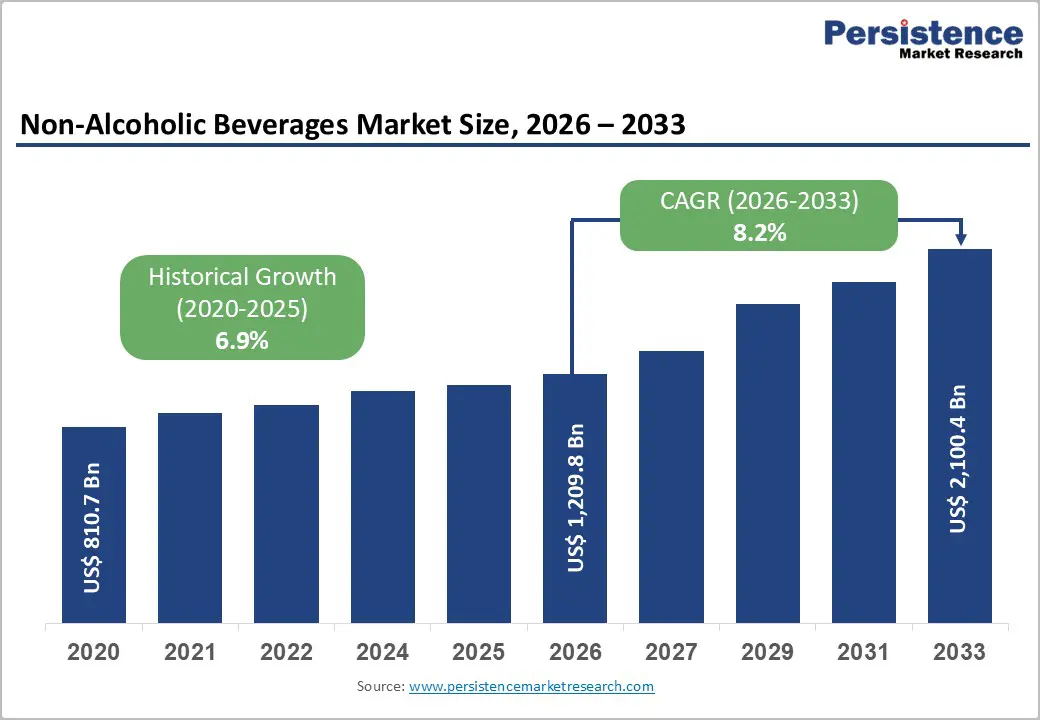
The global non-alcoholic beverages market size is expected to be valued at US$ 1,209.8 billion in 2026 and projected to reach US$ 2,100.4 billion by 2033, growing at a CAGR of 8.2% between 2026 and 2033.

The global market includes a wide range of drinks such as carbonated soft drinks, bottled water, juices, energy and sports drinks, dairy-based beverages, plant-based alternatives, and ready-to-drink tea and coffee. This market is driven by rising consumer demand for convenience, hydration, and healthier beverage options. Increasing urbanization, changing lifestyles, and growing disposable incomes are further supporting market expansion. Innovation in flavors, functional ingredients, and low- or zero-sugar formulations is reshaping product offerings. Additionally, expanding distribution channels, including supermarkets and online platforms, are enhancing product accessibility, making the market highly competitive and rapidly evolving globally.

Key Highlights:

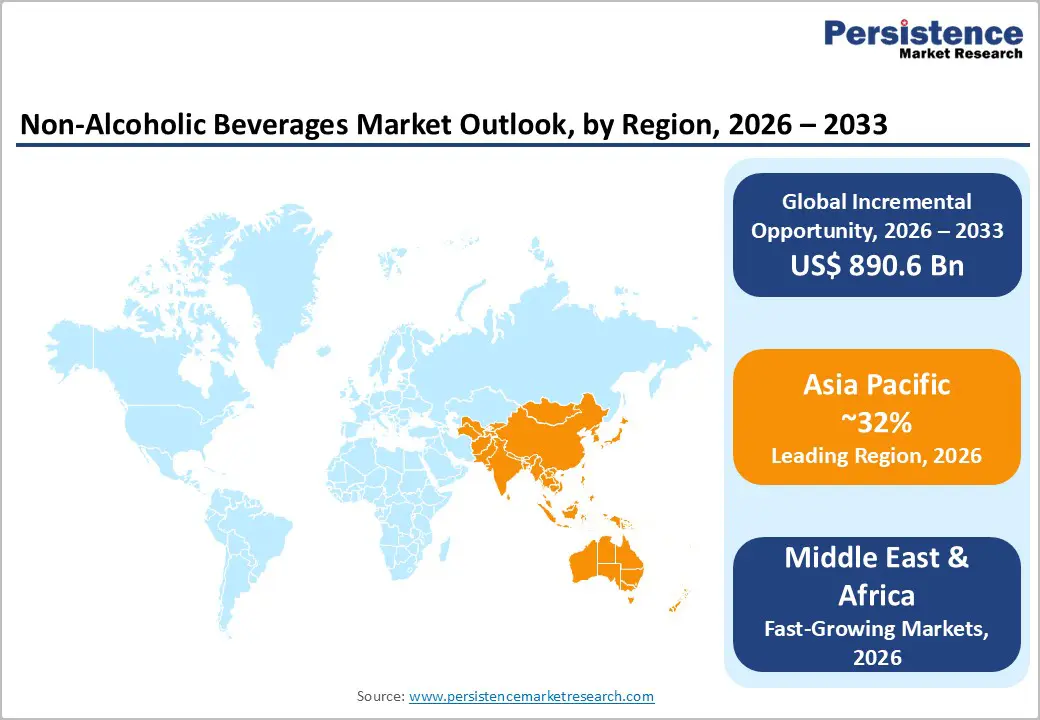
  • Leading Region: Asia Pacific dominates the non-alcoholic beverages market due to large population, rising incomes, and strong bottled water and soft drink consumption growth.
  • Fastest-growing Region: Middle East & Africa is rapidly expanding, driven by urbanization, young population, rising incomes, and high bottled water consumption dominating beverage preferences.
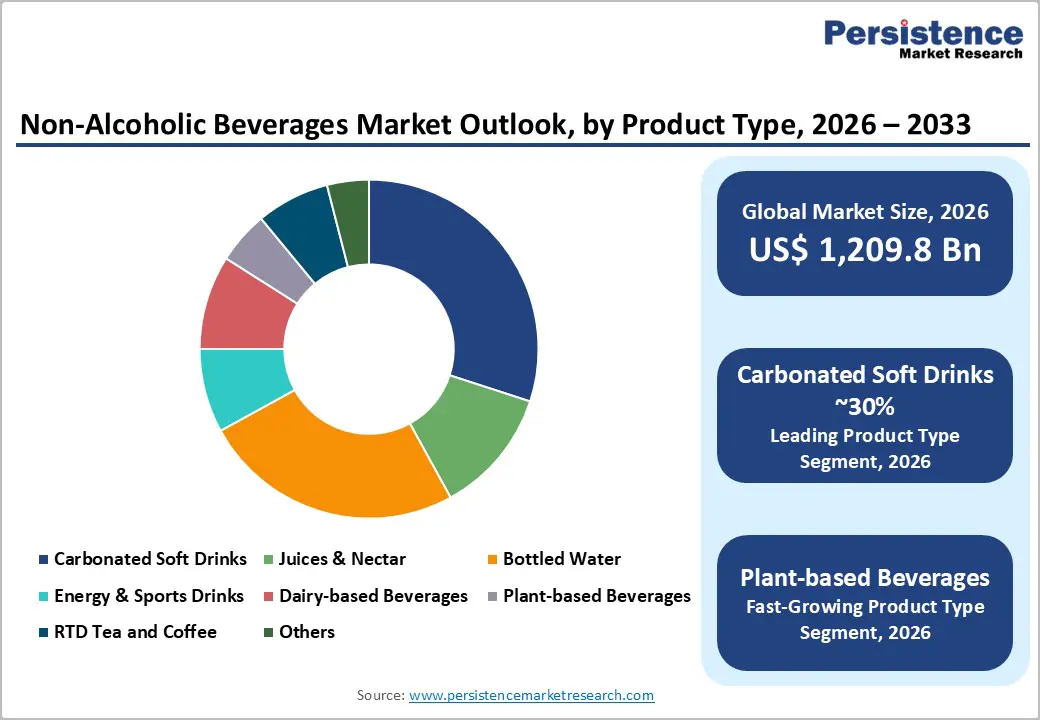
  • Dominant Product: Carbonated soft drinks lead with around 30% share, supported by strong global brands, extensive distribution networks, and continuous innovation in flavors and zero-sugar variants.
  • Fastest-growing Product: Plant-based beverages and functional RTD drinks grow fastest, driven by health awareness, dairy alternatives demand, and increasing preference for convenient ready-to-drink formats.
  • Key Opportunity: Digital and omni-channel distribution, including e-grocery, subscriptions, and quick commerce, is unlocking new revenue streams with strong double-digit growth in online beverage sales.
Key Insights Details
Global Non-Alcoholic Beverages Market Size (2026E) US$ 1,209.8 billion
Market Value Forecast (2033F) US$ 2,100.4 billion
Projected Growth CAGR (2026 - 2033) 8.2%
Historical Market Growth (2020 - 2025) 6.9%

non-alcoholic-beverages-market-size-2026-2033

Market Dynamics

Drivers - Health and wellness shift away from sugary drinks

A major driver for non-alcoholic beverages is the global pivot toward health and wellness, with consumers actively reducing sugar intake and prioritizing hydration and functional benefits. World Health Organization (WHO) data show that more than 116 countries apply excise taxes on sugar-sweetened beverages (SSBs), signalling growing regulatory pressure on high-sugar soft drinks and encouraging reformulation and portfolio shifts toward low- and no-sugar alternatives. Empirical research has linked higher soft drink consumption with significantly increased prevalence of overweight and obesity, reinforcing public and clinical guidance to curb regular soda intake. In response, brands are rapidly expanding portfolios of zero-sugar colas, flavored waters, and lightly sweetened RTD teas and coffees, while bottled water and functional beverages gain share as everyday hydration and wellness choices.

The Growing Popularity of Sober-Curious Lifestyles is Positively Influencing the Demand for Non-Alcoholic Beverages

The rise of sober-curious lifestyles is significantly increasing the global demand for non-alcoholic beverages. More consumers are choosing to cut back on alcohol for health and personal reasons, leading to a shift in the beverage market. Events like Sober October and Dry July inspire alcohol-free living, raising awareness of non-alcoholic options. Campaigns such as the Irish Heart Foundation's "On the Dry" in January further encourage sobriety, transforming consumer habits. As these movements gain momentum, brands have exciting opportunities to develop innovative non-alcoholic drinks that cater to this growing market. This shift drives a wave of creativity, offering health-conscious alternatives that align with the sober-curious lifestyle.

Restraints - Sugar Content Limitations Affect the Taste Profile of Non-Alcoholic Beverages

Sugar content limitations pose a significant challenge for the non-alcoholic beverages market. As consumers grow more health-conscious and seek lower-sugar options, manufacturers face pressure to reduce sugar levels. While this shift promotes better health, it often compromises taste, making it difficult to deliver the flavor and sweetness consumers expect from traditional drinks.

To compensate, many brands turn to artificial sweeteners or natural alternatives like stevia, but these often fail to recreate the authentic experience. Striking a balance between flavor and compliance with sugar regulations is crucial. As regulatory pressures around sugar content intensify, the market faces the challenge of delivering satisfying, flavorful beverages without compromising on health-conscious ingredients, which could limit consumer appeal.

Opportunities - Companies Tap into the Growing Preference for Dairy-Free, Vegan-Friendly Nutritional Beverages

Companies in the non-alcoholic beverages market have a prime opportunity to capitalize on the growing demand for dairy-free and vegan-friendly drinks. As health-conscious consumers, particularly younger generations, increasingly seek plant-based alternatives, businesses can attract a diverse audience, including those with lactose intolerance and committed vegans.

A prime example is Zevia®, which offers beverages that are naturally sweetened with plant-based ingredients, free from artificial colors, flavors, and sweeteners. These drinks are also non-GMO verified, making them a perfect example of how companies can leverage clean, plant-based ingredients to meet growing consumer demands in the non-alcoholic beverage sector.

Category-wise Analysis

Product Type Insights

Within product types, carbonated soft drinks (CSDs) remain the leading revenue-generating segment of the non-alcoholic beverages market, accounting for an estimated 30% share in 2026. Despite long-term per-capita declines in some mature markets, CSDs still command substantial household penetration and brand equity, with global soft drinks retail volume continuing to grow around 3% annually and carbonated soft drinks retaining a dominant position in many portfolios. Brand valuation analyses confirm that iconic CSD brands such as Coca-Cola, Pepsi, Dr. Pepper, and Sprite occupy most of the top global non-alcoholic drink brand rankings, reflecting their scale, marketing power, and distribution reach. At the same time, reformulation toward zero-sugar and reduced-sugar lines, limited-edition flavors, and cross-category innovations (for example, colas blended with coffee or functional ingredients) are helping CSDs maintain relevance even as consumer preferences shift toward healthier and more functional options.

Distribution Channel Insights

Across distribution channels, hypermarkets and supermarkets constitute the largest organized retail Hypermarkets and supermarkets remain the dominant organized retail channel for non-alcoholic beverages, driven by strong demand for multi-pack carbonated drinks, bottled water, juices, and family-sized formats. These large-format stores account for approximately 40-50% of total soft drink sales. Their leadership is supported by one-stop shopping convenience, promotional pricing, and a wide assortment of brands. This channel is particularly influential in developed markets such as North America and Europe, where it anchors off-trade sales and in-store marketing strategies. Convenience stores and forecourt outlets also play a vital role, especially for single-serve and on-the-go consumption, with notable growth in impulse purchases.

Online retail is emerging as the fastest-growing distribution channel, fueled by the expansion of e-grocery and direct-to-consumer models. Rapid digital adoption, strong growth in home delivery, and rising demand for functional and premium beverages are accelerating this shift. Online platforms are especially important for innovative brands and ready-to-drink beverages.

non-alcoholic-beverages-market-outlook-by-product-type-2026-2033

Regional Insights

North America Non-Alcoholic Beverages Market Trends and Insights

In North America, particularly the U.S., non-alcoholic beverages are undergoing a pronounced shift from traditional sugary sodas toward low- and zero-sugar soft drinks, bottled and flavored waters, energy drinks, and functional RTD beverages. Per-capita soft drink consumption in the U.S. has been on a gradual long-term decline, with estimates showing per-capita soft drink consumption of around 41.9 gallons in 2025 and an annualized contraction of about 0.4% between 2020 and 2025, reflecting heightened awareness of obesity and diabetes risks linked to high sugar intake. At the same time, demand for premium energy drinks, performance hydration products, and RTD coffees and teas is robust, with functional and wellness-positioned beverages capturing a growing share of shelf space and marketing budgets.

The region is also a hotbed of innovation and regulatory experimentation. U.S. federal authorities and leading medical organizations continue to spotlight excess sugar consumption, while several states and municipalities have explored or implemented soda taxes and marketing restrictions, reinforcing industry-wide reformulation and portion-control strategies. Major players such as The Coca-Cola Company and PepsiCo, Inc. are investing heavily in zero-sugar colas, enhanced waters, sports and energy drinks, and protein or prebiotic beverages, alongside portfolio extensions into hybrid formats such as colas with coffee and functional RTD coffees. Strong e-commerce penetration and sophisticated retail media networks further support innovation and premiumization in the North American non-alcoholic beverages landscape.

Asia Pacific Non-Alcoholic Beverages Market Trends and Insights

Asia Pacific is the largest and one of the most dynamic regions for non-alcoholic beverages, underpinned by rapid urbanization, rising middle-class incomes, and diverse local beverage traditions. Regional statistics show that soft drinks especially non-carbonated soft drinks and bottled water are the largest non-alcoholic categories, with bottled water alone accounting for roughly half of the non-alcoholic beverage market in China, driven by concerns over tap water quality. In India, non-alcoholic beverages spanning bottled water, RTD teas, fruit juices, energy drinks, and plant-based beverages are experiencing robust demand as urban consumers, particularly millennials and Gen Z, seek convenient, functional, and natural ingredient-based products; the Indian non-alcoholic beverages market expanded steadily in recent years on the back of rising health awareness and modern retail and e-commerce penetration.

The region also offers significant manufacturing and innovation advantages. Many global beverage companies have established large-scale bottling, co-packing, and ingredient sourcing operations in Asia Pacific to serve both domestic and export markets efficiently. Governments in several countries are combining sugar-reduction strategies with industrial policy, encouraging reformulation, local fruit and dairy value chains, and investments in sustainable packaging. Simultaneously, the expansion of modern retail, convenience stores, and fast-growing online grocery platforms across China, Japan, India, and ASEAN countries is widening access to premium bottled waters, functional drinks, and RTD coffees and teas. These dynamics, combined with a young, digitally engaged consumer base, underpin Asia Pacific’s leadership in global non-alcoholic beverages growth.

non-alcoholic-beverages-market-outlook-by-region-2026-2033

Competitive Landscape

The global non-alcoholic beverages market is highly competitive, featuring several global giants alongside an increasing number of regional brands and startups. This dynamic environment is being driven by growing foreign direct investment (FDI), strategic distribution partnerships, and increased investments in sustainability initiatives. Companies are actively innovating in eco-friendly packaging and developing cleaner, healthier formulations in response to consumer demand. Additionally, government regulations particularly those targeting sugar reduction are shaping product reformulation strategies. These evolving factors, combined with rapid innovation and shifting consumer preferences, are redefining the market's direction.

Key Developments:

  • In March 2026, George Clooney, along with nightlife entrepreneur Rande Gerber and Mike Meldman, introduced Crazy Mountain, a new non-alcoholic beverage line featuring a lager and a lime-flavored beer. The products are set to roll out in select markets this week and are already available through the brand’s official website.
  • In November 2025, India-based beverage company Varun Beverages Limited (VBL), a key bottling partner of PepsiCo, was reported by ET Retail to be in advanced talks with its long-standing collaborator to enter the alcoholic beverages segment in India.
  • In April 2025, Nestlé announced the expansion of its Nescafé Ready-to-Drink cold coffee range to India, the Middle East and North Africa (MENA) region, and Brazil. This move aims to cater to the rising demand from young consumers seeking convenient, flavorful, and on-the-go beverage options that match their fast-paced, modern lifestyles.
  • In March 2025, PepsiCo, Inc. announced a definitive agreement to acquire Poppi, a rapidly growing prebiotic soda brand, for $1.95 billion. This strategic move underscores PepsiCo’s commitment to expanding its functional beverage portfolio and strengthening its position in the gut-health and better-for-you drinks segment.
  • In March 2025, Red Bull unveiled its first-ever U.S. Spring Edition energy drink, introducing a refreshing Grapefruit & Blossom flavor. This limited-time offering is available in both sugar and sugar-free variants, reflecting the brand’s effort to cater to evolving consumer preferences for seasonal and flavorful energy drink options.
  • In February 2025, Coca-Cola expanded its functional beverage portfolio by launching a new prebiotic soda brand, Simply Pop. The move marks the company's strategic entry into the rapidly growing prebiotic soda category, directly challenging established players.

Companies Covered in Non-Alcoholic Beverages Market

  • The Coca-Cola Company
  • PepsiCo, Inc.
  • Keurig Dr Pepper Inc.
  • Del Monte Pacific Limited
  • Nestlé S.A.
  • Danone S.A.
  • Monster Beverage Corporation
  • Red Bull GmbH
  • SunOpta Inc.
  • Starbucks Corp.
  • Asahi Group Holdings
  • Suntory Holdings Limited
  • Almarai
  • Nongfu Spring
  • Parle Agro
  • Hector Beverages Private Limited
  • Bisleri International Pvt. Ltd.
  • AMUL
  • Reliance Industries
  • Refresco
  • Others
Frequently Asked Questions

The global non-alcoholic beverages market is expected to reach around US$ 1,209.8 billion in 2026.

The growing popularity of sober curious lifestyles is positively influencing the demand for non-alcoholic beverages.

Asia Pacific leads the global non-alcoholic beverages market, benefiting from its large population, rapid urbanization, high bottled water and soft drink consumption, and growing middle class in countries such as China, India, and Southeast Asian economies.

Companies can tap into the growing preference for dairy-free, vegan-friendly nutritional beverages, is the key market opportunity for companies in the Global Non-Alcoholic Beverages market.

Key players in the Global Non-Alcoholic Beverages industry include The Coca-Cola Company, PepsiCo, Inc., Keurig Dr. Pepper Inc., Nestlé S.A., Danone S.A., Monster Beverage Corporation, and others.

Non-Alcoholic Beverages Market Report Scope
Report Attribute Details
Historical Data/Actuals 2020 - 2025
Forecast Period 2026 - 2033
Market Analysis Units Value: US$ Bn, Volume: As Applicable
Geographical Coverage
  • North America
  • Europe
  • East Asia
  • South Asia & Oceania
  • Latin America
  • Middle East & Africa
Segmental Coverage
  • Product Type
  • Packaging Type
  • Distribution Channel
  • Region
Competitive Analysis
  • The Coca-Cola Company
  • PepsiCo, Inc.
  • Keurig Dr Pepper Inc.
  • Del Monte Pacific Limited
  • Nestlé S.A.
  • Danone S.A.
  • Monster Beverage Corporation
  • Red Bull GmbH
  • SunOpta Inc.
  • Starbucks Corp.
  • Asahi Group Holdings
  • Suntory Holdings Limited
  • Almarai
  • Nongfu Spring
  • Parle Agro
  • Hector Beverages Private Limited
  • Bisleri International Pvt. Ltd.
  • AMUL
  • Reliance Industries
  • Refresco
  • Others
Report Highlights
  • Market Forecast and Trends
  • Competitive Intelligence and Share Analysis
  • Growth Factors and Challenges
  • Strategic Growth Initiatives
  • Pricing Analysis
  • Future Opportunities and Revenue Pockets
  • Market Analysis Tools
Market Segmentation

By Product Type

  • Carbonated Soft Drinks
  • Juices & Nectars
  • Bottled Water
  • Energy & Sports Drinks
  • Dairy-based Beverages
  • Plant-based Beverages
  • RTD Tea and Coffee
  • Others

By Packaging Type

  • Bottles
  • Cans
  • Cartons
  • Pouches

By Distribution Channel

  • B2B
  • B2C
    • Hypermarkets/Supermarkets
    • Specialty Stores
    • Convenience Stores
    • Pharmacies/Drug Stores
    • Online Retail
    • Others

By Region

  • North America
  • Europe
  • East Asia
  • South Asia & Oceania
  • Latin America
  • Middle East & Africa

Related Reports

  1. Executive Summary
    1. Global Non-Alcoholic Beverages Market Snapshot, 2026 and 2033
    2. Market Opportunity Assessment, 2026 - 2033, US$ Bn
    3. Key Market Trends
    4. Future Market Projections
    5. Premium Market Insights
    6. Industry Developments and Key Market Events
    7. PMR Analysis and Recommendations
  2. Market Overview
    1. Market Scope and Definition
    2. Market Dynamics
      1. Drivers
      2. Restraints
      3. Opportunity
      4. Challenges
      5. Key Trends
    3. COVID-19 Impact Analysis
    4. Forecast Factors - Relevance and Impact
  3. Value Added Insights
    1. Value Chain Analysis
    2. Trade Statistics (HS code: 2202, 220290, etc)
    3. Key Market Players
    4. Regulatory Landscape
    5. PESTLE Analysis
    6. Porter’s Five Force Analysis
    7. Consumer Behavior Analysis
  4. Price Trend Analysis, 2020 - 2033
    1. Key Factors Impacting Product Prices
    2. Pricing Analysis, By Product Type
    3. Regional Prices and Product Preferences
  5. Global Non-Alcoholic Beverages Market Outlook
    1. Key Highlights
      1. Market Volume (KL) Projections
      2. Market Size (US$ Bn) and Y-o-Y Growth
      3. Absolute $ Opportunity
    2. Market Size (US$ Bn) Analysis and Forecast
      1. Historical Market Size (US$ Bn) Analysis, 2020-2025
      2. Market Size (US$ Bn) Analysis and Forecast, 2026-2033
    3. Global Non-Alcoholic Beverages Market Outlook: Product Type
      1. Historical Market Size (US$ Bn) and Volume (KL) Analysis, By Product Type, 2020-2025
      2. Market Size (US$ Bn) and Volume (KL) Analysis and Forecast, By Product Type, 2026-2033
        1. Carbonated Soft Drinks
        2. Juices & Nectar
        3. Bottled Water
        4. Energy & Sports Drinks
        5. Dairy-based Beverages
        6. Plant-based Beverages
        7. RTD Tea and Coffee
        8. Others
      3. Market Attractiveness Analysis: Product Type
    4. Global Non-Alcoholic Beverages Market Outlook: Packaging Type
      1. Historical Market Size (US$ Bn) and Volume (KL) Analysis, By Packaging Type, 2020-2025
      2. Market Size (US$ Bn) and Volume (KL) Analysis and Forecast, By Packaging Type, 2026-2033
        1. Bottles
        2. Cans
        3. Cartons
        4. Pouches
      3. Market Attractiveness Analysis: Packaging Type
    5. Global Non-Alcoholic Beverages Market Outlook: Distribution Channel
      1. Historical Market Size (US$ Bn) and Volume (KL) Analysis, By Distribution Channel, 2020-2025
      2. Market Size (US$ Bn) and Volume (KL) Analysis and Forecast, By Distribution Channel, 2026-2033
        1. B2B
        2. B2C
          1. Hypermarkets/Supermarkets
          2. Specialty Stores
          3. Convenience Stores
          4. Pharmacies/drug stores
          5. Online Retail
          6. Others
      3. Market Attractiveness Analysis: Distribution Channel
  6. Global Non-Alcoholic Beverages Market Outlook: Region
    1. Historical Market Size (US$ Bn) and Volume (KL) Analysis, By Region, 2020-2025
    2. Market Size (US$ Bn) and Volume (KL) Analysis and Forecast, By Region, 2026-2033
      1. North America
      2. Latin America
      3. Europe
      4. East Asia
      5. South Asia and Oceania
      6. Middle East & Africa
    3. Market Attractiveness Analysis: Region
  7. North America Non-Alcoholic Beverages Market Outlook
    1. Historical Market Size (US$ Bn) and Volume (KL) Analysis, By Market, 2020-2025
      1. By Country
      2. By Product Type
      3. By Packaging Type
      4. By Distribution Channel
    2. Market Size (US$ Bn) and Volume (KL) Analysis and Forecast, By Country, 2026-2033
      1. U.S.
      2. Canada
    3. Market Size (US$ Bn) and Volume (KL) Analysis and Forecast, By Product Type, 2026-2033
      1. Carbonated Soft Drinks
      2. Juices & Nectar
      3. Bottled Water
      4. Energy & Sports Drinks
      5. Dairy-based Beverages
      6. Plant-based Beverages
      7. RTD Tea and Coffee
      8. Others
    4. Market Size (US$ Bn) and Volume (KL) Analysis and Forecast, By Packaging Type, 2026-2033
      1. Bottles
      2. Cans
      3. Cartons
      4. Pouches
    5. Market Size (US$ Bn) and Volume (KL) Analysis and Forecast, By Distribution Channel, 2026-2033
      1. B2B
      2. B2C
        1. Hypermarkets/Supermarkets
        2. Specialty Stores
        3. Convenience Stores
        4. Pharmacies/drug stores
        5. Online Retail
        6. Others
    6. Market Attractiveness Analysis
  8. Europe Non-Alcoholic Beverages Market Outlook
    1. Historical Market Size (US$ Bn) and Volume (KL) Analysis, By Market, 2020-2025
      1. By Country
      2. By Product Type
      3. By Packaging Type
      4. By Distribution Channel
    2. Market Size (US$ Bn) and Volume (KL) Analysis and Forecast, By Country, 2026-2033
      1. Germany
      2. France
      3. U.K.
      4. Italy
      5. Spain
      6. Russia
      7. Rest of Europe
    3. Market Size (US$ Bn) and Volume (KL) Analysis and Forecast, By Product Type, 2026-2033
      1. Carbonated Soft Drinks
      2. Juices & Nectar
      3. Bottled Water
      4. Energy & Sports Drinks
      5. Dairy-based Beverages
      6. Plant-based Beverages
      7. RTD Tea and Coffee
      8. Others
    4. Market Size (US$ Bn) and Volume (KL) Analysis and Forecast, By Packaging Type, 2026-2033
      1. Bottles
      2. Cans
      3. Cartons
      4. Pouches
    5. Market Size (US$ Bn) and Volume (KL) Analysis and Forecast, By Distribution Channel, 2026-2033
      1. B2B
      2. B2C
        1. Hypermarkets/Supermarkets
        2. Specialty Stores
        3. Convenience Stores
        4. Pharmacies/drug stores
        5. Online Retail
        6. Others
    6. Market Attractiveness Analysis
  9. East Asia Non-Alcoholic Beverages Market Outlook
    1. Historical Market Size (US$ Bn) and Volume (KL) Analysis, By Market, 2020-2025
      1. By Country
      2. By Product Type
      3. By Packaging Type
      4. By Distribution Channel
    2. Market Size (US$ Bn) and Volume (KL) Analysis and Forecast, By Country, 2026-2033
      1. China
      2. Japan
      3. South Korea
    3. Market Size (US$ Bn) and Volume (KL) Analysis and Forecast, By Product Type, 2026-2033
      1. Carbonated Soft Drinks
      2. Juices & Nectar
      3. Bottled Water
      4. Energy & Sports Drinks
      5. Dairy-based Beverages
      6. Plant-based Beverages
      7. RTD Tea and Coffee
      8. Others
    4. Market Size (US$ Bn) and Volume (KL) Analysis and Forecast, By Packaging Type, 2026-2033
      1. Bottles
      2. Cans
      3. Cartons
      4. Pouches
    5. Market Size (US$ Bn) and Volume (KL) Analysis and Forecast, By Distribution Channel, 2026-2033
      1. B2B
      2. B2C
        1. Hypermarkets/Supermarkets
        2. Specialty Stores
        3. Convenience Stores
        4. Pharmacies/drug stores
        5. Online Retail
        6. Others
    6. Market Attractiveness Analysis
  10. South Asia & Oceania Non-Alcoholic Beverages Market Outlook
    1. Historical Market Size (US$ Bn) and Volume (KL) Analysis, By Market, 2020-2025
      1. By Country
      2. By Product Type
      3. By Packaging Type
      4. By Distribution Channel
    2. Market Size (US$ Bn) and Volume (KL) Analysis and Forecast, By Country, 2026-2033
      1. India
      2. Indonesia
      3. Thailand
      4. Singapore
      5. ANZ
      6. Rest of South Asia & Oceania
    3. Market Size (US$ Bn) and Volume (KL) Analysis and Forecast, By Product Type, 2026-2033
      1. Carbonated Soft Drinks
      2. Juices & Nectar
      3. Bottled Water
      4. Energy & Sports Drinks
      5. Dairy-based Beverages
      6. Plant-based Beverages
      7. RTD Tea and Coffee
      8. Others
    4. Market Size (US$ Bn) and Volume (KL) Analysis and Forecast, By Packaging Type, 2026-2033
      1. Bottles
      2. Cans
      3. Cartons
      4. Pouches
    5. Market Size (US$ Bn) and Volume (KL) Analysis and Forecast, By Distribution Channel, 2026-2033
      1. B2B
      2. B2C
        1. Hypermarkets/Supermarkets
        2. Specialty Stores
        3. Convenience Stores
        4. Pharmacies/drug stores
        5. Online Retail
        6. Others
    6. Market Attractiveness Analysis
  11. Latin America Non-Alcoholic Beverages Market Outlook
    1. Historical Market Size (US$ Bn) and Volume (KL) Analysis, By Market, 2020-2025
      1. By Country
      2. By Product Type
      3. By Packaging Type
      4. By Distribution Channel
    2. Market Size (US$ Bn) and Volume (KL) Analysis and Forecast, By Country, 2026-2033
      1. Brazil
      2. Mexico
      3. Rest of Latin America
    3. Market Size (US$ Bn) and Volume (KL) Analysis and Forecast, By Product Type, 2026-2033
      1. Carbonated Soft Drinks
      2. Juices & Nectar
      3. Bottled Water
      4. Energy & Sports Drinks
      5. Dairy-based Beverages
      6. Plant-based Beverages
      7. RTD Tea and Coffee
      8. Others
    4. Market Size (US$ Bn) and Volume (KL) Analysis and Forecast, By Packaging Type, 2026-2033
      1. Bottles
      2. Cans
      3. Cartons
      4. Pouches
    5. Market Size (US$ Bn) and Volume (KL) Analysis and Forecast, By Distribution Channel, 2026-2033
      1. B2B
      2. B2C
        1. Hypermarkets/Supermarkets
        2. Specialty Stores
        3. Convenience Stores
        4. Pharmacies/drug stores
        5. Online Retail
        6. Others
    6. Market Attractiveness Analysis
  12. Middle East & Africa Non-Alcoholic Beverages Market Outlook
    1. Historical Market Size (US$ Bn) and Volume (KL) Analysis, By Market, 2020-2025
      1. By Country
      2. By Product Type
      3. By Packaging Type
      4. By Distribution Channel
    2. Market Size (US$ Bn) and Volume (KL) Analysis and Forecast, By Country, 2026-2033
      1. GCC Countries
      2. Egypt
      3. South Africa
      4. Northern Africa
      5. Rest of Middle East & Africa
    3. Market Size (US$ Bn) and Volume (KL) Analysis and Forecast, By Product Type, 2026-2033
      1. Carbonated Soft Drinks
      2. Juices & Nectar
      3. Bottled Water
      4. Energy & Sports Drinks
      5. Dairy-based Beverages
      6. Plant-based Beverages
      7. RTD Tea and Coffee
      8. Others
    4. Market Size (US$ Bn) and Volume (KL) Analysis and Forecast, By Packaging Type, 2026-2033
      1. Bottles
      2. Cans
      3. Cartons
      4. Pouches
    5. Market Size (US$ Bn) and Volume (KL) Analysis and Forecast, By Distribution Channel, 2026-2033
      1. B2B
      2. B2C
        1. Hypermarkets/Supermarkets
        2. Specialty Stores
        3. Convenience Stores
        4. Pharmacies/drug stores
        5. Online Retail
        6. Others
    6. Market Attractiveness Analysis
  13. Competition Landscape
    1. Market Share Analysis, 2025
    2. Market Structure
      1. Competition Intensity Mapping By Market
      2. Competition Dashboard
    3. Company Profiles (Details - Overview, Financials, Strategy, Recent Developments)
      1. The Coca-Cola Company
        1. Overview
        2. Segments and Product Type
        3. Key Financials
        4. Market Developments
        5. Market Strategy
      2. PepsiCo, Inc.
      3. Keurig Dr Pepper Inc.
      4. Del Monte Pacific Limited
      5. Nestlé S.A.
      6. Danone S.A.
      7. Monster Beverage Corporation
      8. Red Bull GmbH
      9. SunOpta Inc.
      10. Starbucks Corp.
      11. Asahi Group Holdings
      12. Suntory Holdings Limited
      13. Almarai
      14. Nongfu Spring
      15. Parle Agro
      16. Hector Beverages Private Limited
      17. Bisleri International Pvt. Ltd.
      18. AMUL
      19. Reliance Industries
      20. Refresco
      21. Others
  14. Appendix
    1. Research Methodology
    2. Research Assumptions
    3. Acronyms and Abbreviations

Research Methodology Framework for Market Research Excellence

At Persistence Market Research, we implement a comprehensive, validated, and multi-dimensional approachto market analysis that delivers actionable insights across complex market landscapes. Our methodology combines the analytical rigor of leading consulting firms with innovative research techniques, ensuring robust market assessments that guide strategic decision-making with confidence.

Core Research Philosophy

Our methodology is built on four foundational pillars:

Research Philosophy Image

At Persistence Market Research, our methodology is designed to transcend conventional market studies by combining analytical rigor, multi-source validation, and future-focused insights.

We integrate advanced research frameworks, robust data collection strategies, cutting-edge analytics, and innovative technologies to deliver a 360-degree view of complex markets.

We integrate advanced research frameworks, robust data collection strategies, cutting-edge analytics, and innovative technologies to deliver a 360-degree view of complex markets.

Each stage spanning from strategic scoping and hypothesis-building to competitive intelligence, quality validation, and actionable recommendations is engineered to provide clients with unmatched clarity, precision, and confidence in decision-making.

By embedding innovation and technology at the core, our approach ensures that insights are not only comprehensive but also predictive, empowering businesses to seize opportunities, mitigate risks, and achieve sustainable growth

Research Philosophy Image

Capturing Key Information and Events

During this phase, key research objectives focus on essential information and data points for assessing the market, including:

Research Philosophy Image

TAM-SAM-SOM Framework Implementation

We employ both top-down and bottom-up approaches to ensure accurate market sizing.

Top-Down Market SizingBottom-Up Market Sizing
Universe Definition: Total global/regional market identificationUnit Economics: Average transaction values, purchase frequencies, customer lifecycle
Segmentation Filters: Geographic, demographic, and behavioral constraintsCustomer Segmentation: Detailed buyer persona development and sizing
Market Share Analysis: Competitive landscape assessment and share allocationPenetration Analysis: Market penetration rates by segment and geography
Growth Rate Application: Historical trends and forward-looking growth assumptionsScaling Methodology: Extrapolation techniques with confidence intervals

Validation & Cross-Verification

  • Triangulation: Comparing top-down and bottom-up results for consistency
  • Sensitivity Analysis: Testing key assumptions and parameter variations
  • Peer Benchmarking: Comparison with analogous markets and industry benchmarks
  • Expert Review: External validation through industry specialist consultation

Research Philosophy Image

Forecasting & Projection Modeling

Our proprietary forecasting models incorporate multiple variables and scenarios.

Forecasting Components

  • Historical Trend Analysis: 10-year historical growth patterns and cyclical variations
  • Driver-Based Modeling: Economic indicators, demographic shifts, technology adoption
  • Scenario Planning: Base case, optimistic, and conservative projections
  • Monte Carlo Simulations: Probability-weighted outcomes and risk assessments

Model Validation

  • Back-Testing: Historical accuracy assessment over 3–5-year periods
  • Cross-Validation: Multiple modeling approaches for result comparison
  • External Benchmarking: Comparison with established market forecasts
  • Continuous Calibration: Quarterly model updates based on new data

Comprehensive Data Collection Strategy

Our secondary research phase establishes a robust knowledge base utilizing diverse, credible sources.

Secondary Data Sourcess

  • Industry Publications & Reports
  • Government & Regulatory Data
  • Financial Intelligence (filings & reports)
  • Academic Research & Digital Intelligence

Quality Assurance Protocol

  • Source credibility assessment and publication date validation
  • Data consistency checks across multiple sources
  • Bias identification and neutralization techniques
  • Information gap tracking for primary research prioritization

Research Philosophy Image

Primary Research Excellence

Our primary research methodology employs best-in-class techniques to capture unique market insights.

Quantitative Research Methods

  • Large-Scale Surveys: Statistically representative samples with 95% confidence intervals
  • Survey Methodology: Multi-channel deployment (online, telephone, in-person)
  • Question Architecture and Response Optimization

Qualitative Research Methods

  • Executive Interviews
  • Focus Groups
  • Expert Consultations

Quality Assurance & Validation Framework

Multi-Stage Validation Process

  • Source Verification and Consistency Testing
  • Outlier Detection and Bias Assessment
  • Peer Review Process and External Validation
  • Sensitivity Analysis and Confidence Intervals

Research Philosophy Image

Methodology Validation & Credibility

Our research methodology has been extensively validated through:

  • Academic Partnerships: Collaborations with top-tier business schools and research institutions
  • Client Success Stories: Documented case studies demonstrating research impact and ROI
  • Continuous Benchmarking: Performance comparison with leading global research firms

This comprehensive methodology framework positions Persistence Market Research at the forefront of market intelligence, combining the analytical sophistication of top-tier consulting firms with innovative research techniques. Our approach ensures that every market assessment delivers precise, actionable, and strategically valuable insights that drive business success in competitive market environments.

Ready to unlock your market potential? Contact our research experts to discuss how our validated methodology can transform your strategic decision-making with data-driven market intelligence.

Copyright © 2026 Persistence Market Research. All Rights Reserved

Connect With Us -
Non-Alcoholic Beverages Market Size & Forecast, 2033