


- Advanced Materials
- Nanoclays Market
Nanoclays Market Size, Share, and Growth Forecast 2026 - 2033
Global Nanoclays market by Product Type (Montmorillonite, Kaolinite, Smectite, Others), by End-use Industry (Automotive, Construction, Packaging, Electronics, Consumer Products, Aerospace and Defense, Others), by Distribution Channel (Online, Offline), by Regional Analysis, 2026-2033
Nanoclays Market Size and Trend Analysis
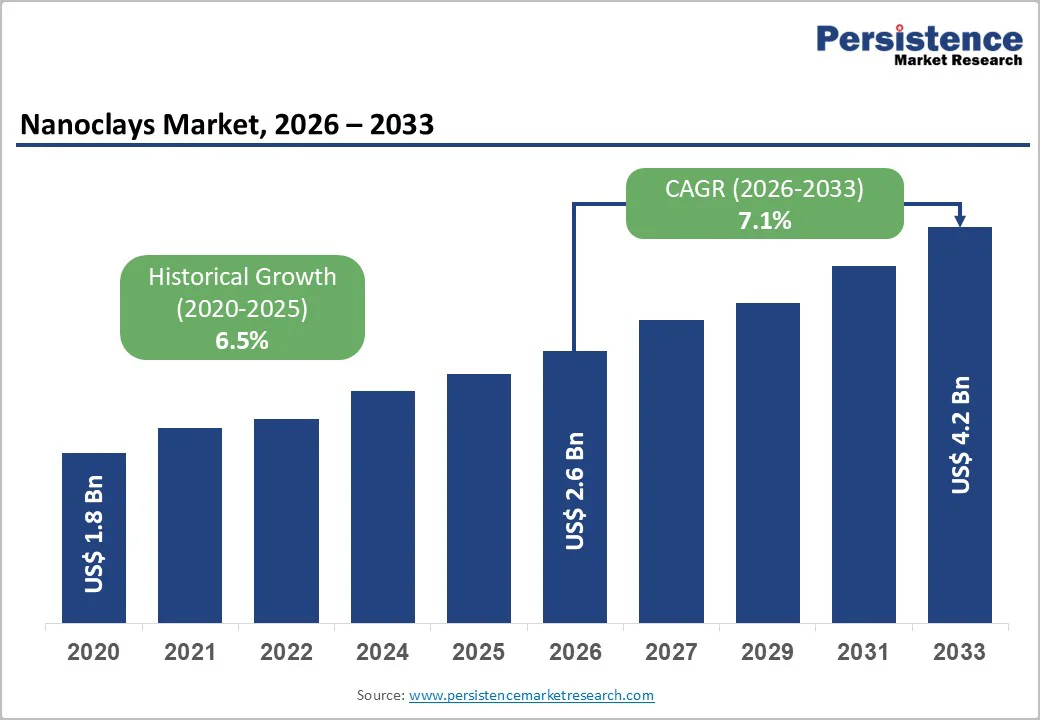
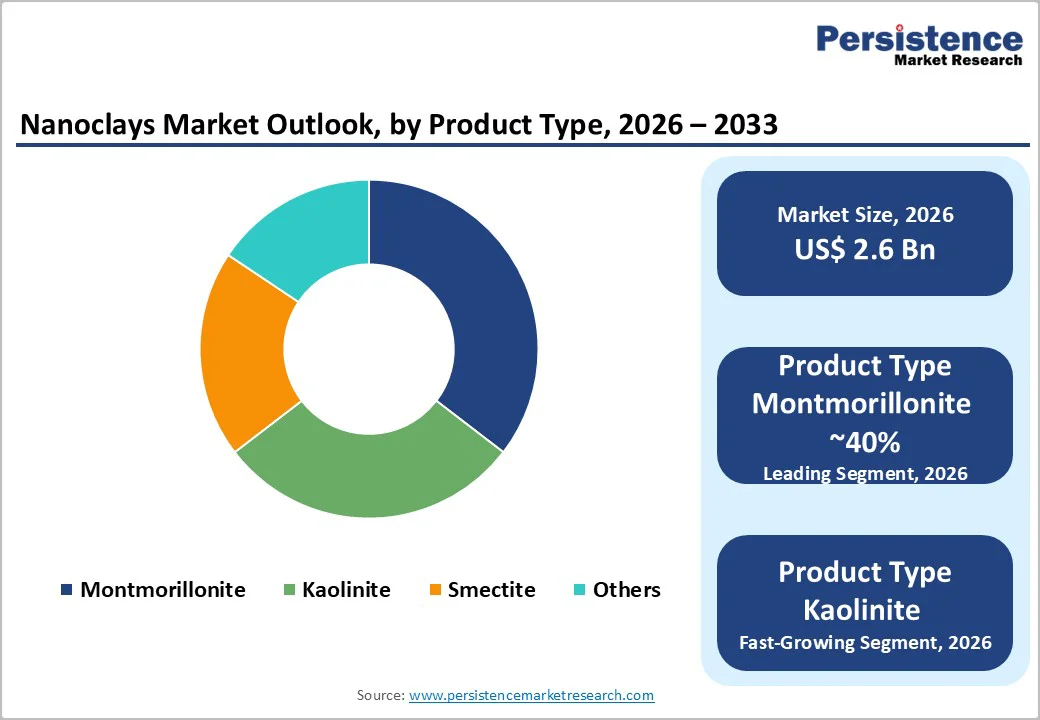
The global nanoclays market size is likely to be valued at US$ 2.6 billion in 2026 and is expected to reach US$ 4.2 billion by 2033, growing at a CAGR of 7.1% during the forecast period from 2026 to 2033.
The Nanoclays market is driven by accelerating demand for lightweight materials in the Automotive and Aerospace sectors, where weight reduction directly improves fuel efficiency and extends electric vehicle range. Additionally, rising sustainability concerns in Packaging industries are propelling adoption of nanoclay-reinforced films, which can reduce oxygen permeability by up to 70% and prevent 15-20% of perishable food losses in North America alone, thereby addressing global food waste challenges. Regulatory frameworks promoting circular economy initiatives and stricter environmental compliance in developed regions further strengthen market expansion through sustainable material adoption.
Key Market Highlights
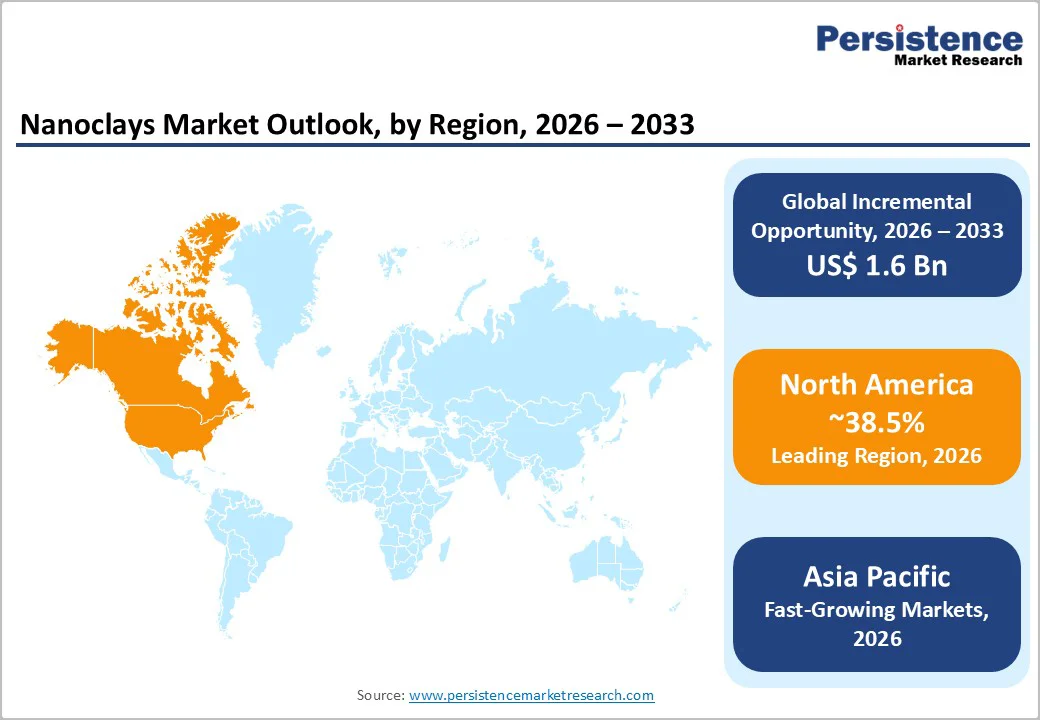
- Leading Region: North America leads the nanoclays market with approximately 38.5% share, driven by advanced manufacturing, strong R&D, and regulations in Automotive, Aerospace, Packaging, and Electronics.
- Fastest-Growing Region: Asia Pacific is the fastest-growing region with around 36.8% share, fueled by industrialization, EV production, packaging demand, and cost advantages in China, India, and Japan.
- Leading Product: Montmorillonite holds the dominant product position with about 40% share due to superior cation-exchange capacity, polymer intercalation, and cost-effective performance.
- Fastest-Growing End-Use: Packaging is the fastest-growing end-use segment, accounting for roughly 35% of consumption, driven by sustainability mandates, food waste reduction, and e-commerce logistics.
- Key Opportunity: Biodegradable polymer nanocomposites with PLA/Nanoclay/ZnO formulations offer strong market opportunities in sustainable packaging, cosmetics, and pharmaceuticals.
| Report Attribute | Details |
|---|---|
|
Nanoclays Market Size (2026E) |
US$ 2.6 Billion |
|
Market Value Forecast (2033F) |
US$ 4.2 Billion |
|
Projected Growth CAGR (2026-2033) |
7.1% |
|
Historical Market Growth (2020-2025) |
6.5% |
Market Dynamics
Market Growth Drivers
Rising Demand for Lightweight Automotive and Aerospace Materials Driven by the Electric Vehicle Revolution
The automotive sector’s transition toward electric vehicles (EVs) and fuel-efficient conventional vehicles is significantly increasing the demand for lightweight polymer nanocomposites reinforced with nanoclays. EV battery packs add roughly 35% to vehicle weight, creating engineering challenges that require lighter structural components. Nanoclay-filled composites provide 3–25% weight reduction compared to traditional talc-filled alternatives, helping automakers meet fuel economy, safety, and performance targets.
Global regulatory pressures in the European Union, United States, and China further encourage OEMs to adopt nanoclay-reinforced polyamide and polypropylene composites in chassis, suspension systems, and engine parts. The U.S. Department of Energy prioritizes lightweight composites as essential enablers of EV performance, while manufacturers leverage nanoclay materials to reduce greenhouse gas emissions and optimize structural efficiency across both automotive and aerospace applications.
Accelerating Adoption of Sustainable and High-Performance Packaging Solutions to Reduce Food Waste
Environmental regulations and growing consumer awareness of sustainability are fueling the adoption of nanoclay-enhanced packaging materials, which represent over 35% of market consumption. Nanoclay-reinforced polymer films significantly improve oxygen and moisture barrier properties, reducing oxygen permeability by up to 70% with just 3–5% loading. These films help extend shelf life, reduce spoilage, and lower the need for thicker, non-recyclable multilayer packaging.
According to the FAO, roughly one-third of global food is wasted, much due to inadequate packaging. Improved nanoclay packaging can prevent 15–20% of perishable food losses in North America. European food packaging exports are growing steadily, and circular economy mandates further encourage manufacturers to implement nanoclay solutions that combine environmental compliance, operational efficiency, and enhanced product protection.
Market Restraints
High Production Costs and Technical Processing Challenges Limiting Wider Adoption of Nanoclays
A major restraint in the nanoclays market is the high production cost and technical complexity of achieving uniform dispersion of clay platelets within polymer matrices. Effective exfoliation requires specialized equipment such as twin-screw extruders and often expensive chemical compatibilizers to prevent particle agglomeration, which can reduce material performance. These factors make processing-intensive nanoclay composites less economically viable for price-sensitive applications.
Despite the U.S. plastic resin industry producing over 84 billion pounds in 2024, nanoclay composites face adoption barriers in transportation, infrastructure, and other end-use sectors. Declines in domestic composite material sales, along with limited capital investment in advanced processing technologies, further restrict broader implementation. Manufacturers operating with narrow margins remain cautious, slowing the market’s overall growth trajectory.
Supply Chain Bottlenecks and Raw Material Volatility Hindering Nanoclay Market Expansion
The nanoclays market is also constrained by supply chain limitations and raw material volatility. High-quality bentonite and montmorillonite feedstocks are concentrated in select regions, where extraction and beneficiation capabilities are limited. Rising labor costs, environmental compliance requirements, and mining challenges contribute to pricing volatility, with bentonite averaging around US$ 70 per ton in 2022. These factors affect the cost competitiveness of nanoclay products.
The global number of specialized facilities for organo-modified nanoclay production is limited, creating bottlenecks that restrict supply expansion. Extended lead times and inconsistent availability discourage manufacturers from relying on nanoclay-reinforced materials for large-scale production, particularly in industries requiring a steady supply and precise performance specifications.
Market Opportunities
Expanding Opportunities in Biodegradable and Bio-Based Nanoclay Composites for Sustainable Packaging and Cosmetics
Regulatory mandates on plastic reduction and rising consumer demand for eco-friendly solutions are driving the adoption of biodegradable nanoclay composites. PLA films reinforced with nanoclays and zinc oxide nanoparticles offer improved thermal resistance and mechanical strength while remaining fully biodegradable. Room-temperature solvent casting avoids energy-intensive extrusion, making industrial-scale adoption economically feasible. These innovations are increasingly applied in food, pharmaceutical, and natural cosmetics sectors seeking certified sustainable ingredients.
Nanoclay-based skincare and makeup formulations are gaining traction due to their natural origins and superior absorption properties. In packaging, bio-based nanoclays are used to extend product shelf life and reduce waste, particularly in regions experiencing rapid urbanization, rising disposable income, and expanding e-commerce logistics, creating strong opportunities for manufacturers to develop sustainable and high-performance materials.
Emerging High-Value Applications of Nanoclays in Electronics, Pharmaceuticals, and Advanced Materials
Nanoclays are increasingly adopted in specialized applications such as pharmaceutical excipients, electronic insulators, and antimicrobial coatings. Smectite clays enhance drug formulations for controlled-release delivery and improved bioavailability. Electronics manufacturers use nanoclay-reinforced resins to improve thermal management, electrical insulation, and flame retardancy in circuit boards and semiconductor packaging, addressing heat and miniaturization challenges.
Research collaborations with aerospace and defense organizations are advancing the development of high-performance nanoclay composites for packaging and structural applications. In cosmetics, nanoclays are used in facial masks, exfoliants, and skincare products for their detoxifying and absorption properties, offering performance advantages over synthetic alternatives while aligning with consumer preferences for naturally derived, non-toxic ingredients.
Category-wise Insights
Product Type Analysis
Montmorillonite holds the leading position in the nanoclays market, commanding approximately 40% market share due to its superior cation-exchange capacity, high surface area, and exceptional intercalation properties in polymer matrices. It is the preferred choice for polymer nanocomposites in packaging, pharmaceuticals, cosmetics, and specialized coatings. Commercial availability in natural and organo-modified forms, combined with proven performance data, makes Montmorillonite the industry standard for manufacturers seeking cost-effective, reliable solutions. Variants such as Cloisite and Bentone are extensively used across applications requiring adsorption and chemical inertness.
The fastest-growing product category includes organo-modified nanoclays and halloysite nanotubes, which are increasingly adopted in advanced applications. These modified clays offer improved compatibility with nonpolar polymers, enhanced dispersibility, and functional performance in industries such as drug delivery, electronics, and high-performance packaging, enabling innovative applications beyond traditional Montmorillonite usage.
End-use Industry Analysis
Packaging is the dominant end-use segment, accounting for approximately 35% of total nanoclay consumption. This segment includes flexible films for food preservation, rigid pharmaceutical containers, and active/intelligent packaging systems with embedded nanosensors. Nanoclay-reinforced films enable thinner, single-layer constructions with excellent barrier performance, aligning with environmental regulations on single-use plastics and circular economy mandates, particularly in Europe and Asia Pacific, while meeting global sustainability and performance requirements.
The fastest-growing end-use industry involves electronics, pharmaceuticals, and cosmetics, where nanoclays are applied for specialized, high-value purposes. Applications such as controlled-release drug delivery, thermal management in electronics, and natural cosmetic formulations leverage nanoclays’ barrier, adsorption, and functional properties, driving adoption in high-margin, technology-driven sectors.
Distribution Channel Analysis
Offline distribution channels dominate the market, representing the larger share that is 57.8% due to the technical expertise and customization required for industrial nanoclay applications. Direct sales to manufacturers and wholesale distribution through specialized distributors allow tailored solutions for polymer composites, packaging, construction, and other high-performance applications, supporting collaboration and technical guidance for optimal material performance.
The fastest-growing distribution channel is online procurement, driven by e-commerce expansion and digital adoption. Small and medium manufacturers increasingly use online platforms for easy access to nanoclays, technical information, and faster logistics. Omnichannel strategies combining digital and physical sales networks enhance market reach and support emerging industrial buyers.
Regional Insights
North America Nanoclays Trends
North America holds the largest regional market share, accounting for approximately 38.5% of global nanoclay consumption, driven by advanced manufacturing infrastructure, strong R&D investment, and strict regulatory frameworks. The U.S., representing over 30% of North American demand, leads adoption in automotive, aerospace, and packaging, where OEM partnerships and industry consolidation accelerate use of nanoclay-reinforced composites in suspension components, brake housings, and structural applications.
Canada is witnessing emerging demand in construction and aerospace, leveraging proximity to mineral resources and specialized processing facilities. Regional manufacturers and major packaging companies are collaborating with nanoclay suppliers to develop sustainable, high-performance alternatives to petroleum-based films, meeting consumer demand for eco-friendly products while enabling efficiency gains through thinner, high-barrier nanoclay films.
Europe Nanoclays Trends
Europe is the second-largest regional market, supported by stringent regulatory frameworks such as REACH and CLP that favor suppliers with comprehensive safety and compliance documentation. The EU Green Deal and circular economy directives drive investment in biodegradable and sustainable nanoclay composites. Germany, France, the UK, and Spain lead innovation in automotive composites, industrial coatings, and sustainable packaging solutions, while Italy, Sweden, and the Netherlands emerge as key research hubs.
European packaging manufacturers are increasingly integrating nanoclays into barrier films to meet strict environmental standards. Worker safety and occupational health regulations have encouraged innovations in nanoclay processing techniques that minimize inhalation risks while maintaining product performance. The market is expanding at a CAGR of 7.8%, reflecting steady growth driven by sustainable and high-performance applications.
Asia Pacific Nanoclays Trends
Asia Pacific is the fastest-growing regional market, accounting for approximately 36.8% of global nanoclay consumption, driven by rapid industrialization, expanding manufacturing capacity, and rising consumer demand in China, India, and ASEAN countries. China, as both a top producer and consumer, is increasing nanoclay applications in electric vehicles, packaging, and architectural coatings. Suppliers like Elementis have expanded production capacity to meet surging demand across 17 Asian countries.
India is emerging as a specialty chemicals and nanocomposite manufacturing hub, with multinational investments supporting polymer nanocomposites for automotive, construction, and packaging sectors. Japan leads in advanced nanoclay processing and polymer composites for electronics and automotive applications. Rising disposable incomes, urbanization, and e-commerce expansion are accelerating packaging demand, making Asia Pacific the primary driver of global nanoclay market growth.
Competitive Landscape
The nanoclays market exhibits a moderately consolidated structure, dominated by established global chemical companies with integrated manufacturing, R&D capabilities, and wide geographic distribution networks. Market leaders maintain advantages through patented nanoclay formulations, technical expertise, and long-standing relationships with major OEM customers, creating switching costs that support premium pricing. Expansion strategies include organic R&D investment and strategic acquisitions of specialized suppliers and complementary technologies.
Mid-sized and emerging regional players compete through specialized product development, geographic focus, cost efficiencies, and tailored technical support for end-use industries. Industry consolidation is accelerating, with strategic partnerships and joint ventures enabling shared R&D, access to complementary technologies, and expansion into high-growth regions. Key differentiators include sustainability certifications, regulatory compliance, and customer process optimization support.
Key Market Developments
- In June 2024, Elementis introduced a 100% naturally derived, hectorite-based suspension and stability solution designed to address formulation challenges in natural skincare products. This product, representing the first launch in a planned Hydroluxe series, generated over 700 customer samples and positioned the company to capture market share in the rapidly expanding US$ 200 million natural rheology modifiers segment.
- In July 2024, Elementis completed operational establishment of its new NiSAT manufacturing facility in Songjiang, China, enabling the company to serve growing demand across 17 Asian countries with localized production and technical support capabilities, resulting in 35% growth in Asian architectural coatings applications and US$ 29 million in identified business opportunities.
- In November 2025, BYK, responding to market consolidation and rising production costs, announced a 5.2% price increase for its additive portfolio effective February 1, 2026, reflecting the industry-wide pressure on manufacturing economics and the company's commitment to R&D investment in sustainable and high-performance additive formulations.
Companies Covered in Nanoclays Market
- BYK Additives
- Elementis Specialties
- Minerals Technologies Inc.
- Clariant
- BASF SE
- Imerys
- Laviosa Chimica Mineraria
- Kunimine Industries
- Techmer PM
- Evonik Industries
- RTP Company
- Sigma-Aldrich/Merck
- Zhejiang Fenghong New Material
- Halloysite Natural Ltd.
- Nanocor Inc.
- Southern Clay Products
- Amino Chemicals
- Hawkins Inc.
Frequently Asked Questions
The global nanoclays market is valued at US$ 2.6 Billion in 2026 and is expected to grow to US$ 4.2 Billion by 2033.
Growth is driven by automotive lightweighting, sustainable packaging, regulatory compliance, and performance enhancement across aerospace, electronics, and pharmaceutical applications.
Montmorillonite dominates with ~40% market share due to superior cation-exchange capacity, polymer intercalation, widespread availability, and cost-effective performance.
North America leads with ~38.5% share, while Asia Pacific is the fastest-growing region with ~36.8% share, fueled by EV production, e-commerce packaging demand, and manufacturing cost advantages.
Biodegradable nanocomposites, specifically PLA/Nanoclay/ZnO formulations, offer strong opportunities in sustainable packaging, cosmetics, and pharmaceuticals.
Major market participants include BASF SE, Evonik Industries, BYK Additives, Clariant, Elementis PLC, and Imerys.


