


- Oil & Gas
- LNG Bunkering Market
LNG Bunkering Market Size, Share, and Growth Forecast, 2026 - 2033
LNG Bunkering Market by Delivery Mode (Ship-to-Ship (STS), Shore/Jetty, Truck-to-Ship, ISO-Tank/Containerized, Pipeline/Direct Jetty), Vessel Type (Containers, Tankers, Bulk Carriers, Offshore Support Vessels (OSVs), Fishing & Coastal Craft, Others), Fuel (Fossil LNG, Bio-LNG/Renewable Methane, Synthetic LNG/E-Methane, Blends, Others), and Regional Analysis for 2026 - 2033
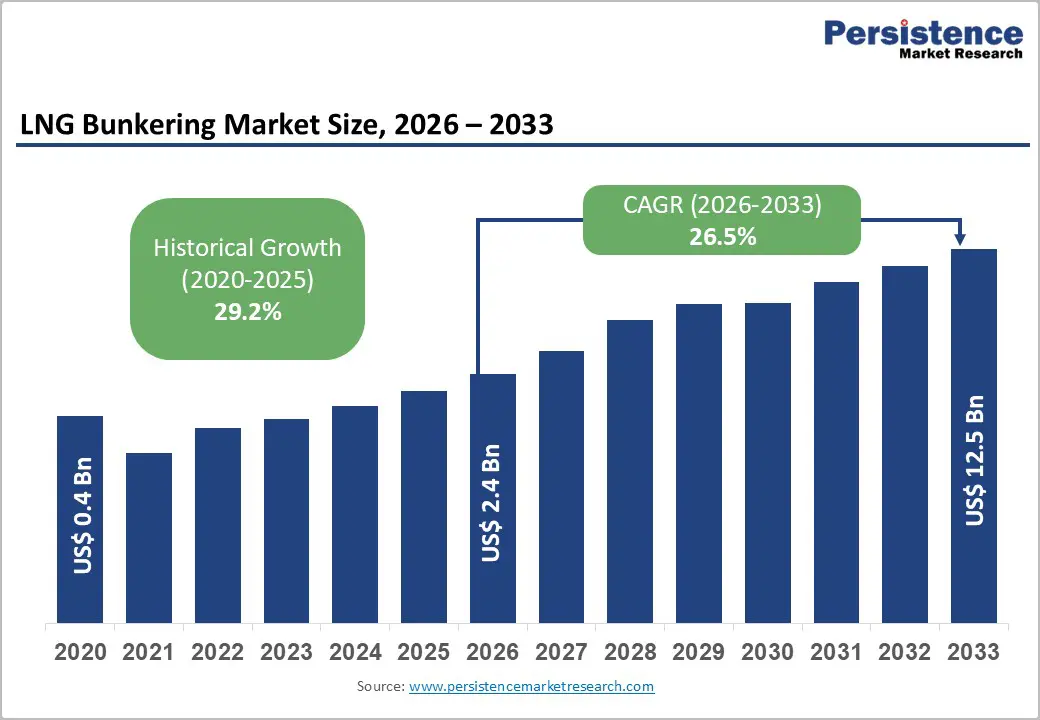
LNG Bunkering Market Share and Trends Analysis (2020: 0.4 billion, CAGR H: 39%)
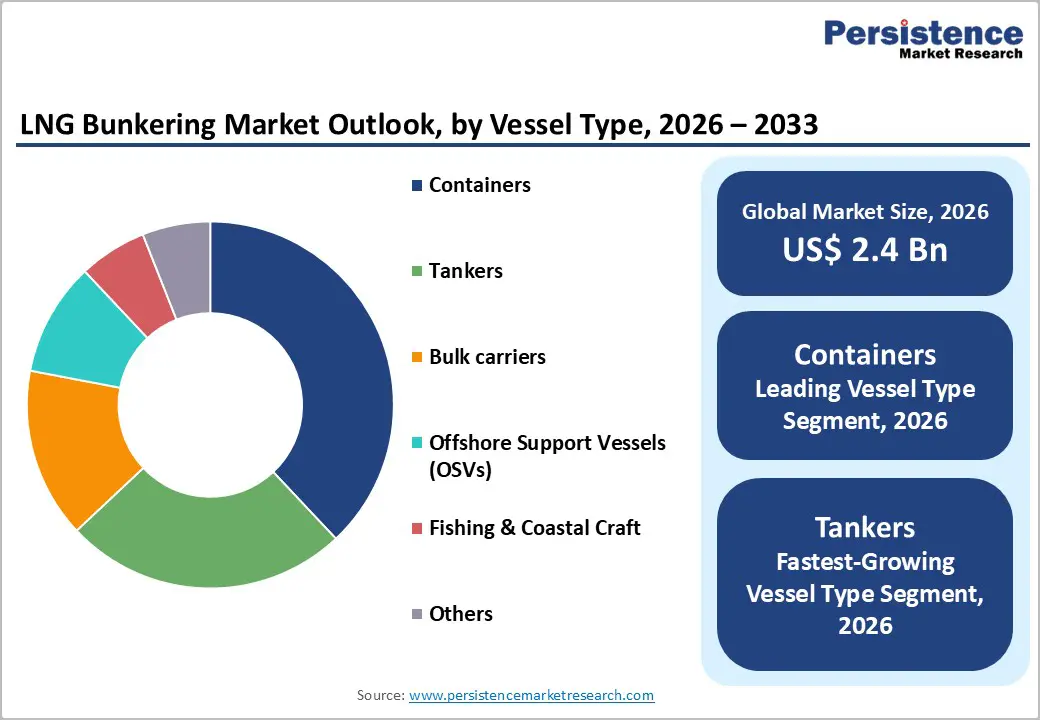
The global LNG bunkering market size is likely to be valued at US$ 2.4 billion in 2026, and is projected to reach US$ 12.5 billion by 2033, growing at a CAGR of 26.5% during the forecast period 2026 - 2033.
Growth is supported by the rising share of dual-fuel vessels in global order books, increasing carbon cost exposure under European regulatory frameworks, and the ongoing expansion of bunkering infrastructure across major maritime hubs. Ports with established liquefied natural gas (LNG) capabilities are strengthening their service networks, which is improving operational reliability and encouraging fleet-level fuel commitments.
Historical expansion between 2020 and 2025 exceeded 35% annually, primarily owing to infrastructure capacity building from a low base and early adopters commissioning new assets. The market is now entering a capital-intensive scaling phase, in which growth rates are moderating as asset deployment cycles lengthen. LNG bunkering demand is becoming structurally embedded in vessel design specifications rather than remaining a discretionary fuel option. Ship owners are integrating dual-fuel propulsion systems into long-term fleet renewal strategies, which is creating predictable bunkering volumes over multi-year operating horizons. As infrastructure networks mature and regulatory compliance costs tighten, the market is evolving into a recurring, infrastructure-backed revenue segment within the broader maritime energy transition.
Key Industry Highlights
- Fastest-growing Fuel: Bio-LNG is anticipated to expand at an estimated 35% CAGR through 2033, supported by lifecycle carbon intensity mandates under the European Union (EU) regulatory frameworks.
- Fuel Mix Dynamics: Fossil LNG is projected to represent approximately 91% of market revenues in 2026, reflecting global liquefaction capacity concentration, while renewable blending penetration is incrementally increasing within regulated corridors.
- Delivery Mode Leadership: Ship-to-ship (STS) bunkering is expected to account for roughly 62% of global revenues in 2026, driven by high-volume transfer efficiency in major hubs such as Singapore and Rotterdam.
- Vessel Type Performance: Container vessels are projected to contribute approximately 38% of market revenues in 2026, reflecting concentration of dual-fuel specifications in long-haul trade routes, while tankers are forecast to grow at nearly 29% CAGR from 2026 to 2033.
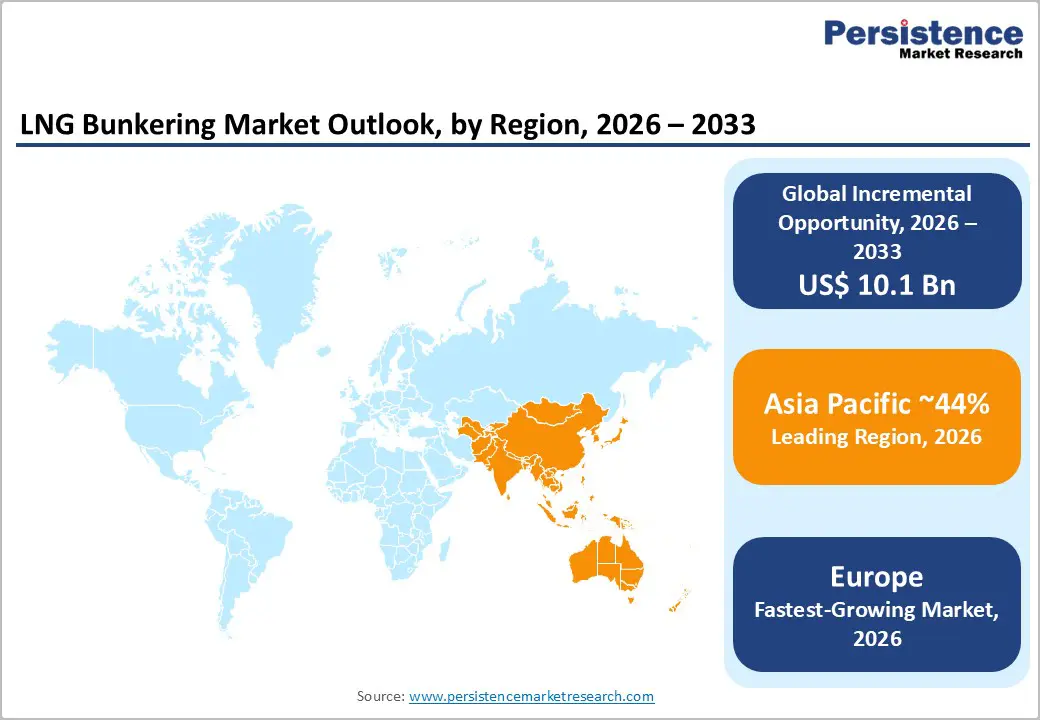
- Regional Positioning: Asia Pacific is expected to lead with an estimated 44% market share in 2026, owing to trade density.
- Fastest-growing Market: The Europe market is projected to grow at nearly 28% CAGR through 2033, underpinned by European Union Emissions Trading (EU ETS) enforcement and FuelEU Maritime compliance dynamics.
- November 2025: Wärtsilä Gas Solutions was contracted to supply fully integrated cargo handling, fuel gas supply and boil-off gas reliquefaction systems for a new LNG bunkering vessel for the Shanghai International Port Group.
| Key Insights | Details |
|---|---|
| LNG Bunkering Market Size (2026E) | US$ 2.4 Bn |
| Market Value Forecast (2033F) | US$ 12.5 Bn |
| Projected Growth (CAGR 2026 to 2033) | 26.5% |
| Historical Market Growth (CAGR 2020 to 2025) | 29.2% |
Market Factors - Growth, Barriers, Opportunity Analysis
EU Carbon Cost Internalization to Spur LNG Adoption
The inclusion of maritime transport in the EU ETS is increasing operating costs for vessels calling at European Union ports. Shipping companies are purchasing emission allowances to cover an increasing share of their verified emissions, and full compliance will take effect by 2026. At the same time, FuelEU Maritime requires progressive reductions in the lifecycle greenhouse gas intensity of the energy used on board ships. This regulatory structure is reshaping voyage economics across European trade corridors. Conventional marine fuels such as heavy fuel oil and marine gas oil are becoming increasingly exposed to carbon pricing mechanisms. As a result, fuel selection is directly influencing operating margins, charter competitiveness, and long-term fleet strategy.
LNG offers a lower carbon dioxide intensity per unit of energy than conventional marine fuels, thereby improving compliance under both the EU ETS and FuelEU Maritime requirements. Shipping operators are actively optimizing fuel portfolios to reduce carbon liability exposure while maintaining propulsion reliability. The impact is most pronounced in the container and tanker segments operating on high-frequency European trade lanes, where cumulative emissions exposure is substantial. Ports such as Rotterdam are expanding LNG bunkering capacity in response to sustained demand signals. Compliance-driven cost management is therefore functioning as a structural demand catalyst rather than a reputational initiative. As carbon pricing continues to tighten, LNG adoption serves as a transitional pathway for decarbonization until zero-emission fuels achieve commercial-scale infrastructure and supply stability.
Infrastructure Capital Intensity to Temper Expansion Velocity
LNG bunkering infrastructure requires specialized cryogenic storage tanks, dedicated bunker vessels, defined safety exclusion zones, and certified handling personnel. Port authorities and energy suppliers are committing significant capital to storage terminals and transfer systems, and these projects typically progress through multi-year permitting, engineering, and construction timelines. Infrastructure density is remaining uneven across global trade corridors. Major hubs operate STS systems that support high-volume transfers, whereas secondary and emerging ports rely on truck-to-ship operations or modular containerized solutions. This imbalance constrains universal adoption because shipowners prioritize routes where reliable multi-port liquefied natural gas availability is already established.
Methane slip is under tight regulatory scrutiny, and lifecycle greenhouse gas (GHG) accounting methodologies are still evolving. Although LNG reduces carbon dioxide emissions relative to heavy fuel oil, regulators are assessing the full climate impact of methane emissions across the value chain. These factors influence long-term investment risk assessments for both suppliers and vessel operators. As a result, market expansion is moderating compared with the rapid buildout phase observed between 2020 and 2025. Capital deployment cycles are extending project timelines, and growth rates are below the earlier 35-40% annual acceleration range.
Bio-LNG Integration to Enhance Revenues and Extend Regulatory Viability
Bio-LNG is emerging as a high-leverage opportunity within existing liquefied natural gas bunkering systems. Renewable methane is chemically identical to fossil-based liquefied natural gas, which means operators are blending it into current storage, transfer, and propulsion systems without requiring engine retrofits or major infrastructure redesign. This compatibility enables suppliers to use established cryogenic assets while progressively reducing lifecycle greenhouse gas intensity. Under EU lifecycle accounting frameworks, renewable methane significantly reduces the reported carbon intensity per unit of energy consumed on board vessels. Even a blending ratio of 10-20% can improve compliance metrics under FuelEU Maritime, which is strengthening its commercial attractiveness within regulated trade corridors.
This regulatory alignment supports premium pricing relative to conventional LNG in markets subject to carbon cost mechanisms. If renewable methane penetration within European bunker volumes increases steadily through 2033, suppliers can enlarge revenue margins while sustaining high utilization rates across existing terminals and bunker vessels. The strategic advantage lies in margin enhancement rather than rapid volumetric substitution. As renewable blending capacity continues to expand, liquefied natural gas bunkering assets are likely to retain long-term value as transition-ready infrastructure that supports progressive decarbonization without becoming stranded capital.
Category-wise Analysis
Delivery Mode Insights
STS deliveries are slated to command an estimated 62% of the LNG bunkering market revenue share in 2026. This delivery mode is dominating operations in high-traffic maritime hubs such as Singapore and Rotterdam, where large ocean-going vessels are requiring high-volume fuel transfers within tight turnaround windows. Dedicated liquefied natural gas bunker vessels are facilitating direct ship-to-ship transfers, which are reducing berth occupancy time and improving port throughput efficiency. The scale economics of STS operations are aligning with the fuel demand profile of large container and tanker fleets, which are consuming substantial volumes per call. As vessel sizes are increasing and trade density remains concentrated in established corridors, STS systems are continuing to provide operational reliability and cost efficiency advantages.
ISO-container and modular bunkering systems are poised to emerge as the fastest-growing segment between 2026 and 2033. These systems are finding a widening foothold in ports where permanent LNG storage and transfer infrastructure has not yet been installed. Lower upfront capital requirements and shorter deployment timelines are enabling faster market entry in secondary and developing maritime regions. Port operators are adopting modular solutions to test demand before committing to large-scale investments, while shipowners are gaining access to liquefied natural gas in routes that previously lacked supply certainty. As geographic coverage is widening beyond primary hubs, ISO-container systems are supporting incremental market penetration and strengthening the overall resilience of global bunkering networks.
Vessel Type Insights
Container vessels are anticipated to lead in 2026, accounting for an estimated 38% of the LNG bunkering market share. Large container ships are consuming significant annual fuel volumes due to long-haul operations and fixed liner schedules that connect major trade corridors. These vessels are frequently calling at established liquefied natural gas-ready hubs, which support consistent bunkering activity. Dual-fuel propulsion systems are increasingly being specified in newbuild container vessel orders, embedding liquefied natural gas consumption into long-term fleet renewal strategies. As shipping lines prioritize fuel flexibility and regulatory compliance, container fleets continue to anchor baseline bunker demand across primary global routes.
Tankers are expected to register the highest 2026-2033 CAGR of approximately 29%. Tanker operators are increasingly integrating dual-fuel engines into newbuild programs to mitigate carbon cost exposure and comply with evolving environmental regulations. Long-haul energy trade routes are intersecting with regulated regions, which is increasing compliance pressure and reinforcing the case for lower-emission fuel alternatives. As emissions accounting frameworks are tightening and voyage-level carbon liabilities are becoming more material, tanker fleets are accelerating liquefied natural gas adoption. This forward momentum is positioning the tanker segment as a significant contributor to incremental bunkering volume growth over the forecast horizon.
Fuel Insights
Fossil-based LNG is projected to be the dominant fuel segment in 2026, accounting for an estimated 91% of total market revenue. Global liquefaction capacity, export terminals, and international trade flows continue to rely primarily on conventional natural gas feedstocks. Existing long-term supply contracts and established shipping logistics are reinforcing this structural dominance. Marine fuel procurement strategies are therefore aligning with available global liquefied natural gas supply chains, which are ensuring scale, pricing transparency, and consistent delivery reliability. As a result, fossil liquefied natural gas is remaining the core volume driver within the bunkering ecosystem in the near term.
Bio-LNG is positioned to record the fastest growth during the 2026-2033 forecast period. Renewable methane production is expanding in regulated jurisdictions, particularly within Europe, where lifecycle greenhouse gas reduction targets are influencing fuel procurement decisions. Shipping companies operating in carbon-exposed trade corridors are prioritizing lower lifecycle emissions to improve their compliance posture. Although current production volumes are limited relative to fossil fuel supply, incremental blending capacity is steadily increasing. Growth in Bio-LNG is therefore exceeding that of conventional liquefied natural gas, even though overall market share remains constrained by feedstock availability and scaling timelines.
Regional Insights
North America LNG Bunkering Market Trends
North America is forecast to secure an estimated 18% of the market for LNG bunkering in terms of revenues in 2026. Activity is concentrated along the United States Gulf Coast, where extensive liquefied natural gas export infrastructure is already supporting storage, liquefaction, and marine logistics. Port operators are leveraging existing terminals and pipeline connectivity to facilitate bunker supply for vessels operating in transatlantic and energy trade corridors. Export-related shipping traffic is reinforcing baseline demand, while domestic coastal shipping is gradually incorporating dual-fuel vessels into fleet renewal programs.
Regulatory pressure in North America is remaining comparatively moderate relative to Europe, as there is no region-wide carbon pricing mechanism equivalent to the EU ETS. As a result, fuel switching decisions are being driven more by operational efficiency and long-term fuel flexibility rather than immediate compliance cost avoidance. Growth is therefore progressing steadily but not accelerating at the pace observed in more regulation-intensive markets. Infrastructure expansion is continuing where commercial viability is clear, particularly in ports with established liquefied natural gas throughput. This measured scaling trajectory is positioning North America as a stable but policy-neutral growth region within the global LNG bunkering landscape.
Europe LNG Bunkering Market Trends
Europe is poised to emerge as the fastest-growing regional market for LNG bunkering, projected to exhibit a CAGR of nearly 28% through 2033. Regional adoption is being driven primarily by regulatory cost internalization under the EU ETS and FuelEU Maritime. These frameworks are increasing the financial exposure associated with carbon-intensive marine fuels and are encouraging shipowners to evaluate lower-emission alternatives. As carbon compliance obligations are tightening, liquefied natural gas is serving as a transitional solution for operators seeking to manage voyage-level emissions liability across European trade routes.
Northern European ports are actively expanding cryogenic storage capacity and ship-to-ship transfer capabilities to accommodate rising bunkering demand. Infrastructure investments are aligning with higher traffic volumes in regulated corridors, particularly for container and tanker fleets. At the same time, bio-LNG blending is gaining traction in the region as lifecycle emission accounting rules reward the integration of renewable methane. Suppliers are leveraging existing liquefied natural gas infrastructure to introduce renewable components without significant system redesign. This combination of regulatory enforcement, infrastructure readiness, and renewable fuel integration is positioning Europe as the most policy-responsive and compliance-driven market within the global market.
Asia Pacific LNG Bunkering Market Trends
Asia-Pacific is projected to dominate the LNG bunkering market, accounting for approximately 44% of the market value in 2026, and the regional market is likely to expand at a CAGR of 26% through 2033. The region maintains its leadership position due to Singapore’s established status as the world’s largest bunkering hub and the ongoing expansion of LNG infrastructure at major Chinese coastal ports. High vessel traffic volumes and dense intra-Asian trade corridors are sustaining consistent bunker demand. Port authorities continue to scale storage capacity and bunker vessel fleets to support increasing calls from dual-fuel vessels.
LNG bunkering market growth in Asia Pacific is being driven primarily by trade intensity and infrastructure depth rather than strict carbon pricing mandates. Shipping operators are prioritizing operational flexibility and long-term fuel optionality, particularly on routes connecting East Asia with Europe and North America. Chinese ports are strengthening their liquefied natural gas supply chains to support both domestic shipping and international transit. As regional economies are expanding maritime throughput, liquefied natural gas bunkering is benefiting from scale effects and hub concentration. This infrastructure-led expansion model positions Asia-Pacific as the largest but moderately paced growth region in the global market.
Competitive Landscape
The global LNG bunkering market structure is expected to feature moderate concentration, with Shell, Total, BP, China National, and ExxonMobil controlling nearly 60% of the total global revenues. Market leadership is being reinforced by vertically integrated supply chains, where companies are controlling upstream liquefied natural gas production, midstream logistics, and downstream bunkering operations. Firms that are owning or co-owning terminal infrastructure are strengthening their ability to secure storage access, optimize throughput, and ensure supply reliability across major maritime hubs. Long-term offtake agreements with shipping lines are stabilizing demand visibility and reducing exposure to short-term price volatility.
Competitive differentiation is also emerging through renewable blending capability, particularly the ability to integrate Bio liquefied natural gas into conventional supply streams in regulated markets. Market positioning is therefore being shaped by infrastructure control and contractual depth rather than purely price competition. Entry barriers are remaining high due to substantial capital requirements for cryogenic storage, bunker vessels, and safety compliance systems. Port access rights and long-term concession agreements are further limiting new entrant participation. As infrastructure ownership is concentrating among established players, competitive advantage is continuing to depend on asset scale, supply security, and regulatory adaptability.
Key Industry Developments
- In January 2026, Galveston LNG Bunker Port (GLBP) signed a strategic agreement with TOTE Services to develop and operate a fleet of dedicated LNG bunkering vessels along the U.S. Gulf Coast. The agreement aims to provide reliable, scalable LNG bunkering to meet rising demand in the greater Houston-Galveston port complex.
- In November 2025, Musel Energy Hub in Spain launched a new bio-LNG supply service for ships and tankers, using its existing LNG terminal infrastructure to deliver renewable methane. The service, operated by Enagás and Reganosa and certified under the International Sustainability and Carbon Certification (ISCC EU), supports decarbonisation by enabling dual-fuel vessels to refuel with lower-carbon fuel.
- In October 2025, India established its first STS LNG bunkering facility at Vizhinjam International Seaport in Kerala, through a strategic partnership between Bharat Petroleum Corporation Limited (BPCL) and Adani Vizhinjam Port Ltd. The facility is being developed on the East-West global shipping corridor and is intended to serve as a dedicated LNG refueling hub for international vessels transiting this major maritime route.
Companies Covered in LNG Bunkering Market
- Shell plc
- TotalEnergies SE
- BP p.l.c.
- China National Offshore Oil Corporation
- ExxonMobil Corporation
- ENN Energy Holdings Limited
- Equinor ASA
- Gasum Oy
- Pavilion Energy Pte Ltd
- Petronas Gas Berhad
- Mitsubishi Corporation
- NYK Line
- CMA CGM S.A.
- Titan Clean Fuels B.V.
Frequently Asked Questions
The global LNG bunkering market is projected to reach US$ 2.4 billion in 2026.
Maturation of port infrastructure networks, increasing carbon cost exposure under European regulatory frameworks, and the ongoing expansion of bunkering infrastructure across major maritime hubs are driving the market.
The market is poised to witness a CAGR of 26.5% from 2026 to 2033.
Strengthening of established LNG capabilities by ports, embedding of LNG in vessel design specifications, and integration of dual-fuel propulsion systems by ship-building companies are creating novel growth opportunities.
Shell plc, TotalEnergies SE, BP, and China National Offshore Oil Corporation are some of the key players in the market.


