


- Display Technologies
- Interactive Touch Table Market
Interactive Touch Table Market Size, Share, and Growth Forecast, 2025 - 2032
Interactive Touch Table Market by Touch Technology (Capacitive, Resistive, Infrared, Surface Acoustic Wave), by Screen Size (Less than 32 inches, 32-65 inches, More than 65 inches), by Application and Regional Analysis for 2025 - 2032
Interactive Touch Table Market Share and Trends Analysis
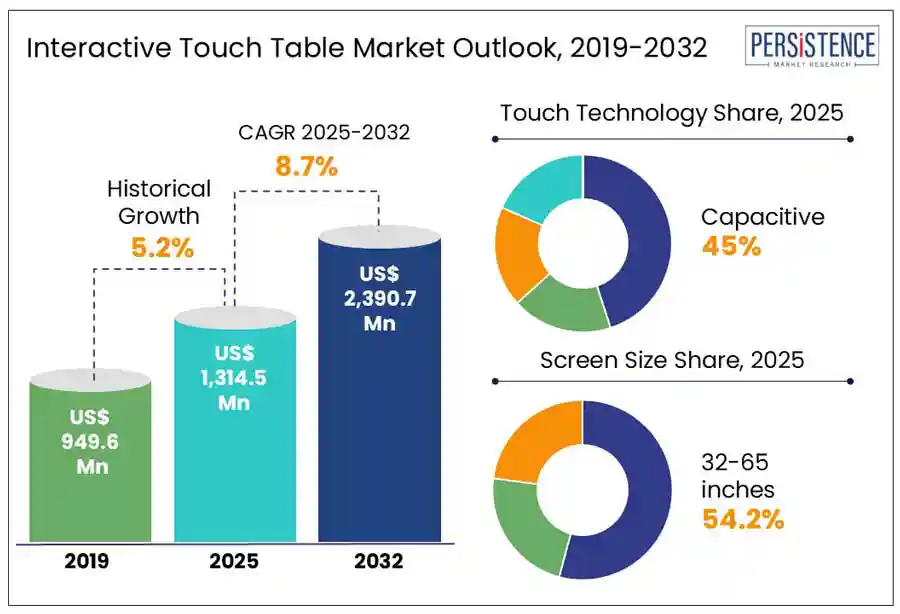
The global interactive touch table market size is projected to rise from US$ 1,314.5 Mn in 2025 to US$ 2,390.7 Mn to witness a CAGR of 8.7% by 2032. The interactive touch table, also known as a smart table, is rapidly gaining traction across various industries because it brings together technology and physical interaction in a way that's never been seen before. These tables are essentially large, multi-touch display surfaces that enable users to interact with digital content, transforming the way people engage with information. With features such as gesture control, real-time collaboration, and the ability to display multimedia content, smart tables are revolutionizing environments such as retail, education, healthcare, and business.
Key Industry Highlights
- North America is estimated to account for a 36.2% share in 2025, driven by the high adoption of advanced technologies and strong investments in interactive display solutions.
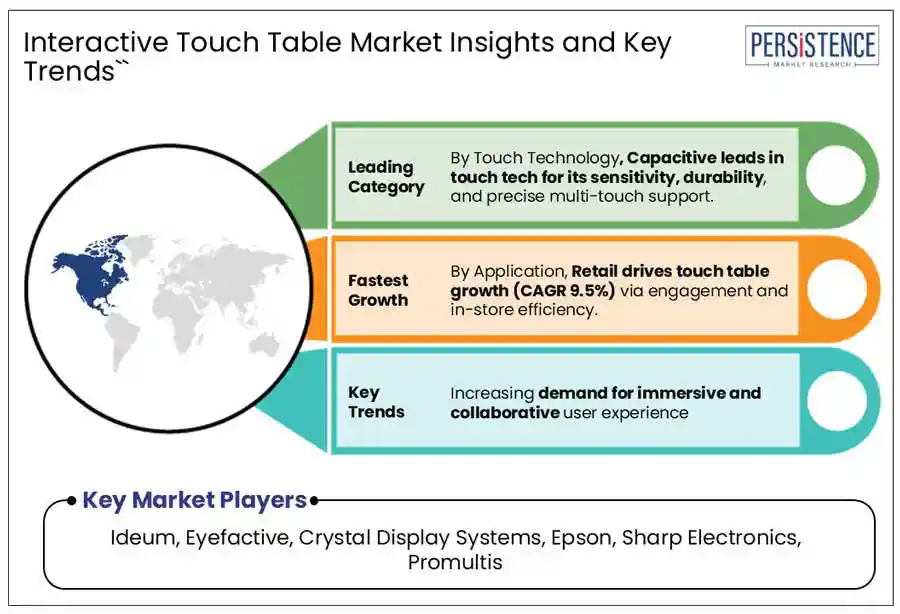
- Capacitive is projected to generate over 40% share in 2025 due to its high sensitivity, durability, multi-touch capabilities, and ability to support precise touch interactions.
- Museums and educational institutions are expected to account for more than 30% share in 2025 due to their increasing adoption of immersive and interactive technologies to enhance visitor engagement and learning experiences.
- Innovations such as multi-touch support, 4K displays, gesture recognition, and AI integration are improving the performance and appeal of interactive touch tables.
- Growing preference for digitized, contactless, and collaborative tools, boosting demand across sectors like corporate offices and libraries.
|
Global Market Attribute |
Key Insights |
|
Interactive Touch Table Market Size (2025E) |
US$ 1,314.5 Mn |
|
Market Value Forecast (2032F) |
US$ 2,390.7 Mn |
|
Projected Growth (CAGR 2025 to 2032) |
8.7% |
|
Historical Market Growth (CAGR 2019 to 2024) |
5.2% |
Market Dynamics
Driver- Enhancing learning through technology integration
Traditional teaching methods often rely on one-way communication, limiting opportunities for interactive group work, which is particularly crucial in subjects requiring problem-solving and teamwork, such as mathematics, science, and creative disciplines. Educational institutions from preschools to universities are increasingly adopting technology to enhance student engagement, foster collaboration, and accommodate diverse learning styles. Interactive touch tables provide a tactile, intuitive interface that transforms traditional learning into an immersive experience, making complex concepts more understandable and encouraging teacher-student interaction. For instance, the National Assessment of Educational Progress (NAEP) shows that 34% of fourth graders read less than 30 minutes a day outside of school, underscoring the need for more engaging educational tools.
In the classroom, students perceive educational information in various ways. For instance, some learners prefer classroom lectures while others benefit from visual or hands-on approaches. The gamification strategies, such as digital spelling bees or vocabulary hunts, turn lessons into interactive challenges. According to the National Center for Education Statistics (NCES), 65% of K-12 teachers are now using digital learning tools daily, reflecting reliance on technology to facilitate interactive learning experiences.
Restraint - Operational and technical barriers to touch table adoption
Interactive touch tables, though sophisticated and user-friendly, are prone to wear and tear in high-traffic environments such as schools and retail stores. Frequent usage often leads to screen degradation, reduced touch sensitivity, and hardware malfunctions. These maintenance issues increase operational costs, disrupting user experience, and adding high downtime
The rapid pace of technological advancement shortens the lifecycle of these devices, with newer models quickly rendering older versions obsolete. This drives up capital expenditure as organizations strive to stay with the traditional setup. Technical issues such as software crashes, connectivity problems, and the need for regular updates further complicate usage, especially for users lacking IT support. A learning curve and resistance to adopting new technology in traditional settings hinder the effective use of touch tables.
Opportunity - AI Integration in Touch Tables
The integration of artificial intelligence (AI) is transforming user engagement, personalization, and operational efficiency, positioning these tables as essential tools in the digital transformation landscape. In healthcare, these smart tables are being used to enhance patient care and improve operations. They offer interactive education for patients and help healthcare professionals make better decisions by simplifying complex medical data. In rehabilitation centers, AI-driven touch tables track patient progress and adjust therapy exercises in real-time, leading to more effective recovery.
In India, AI adoption is booming with 92% of knowledge workers using AI in their daily work, which is well above the global average of 75%. This high level of adoption creates a perfect environment for AI-powered devices. The government is also heavily investing in AI research and development, understanding its potential to boost the economy and drive innovation. These investments are fueling the growth of AI-enhanced touch tables across industries such as healthcare, education, retail, and public services.
Interactive Touch Table Market Key Trend
IoT and Touchless Tech Are Shaping Smart Tables
Interactive touch tables are rapidly gaining popularity as demand for seamless, hygienic, and intuitive user experiences increases. With the rise of touchless technology, users can now interact with these tables using gestures, voice commands, or proximity sensors, reducing the need for physical contact. Retailers are adopting touchless solutions to boost customer engagement, allowing users to browse products, make payments, and receive personalized recommendations without touching a screen.
Moreover, the integration of IoT technology is transforming these touch tables into dynamic, interactive platforms. These IoT-enabled tables improve collaboration in business environments by simplifying communication and information sharing during meetings, presentations, and brainstorming sessions. The growing trend of smart city initiatives is also playing a key role, with IoT-powered touch tables appearing in public spaces as interactive kiosks. These kiosks allow citizens to access information, navigate, and schedule transportation services. For instance, the National Institute of Standards and Technology (NIST) projects that over 75 billion IoT devices will be in use globally by 2025.
Category-wise Analysis
Touch Technology Insights
Based on touch technology, the market is divided into capacitive, resistive, infrared, and surface acoustic waves. Among these, capacitive are projected to generate a market share of over 45% in 2025 due to their high responsiveness, durability, and ability to support multi-touch functionalities. This technology provides a more intuitive user experience with precise touch input and faster response times, making it ideal for various applications. Capacitive touch tables are integrated with advanced features such as gesture recognition and enhanced screen clarity driving their adoption.
Surface acoustic wave (SAW) technology is projected to grow significantly due to its high accuracy, durability, and responsiveness. SAW systems provide precise touch detection, making them ideal for interactive applications in environments where users expect quick and reliable feedback. Technology’s resistance to environmental factors such as dust and moisture further enhances its suitability for public and industrial settings.
Application Insights
By application, the market is segregated into retail, museums & educational institutions, corporate offices, hospitality, trade shows and events, healthcare, industrial, entertainment & gaming, and others. Out of these, museums and educational institutions are expected to account for more than 30% share in 2025. This growth is driven by the increasing adoption of interactive technologies to enhance learning and visitor engagement. It allows for dynamic, hands-on experiences that facilitate deeper understanding and interactivity with exhibits or educational content. Institutions are investing in technology to improve accessibility, attract a tech-savvy audience, and create more immersive and engaging environments.
Retailers are adopting this technology to increase foot traffic, improve customer engagement, and streamline in-store operations. These tables allow customers to browse products, compare features, and even make purchases directly through an engaging digital interface.
Regional Insights
North America Interactive Touch Table Market Trends
North America is predicted to generate a share of around 36.2% in 2025, driven by the need for collaborative and personalized learning. In the U.S., K-12 settings and STEM programs are adopting these technologies to enhance student engagement through hands-on, visual, and tactile learning. Higher education institutions such as MIT, Stanford, and various public colleges are implementing interactive displays in classrooms, libraries, labs, and lounges to support dynamic, experiential learning over traditional lectures.
Interactive touch tables are also being embraced by the corporate sector for real-time collaboration, prototyping, and presentations, particularly in architecture, media, and engineering industries. Retail and hospitality are contributing to market growth through immersive, contactless customer experiences, while Canada advances digital adoption through the $1.2 billion CDAP program, supporting over 71,000 businesses.
Asia Pacific Interactive Touch Table Market Trends
Governments across the Asia Pacific are making big moves to build up their digital infrastructure, with a strong focus on creating smarter classrooms, cities, and workplaces. For example, China's 14th Five-Year Plan emphasizes enhancing education and public services through digital technologies, while Japan is driving the demand with its focus on technological innovation and smart education initiatives. South Korea is also getting creative with its smart city projects, where the Ministry of Land, Infrastructure, and Transport is installing interactive touch tables in public areas to help people access information and stay engaged.
In India, the Ministry of Education is working to modernize education by promoting digital learning environments and the use of interactive technologies in classrooms, especially in Rajasthan. Advancements in display technology and manufacturing processes have led to a reduction in the cost of interactive touch tables, making them more accessible to a broader range of businesses and educational institutions in countries like China and India. The shift toward collaborative work environments in countries such as Japan and South Korea has increased the demand for these devices which facilitate real-time collaboration and support teamwork and innovation.
Europe Interactive Touch Table Market Trends
Germany's digital landscape is booming, with 78.9 million internet users in early 2025, representing a 93.5% penetration rate. The country’s strong push towards Industry 4.0 and its focus on digital transformation in key sectors such as manufacturing and education are driving this growth. The country's technological advancement, coupled with a tech-savvy Gen Z, 55% of whom are using AI tools to enhance career prospects, creates a conducive environment for the adoption of interactive touch tables, especially in sectors such as manufacturing, education, and retail.
In the UK, the Digital Inclusion Action Plan aims to address 1.6 million people living offline by promoting digital literacy and access, facilitating the integration of interactive technologies in public services and education. The Benelux region is witnessing smart city initiatives and the digital transformation of public spaces, with interactive tables being deployed in libraries, transportation hubs, and municipal offices for wayfinding and real-time service updates. In France, the tourism, cultural heritage, and hospitality sectors are embracing interactive touch tables to provide multilingual, immersive experiences in museums and high-end hospitality venues, enhancing the customer experience with tech-forward services like digital menus and bookings.
Competitive Landscape
The global interactive touch table market is fragmented, comprising both large international companies and a wide range of smaller regional and niche players. They focus on innovations in display resolution, touch sensitivity, multi-user functionality, and aesthetic design. Many vendors have also expanded their offerings to include both hardware and software ecosystems, providing customized user interfaces and content management solutions that enhance end-user experience.
Key Industry Developments
- In August 2024, Ideum launched the Tasting Table, an interactive touch table bundled with the Wine Experience software, designed to enhance wine tastings. The software helps guests learn about the tasting process and share their experiences, offering a deeper and more engaging wine experience.
- In August 2024, Optoma launched its new IFP53 interactive touch panel, featuring Google EDLA certification for seamless integration with Google tools and educational apps. Enhanced with AI capabilities, multi-user collaboration, and environmental sensors, the IFP53 aims to transform classrooms.
- In April 2023, HDFocus launched a new 43-inch interactive multi-touch screen table featuring a 10-point HD touchscreen, dual Android and Windows systems, and network connectivity. It includes wireless chargers on all corners, a built-in piggy bank with coin slot, customizable LED lighting that syncs with music, and an illuminated, logo-ready display cube.
Companies Covered in Interactive Touch Table Market
- Ideum
- Eyefactive
- Crystal Display Systems
- Promultis
- Pro Display
- TOUCH-TABLE
- LifeSize Touch Ltd
- Palas Software Pvt. Ltd
- Epson
- Sharp Electronics
- Genee
- Loxit Limited
Frequently Asked Questions
The global market is projected to be valued at US$ 1,314.5 Mn in 2025.
Increasing demand for immersive and collaborative user experience is the key market driver.
The market is poised to witness a CAGR of 8.7% from 2025 to 2032.
Integration of smart features such as voice control, real-time insights, and IoT connectivity presents a significant opportunity.
Ideum, Eyefactive, Crystal Display Systems, and Promultis are among the leading key players.


